

Introduction
Osteosarcoma, the most common primary malignant bone tumor in children and young adults, demonstrates substantial histopathologic heterogeneity that complicates diagnosis and treatment monitoring [1,2]. Although histopathology remains the reference standard, it is invasive and may not adequately reflect whole-tumor biology due to spatial sampling limitations [3]. Multiparametric magnetic resonance imaging (MRI), particularly diffusion-weighted imaging (DWI) and dynamic contrast-enhanced MRI (DCE-MRI), provides non-invasive biomarkers of the tumor micro-environment, including cellularity and vascularity [4-6]. Quantitative perfusion parameters such as Ktrans and Ve have been associated with angiogenesis and microvessel density [7-9], whereas apparent diffusion coefficient (ADC) values reflect cellular density and necrotic changes [10-12]. The combined use of perfusion and diffusion imaging has shown potential for improving tumor characterization and treatment response assessment [13-15]. However, despite these advances, subtype-specific characterization of vascular permeability in osteosarcoma using quantitative DCE-MRI remains incompletely established, as most studies have focused on overall tumor assessment or treatment response rather than detailed inter-subtype differentiation [4-5]. In particular, although DWI and perfusion-based MRI parameters have been investigated, the integrated relationship between perfusion-derived metrics and diffusion parameters in reflecting histopathologic heterogeneity across osteosarcoma subtypes has not been fully elucidated [3,14].
Additionally, variability in imaging protocols and limited sample sizes in rare subtypes have constrained the generalizability of existing findings.
Therefore, this study aimed to evaluate the association between quantitative DCE-MRI parameters (Ktrans, Kep, Ve) and ADC values across osteosarcoma subtypes, and to explore their relationships in reflecting histopathologic heterogeneity.
Material and methods
Study design and patients
This retrospective observational study was conducted at a tertiary referral center in Surabaya, Indonesia, following approval from the institutional research ethics committee. The requirement for informed consent was waived due to the retrospective design. A total of 43 patients with histopathologically confirmed osteosarcoma who underwent pre-treatment MRI between January 2023 and February 2025 were included.
Patients were eligible if they had histopathologically confirmed osteosarcoma, available pre-treatment MRI including both DCE-MRI and DWI, and adequate image quality for quantitative analysis. Patients were excluded if they had received prior chemotherapy, radiotherapy, or surgical intervention before MRI, had incomplete imaging protocols, or demonstrated severe motion artifacts or poor image quality.
MRI acquisition protocol
All examinations were performed on a 3.0-T system (Magnetom Skyra, Siemens Healthineers, Erlangen, Germany) using a dedicated surface coil. Patients were positioned supine and immobilized to minimize motion artifacts. The imaging protocol included axial and coronal T1-weighted fast spin-echo sequences (repetition time/echo time [TR/TE]: 500-800/10-15 ms) and T2-weighted or short tau inversion recovery sequences (TR/TE: 3000-5000/70-90 ms), with a slice thickness of 4 mm and an interslice gap of 0.5 mm.
DCE-MRI was performed using a T1-weighted gradient-echo sequence with a temporal resolution of approximately 3-5 s per phase. A gadolinium-based contrast agent (gadobutrol, 1.0 mmol/ml) was administered intravenously at a dose of 0.1 mmol/kg using a power injector at a rate of 2-3 ml/s, followed by a 20 ml saline flush. DWI was performed using a single-shot echo-planar imaging sequence with b-values of 0 and 800 s/mm², and ADC maps were automatically generated.
Image analysis
Image analysis was performed using dedicated software (Tissue 4D, Siemens Healthineers). Quantitative pharmacokinetic parameters, including Ktrans, Kep, and Ve, were derived using the Tofts model with a population-based arterial input function.
Regions of interest (ROIs) were manually placed on enhancing solid tumor components by two independent musculoskeletal radiologists (with 24 and 35 years of experience), who were blinded to the histopathological results. ROIs were drawn as circular or oval regions (5-25 mm²) and positioned to include viable tumor tissue while avoiding necrotic, cystic, calcified, or hemorrhagic areas, as well as adjacent normal tissue. ADC measurements were obtained from corresponding regions on ADC maps, guided by DWI and post-contrast images.
Interobserver agreement was assessed using the intraclass correlation coefficient (ICC) for continuous variables (Ktrans, Kep, Ve, and ADC). Agreement was excellent, with an ICC of 0.92.
Statistical analysis
Statistical analysis was performed using IBM SPSS Statistics (version 29.0; IBM Corp., Armonk, NY, USA). Continuous variables were expressed as mean ± standard deviation. Normality of data distribution was assessed using the Shapiro-Wilk test. As the imaging parameters were not normally distributed, non-parametric statistical methods were applied.
Differences in quantitative MRI parameters (Ktrans, Kep, Ve, and ADC) across osteosarcoma subtypes were evaluated using the Kruskal-Wallis test, followed by Dunn-Bonferroni post hoc analysis for pairwise comparisons. Correlations between ADC values and DCE-MRI parameters were assessed using Spearman’s rank correlation coefficient. Diagnostic performance was evaluated using receiver operating characteristic (ROC) curve analysis, including calculation of the area under the curve (AUC), 95% confidence intervals (CI), and optimal cut-off values based on the Youden index. Multivariable logistic regression analysis was performed to evaluate the combined predictive value of Ktrans, Kep, Ve, and ADC for subtype differentiation. Model performance was assessed using the Nagelkerke R² statistic. A sample size calculation was performed for the overall cohort; however, because analyses were stratified by osteosarcoma subtype, several subgroup sample sizes were small. Therefore, regression analyses were considered exploratory and interpreted with caution. A p-value < 0.05 was considered statistically significant.
Results
Mean value of ADC and quantitative parameters of osteosarcoma subtype
The mean values of diffusion and perfusion parameters across different osteosarcoma subtypes are summarized in Table 1. Considerable variability was observed among subtypes, reflecting distinct biological and stromal characteristics.
Table 1
Mean value of apparent diffusion coefficient (ADC) and quantitative parameters of osteosarcoma subtype
The significance of MRI parameters across osteosarcoma subtypes
To determine the discriminatory capacity of quantitative MRI biomarkers, we applied the Kruskal-Wallis test to evaluate inter-subtype variability in perfusion and diffusion parameters. This analysis revealed that the significance of MRI metrics was not uniform across osteosarcoma subtypes, with certain parameters demonstrating robust discriminatory power while others failed to reach statistical significance. The results are summarized in Table 2.
Table 2
Kruskal-Wallis and post hoc analyses of dynamic contrast-enhanced magnetic resonance imaging parameters across osteosarcoma subtypes
Correlation between ADC values and quantitative DCE-MRI parameters across osteosarcoma subtypes
Correlation analyses were performed between ADC values and DCE-MRI quantitative parameters (Ktrans, Kep, and Ve) within each histopathological subtype. The objective was to determine whether diffusion metrics reflecting tumor cellularity are linked with perfusion-derived markers of vascularity and microenvironmental dynamics. The results indicated subtype-dependent patterns, with most comparisons showing weak or non-significant associations, while selected parameters revealed borderline or significant correlations. The detailed outcomes are presented in Table 3.
Table 3
Correlation between apparent diffusion coefficient (ADC) values and quantitative dynamic contrast-enhanced magnetic resonance imaging parameters across osteosarcoma subtypes
AUC values of osteosarcoma subtypes
Diagnostic performance of the quantitative MRI parameters was further evaluated using ROC curve analysis to determine their ability to discriminate between osteosarcoma subtypes. The AUC was used as the primary measure of classification accuracy, with values closer to 1.0 indicating stronger diagnostic power. This analysis allowed for direct comparison of the relative contribution of diffusion- and perfusion-derived biomarkers in capturing the heterogeneity of osteosarcoma. The results, illustrated in Table 4, highlight variable discriminatory performance across subtypes, reflecting differences in vascularity, cellularity, and extracellular matrix composition.
Table 4
Diagnostic performance of quantitative dynamic contrast-enhanced magnetic resonance imaging in differentiating osteosarcoma subtypes based on area under the curve (AUC) analysis
Multivariable analysis of quantitative MRI parameters (Ktrans, Kep, Ve, and ADC values)
Multivariable logistic regression analysis was performed to assess the combined contribution of quantitative MRI parameters (Ktrans, Kep, Ve, and ADC) to osteosarcoma subtype differentiation. This approach allows evaluation of both overall model performance and the independent effect of each parameter. The results, including model significance and explanatory power, are summarized in Table 5.
Table 5
Multivariable logistic regression analysis of quantitative magnetic resonance imaging parameters for osteosarcoma subtype classification
Tofts model results for osteosarcoma subtypes
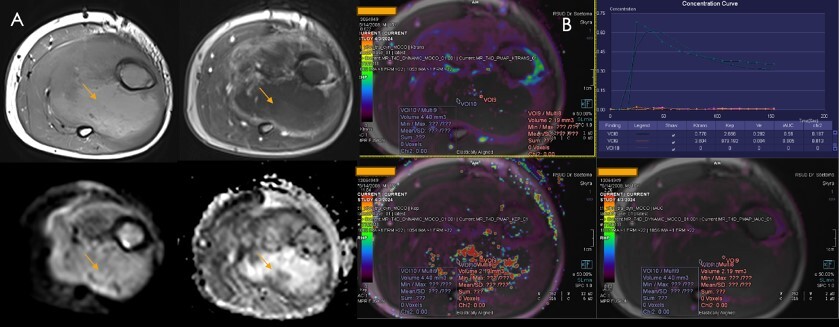
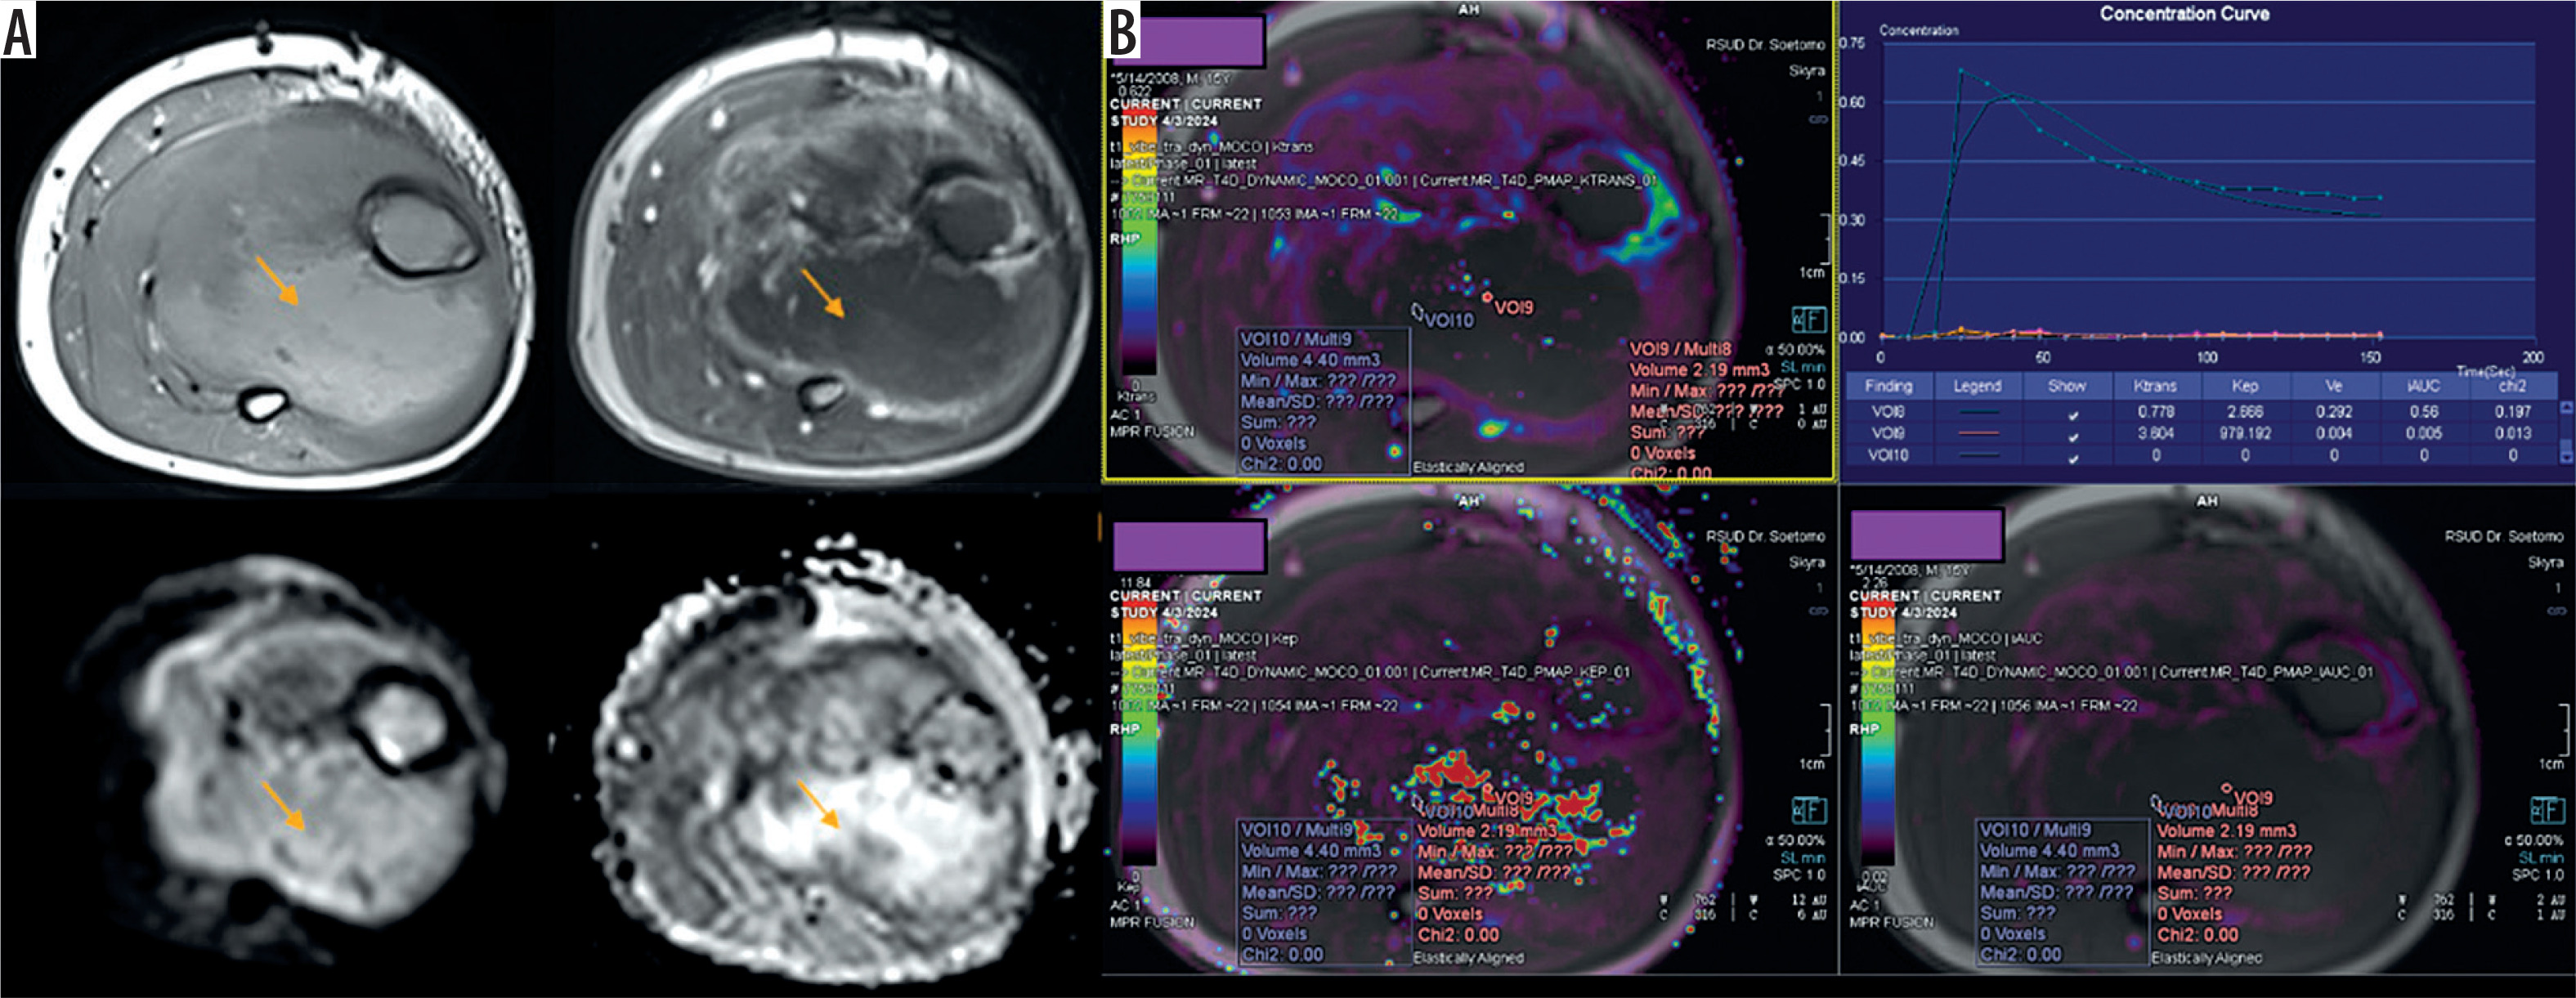
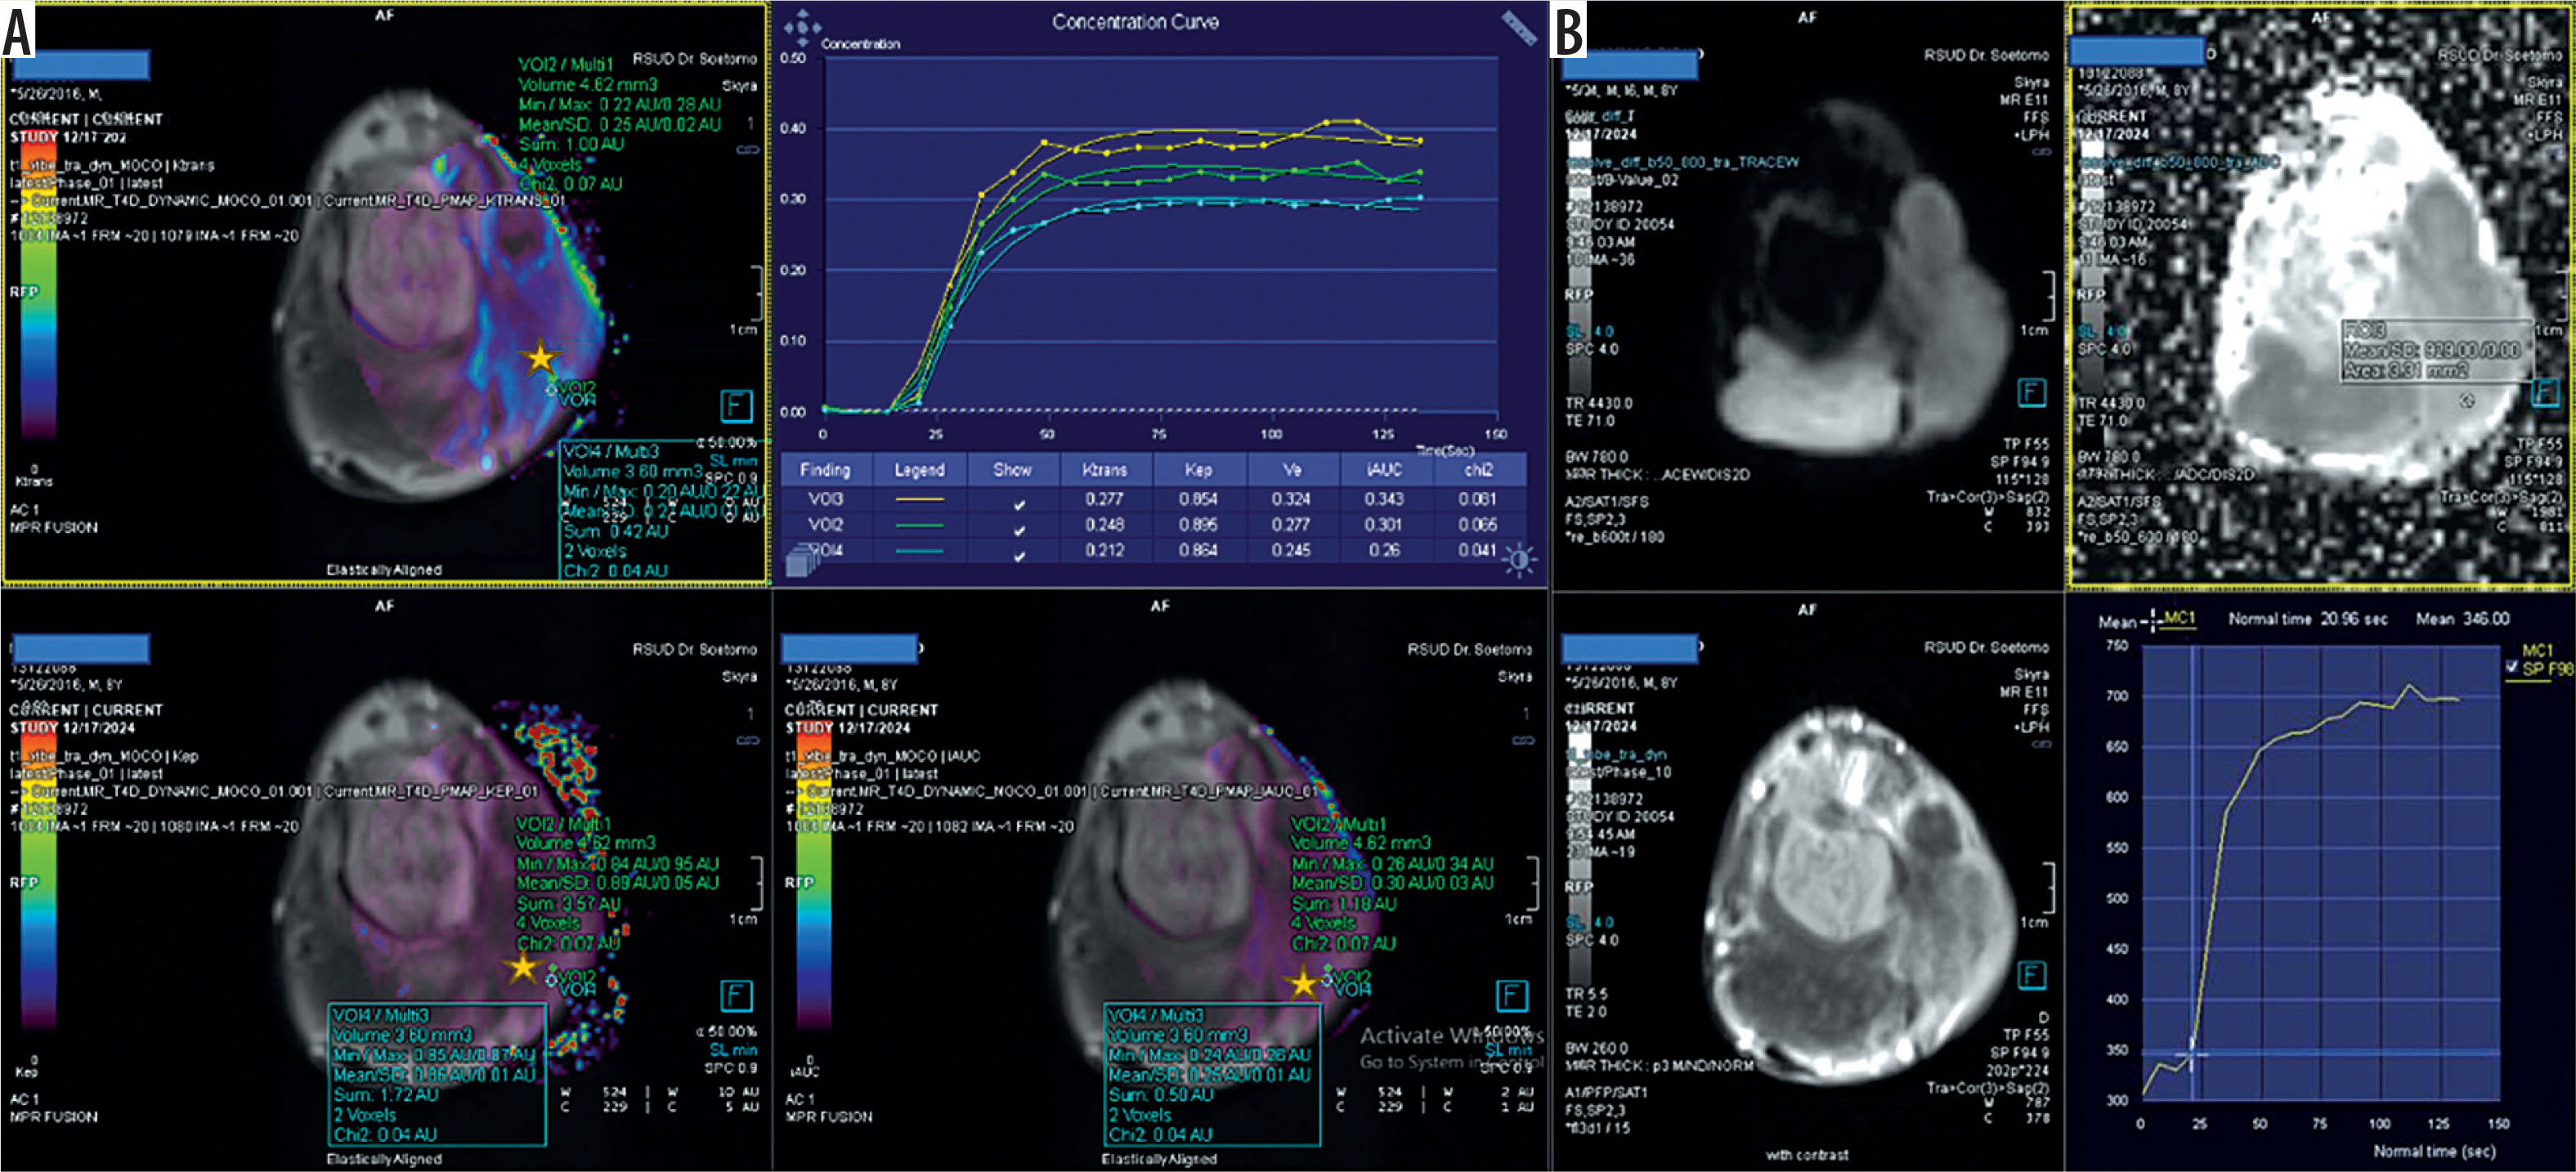
Representative multiparametric MRI findings derived from the Tofts pharmacokinetic model across different osteosarcoma subtypes are illustrated in Figures 1-8. These figures demonstrate qualitative and quantitative variations in perfusion and diffusion characteristics, highlighting distinct imaging patterns associated with each histopathological subtype.
Figure 1
Multiparametric magnetic resonance imaging (MRI) in a 15-year-old male patient with histopathologically confirmed osteoblastic osteosarcoma was analyzed using the Tofts pharmacokinetic model. (A) Axial T1-weighted and post-contrast images demonstrate a heterogeneously enhancing intramedullary lesion (arrows), indicating viable tumor components. Diffusion-weighted imaging shows relatively low apparent diffusion coefficient (ADC) values, consistent with restricted diffusion and high tumor cellularity. (B) Quantitative dynamic contrast-enhanced MRI (DCE-MRI) analysis using the Tofts pharmacokinetic model demonstrates elevated Ktrans (≈2.7-3.3) and Kep (≈20.0-26.9), with low Ve (≈0.13-0.16), indicating high vascular permeability with rapid contrast exchange in a compact extracellular space. The concentration–time curve shows rapid enhancement followed by washout, consistent with aggressive malignant perfusion kinetics. Regions of interest (ROIs) were placed within enhancing solid tumor components while avoiding necrotic areas
Overall, osteoblastic osteosarcoma is characterized by elevated perfusion parameters with restricted diffusion, reflecting high tumor cellularity and active angiogenesis. In contrast, fibroblastic subtypes exhibit relatively lower perfusion metrics with higher ADC values, consistent with reduced vascularity and increased extracellular matrix components. Chondroblastic tumors demonstrate intermediate-to-high perfusion with variable diffusion characteristics, corresponding to mixed cellular and chondroid stromal composition. Giant cell-rich subtypes show heterogeneous diffusion and moderate perfusion features, reflecting their mixed histologic architecture. Extraskeletal osteosarcoma displays markedly elevated vascular permeability with low extracellular volume, while telangiectatic osteosarcoma demonstrates a diffusion-dominant pattern with low perfusion parameters and high ADC values, consistent with cystic, hemorrhagic, and necrotic tumor components.
These subtype-specific perfusion–diffusion patterns further support the role of multiparametric MRI in non-invasive characterization of osteosarcoma heterogeneity.
Discussion
Osteosarcoma is a highly heterogeneous primary bone malignancy characterized by diverse histopathologic subtypes, variable tumor microenvironment, and complex imaging manifestations, all of which contribute to challenges in diagnosis, prognostic assessment, and treatment monitoring [1]. Conventional imaging provides important structural information; however, it may not fully capture the underlying biological behavior of the tumor, particularly in terms of vascularity, cellularity, and extracellular matrix composition [2]. In recent years, multiparametric MRI techniques, including DWI and DCE-MRI, have emerged as valuable tools for non-invasive evaluation of tumor heterogeneity, enabling quantitative assessment of tissue microstructure and perfusion characteristics across osteosarcoma subtypes [3]. Therefore, this study aimed to evaluate the association between quantitative DCE-MRI parameters and ADC values across osteosarcoma subtypes, and to explore their relationships in reflecting histopathologic heterogeneity.
This study evaluated whether quantitative DCE-MRI parameters and ADC values can characterize histopathologic heterogeneity across osteosarcoma subtypes using both univariable and multivariable statistical approaches. This study was conducted at a tertiary referral center in Surabaya, Indonesia, which may influence subtype distribution due to referral patterns and case selection. The main findings were that Ktrans and ADC differed significantly across subtypes on Kruskal-Wallis analysis (Ktrans: H = 13.852, p = 0.017; ADC: H = 13.045, p = 0.023), whereas Kep (p = 0.201) and Ve (p = 0.182) did not. In addition, Ktrans demonstrated the strongest diagnostic performance on ROC analysis, particularly in osteoblastic (AUC = 0.806, 95% CI: 0.652-0.960, p = 0.021) and chondroblastic (AUC = 0.775, 95% CI: 0.611-0.939, p = 0.033) subtypes, while multivariable logistic regression revealed subtype-dependent model performance without stable independent predictors.
The use of non-parametric statistical methods was appropriate because the imaging variables were not normally distributed, which is consistent with the intrinsic biological heterogeneity of osteosarcoma [4]. Variations in vascularity, extracellular matrix composition, necrosis, and hemorrhage across subtypes contribute to skewed distributions of diffusion and perfusion metrics, as widely described in oncologic imaging literature [5,6].
Among the evaluated parameters, Ktrans demonstrated the strongest discriminatory performance across osteosarcoma subtypes. This is biologically plausible because Ktrans reflects vascular permeability and perfusion, processes closely linked to angiogenesis [5,7]. The significant post hoc difference between chondroblastic and telangiectatic tumors (p = 0.029) further supports subtype-specific vascular differences. Prior studies have shown that Ktrans correlates with microvessel density and vascular endothelial growth factor expression, supporting its role as a surrogate biomarker of tumor vascularity [8]. Additionally, DCE-MRI parameters have been associated with treatment response and survival outcomes in osteosarcoma, reinforcing their clinical relevance [9].
The higher Ktrans values observed in chondroblastic osteosarcoma compared with osteoblastic tumors may reflect differences in stromal architecture, as chondroid-rich tumors are characterized by a looser extracellular matrix and increased interstitial space, which can facilitate greater contrast leakage and permeability [10]. This distinction highlights the importance of pharmacokinetic modeling, as Ktrans quantitatively reflects both tissue perfusion and capillary permeability, whereas semi-quantitative time-intensity curve analysis mainly characterizes early signal enhancement patterns without directly measuring contrast transfer kinetics or microvascular exchange processes [11].
ADC also differed significantly across subtypes (p = 0.023), although its discriminatory performance was less pronounced than that of Ktrans. This finding is consistent with the role of ADC as a marker of cellular density and extracellular diffusion [12]. Lower ADC values in osteoblastic tumors reflect increased cellularity and dense osteoid matrix causing restricted diffusion, whereas higher ADC values in telangiectatic tumors correspond to necrotic or fluid-rich components with increased extracellular diffusion, consistent with prior imaging studies [13]. Previous studies have demonstrated that ADC is particularly useful in assessing treatment response rather than subtype differentiation alone [14]. In contrast, Kep and Ve did not demonstrate statistically significant differences across osteosarcoma subtypes, as reflected by the Kruskal-Wallis test (Kep: H = 7.27, p = 0.201; Ve: H = 7.57, p = 0.182). This may be attributed to their sensitivity to multiple biological and methodological factors, including necrosis, extracellular composition, and modeling variability [15]. Therefore, the lack of statistical significance likely reflects dataset heterogeneity and limited sample size rather than absence of biological relevance, as variability in tumor composition combined with small sample sizes can reduce statistical power, increase variance, and obscure true associations in quantitative imaging studies [16].
Correlation analysis showed predominantly weak or non-significant relationships between ADC and DCE-MRI parameters across subtypes, indicating that diffusion and perfusion metrics capture distinct aspects of tumor biology [17]. A significant inverse correlation between ADC and Ktrans was observed in the giant cell-rich subtype (ρ = –0.90, p = 0.037), while a borderline inverse correlation was noted between ADC and Ve in osteoblastic tumors (ρ = –0.482, p = 0.050). However, these findings should be interpreted cautiously due to small subgroup sizes. Overall, these results support a multiparametric imaging approach rather than reliance on a single biomarker [18].
The diagnostic performance of quantitative MRI parameters was interpreted using established AUC thresholds, where values of 0.70-0.80 indicate acceptable discrimination and 0.80-0.90 indicate excellent discrimination [19]. In this study, Ktrans demonstrated excellent performance in the osteoblastic subtype (AUC = 0.806, 95% CI: 0.652-0.960, p = 0.021) and good performance in the chondroblastic subtype (AUC = 0.775, 95% CI: 0.611-0.939, p = 0.033), whereas other subtypes showed lower diagnostic performance, including fibroblastic (AUC = 0.667, 95% CI: 0.397-0.937, p = 0.263), telangiectatic (AUC = 0.611, 95% CI: 0.312-0.910, p = 0.519), extraskeletal (AUC = 0.583, 95% CI: 0.256-0.911, p = 0.683), and giant cell-rich subtypes (AUC = 0.542, 95% CI: 0.171-0.912, p = 0.809). The relatively wide CI observed, particularly in smaller subgroups, likely reflect limited sample size and variability within subtypes, which may affect the precision of the estimated diagnostic performance [20]. These findings suggest that perfusion-related biomarkers are more effective in differentiating subtypes with more distinct vascular characteristics, as DCE-MRI parameters such as Ktrans are closely associated with angiogenesis, microvessel density, and vascular permeability, which vary across tumor subtypes and contribute to imaging-based differentiation [21].
Multivariable logistic regression analysis demonstrated heterogeneous model performance across osteosarcoma subtypes. Statistically significant overall models were observed for telangiectatic (p = 0.012; Nagelkerke R² = 0.507) and chondroblastic (p = 0.026; Nagelkerke R² = 0.410) subtypes, indicating moderate explanatory power. In contrast, osteoblastic (p = 0.156; Nagelkerke R² = 0.194), fibroblastic (p = 0.296; Nagelkerke R² = 0.168), and giant cell-rich (p = 0.959; Nagelkerke R² = 0.029) subtypes showed non-significant models. Importantly, no individual imaging parameter remained consistently independently significant across subtypes, although borderline associations were observed for ADC and Kep in specific subtypes.
The discrepancy between univariable significance and multivariable instability is methodologically expected, particularly in datasets with correlated predictors and limited sample sizes, where regression coefficients may become unstable and lose significance in multivariable models [22]. When predictors are biologically interrelated and partially collinear, and when subgroup sample sizes are small, regression coefficients become unstable and sensitive to minor variations in the dataset [23]. The apparent perfect model fit in the extraskeletal subtype (R² = 1.000) is most likely attributable to sparse data and statistical separation rather than a true biological effect. Classical statistical literature highlights that regression models with limited sample sizes and multiple predictors are prone to overfitting and poor generalizability [24].
Accordingly, the logistic regression findings should be interpreted as exploratory, particularly in the context of limited sample size and multiple correlated predictors, which are known to reduce model stability and generalizability [25]. Previous imaging biomarker studies have similarly demonstrated that multivariable models incorporating diffusion and perfusion parameters may improve characterization of tumor heterogeneity, although their performance is often dependent on cohort size and data distribution [26]. Furthermore, combined diffusion and perfusion-based MRI approaches have been shown to provide complementary biological information, but stable and reproducible predictive modelling typically requires larger, prospective, and multicenter datasets [27].
The excellent interobserver agreement (ICC = 0.92) represents a key strength of this study, indicating high reproducibility of ROI-based measurements and supporting the reliability of the quantitative analysis.
The imaging examples presented in Figures 1-8 further illustrate the spectrum of perfusion–diffusion phenotypes across osteosarcoma subtypes. Osteoblastic osteosarcoma (Figure 1) demonstrates a perfusion-dominant pattern characterized by markedly elevated Ktrans and Kep with low Ve and restricted diffusion, reflecting highly cellular tumor architecture with active angiogenesis, consistent with prior studies demonstrating associations between DCE-MRI parameters, microvessel density, and tumor cellularity in osteosarcoma [28]. In contrast, fibroblastic subtypes (Figures 2 and 5) show relatively low Ktrans and Kep with moderate Ve and increased ADC values, consistent with reduced vascularity and fibrous stromal composition, as described in musculoskeletal DWI literature [3,29]. Chondroblastic osteosarcoma (Figures 3 and 4) exhibits intermediate-to-high Ktrans and Kep values with moderate Ve, reflecting increased vascular permeability within a chondroid extracellular matrix that facilitates contrast diffusion, in agreement with prior reports on subtype-specific perfusion characteristics [3,30]. Giant cell-rich osteosarcoma (Figure 6) demonstrates an intermediate phenotype with moderate perfusion parameters and heterogeneous ADC values, corresponding to its mixed cellular and stromal composition, which has been associated with heterogeneous imaging appearances in bone tumors [31]. Extraskeletal osteosarcoma (Figure 7) shows a distinct pattern of markedly elevated Ktrans with low Ve and delayed washout, suggesting highly permeable but structurally abnormal tumor vasculature, consistent with DCE-MRI studies of aggressive soft-tissue sarcomas [32]. In contrast, telangiectatic osteosarcoma (Figure 8) demonstrates a diffusion-dominant phenotype characterized by low Ktrans and Kep with high Ve and markedly elevated ADC values, reflecting cystic, hemorrhagic, and necrotic tumor components, which have been well documented in radiologic descriptions of this subtype [33]. Collectively, these imaging patterns reinforce that multiparametric MRI captures subtype-specific differences in vascular permeability, extracellular volume, and tumor cellularity, supporting its role in non-invasive characterization of osteosarcoma heterogeneity [34].
Figure 2
Multiparametric magnetic resonance imaging (MRI) in a 52-year-old male patient with histopathologically confirmed fibroblastic osteosarcoma was analyzed using the Tofts pharmacokinetic model. (A) Quantitative dynamic contrast-enhanced MRI (DCE-MRI) maps derived from the Tofts pharmacokinetic model demonstrate relatively low Ktrans (≈0.21-0.48) and Kep (≈0.65-1.30), with moderate Ve (≈0.30-0.34), indicating reduced vascular permeability and slower contrast exchange within a moderately expanded extracellular matrix. (B) The concentration–time curve shows rapid initial enhancement followed by a plateau pattern without significant washout, consistent with less aggressive perfusion kinetics. Diffusion-weighted imaging demonstrates relatively elevated apparent diffusion coefficient (ADC) values, reflecting increased extracellular diffusion associated with fibrous stromal composition and lower cellular density. Regions of interest (ROIs) were placed within enhancing tumor components while avoiding necrotic or cystic areas
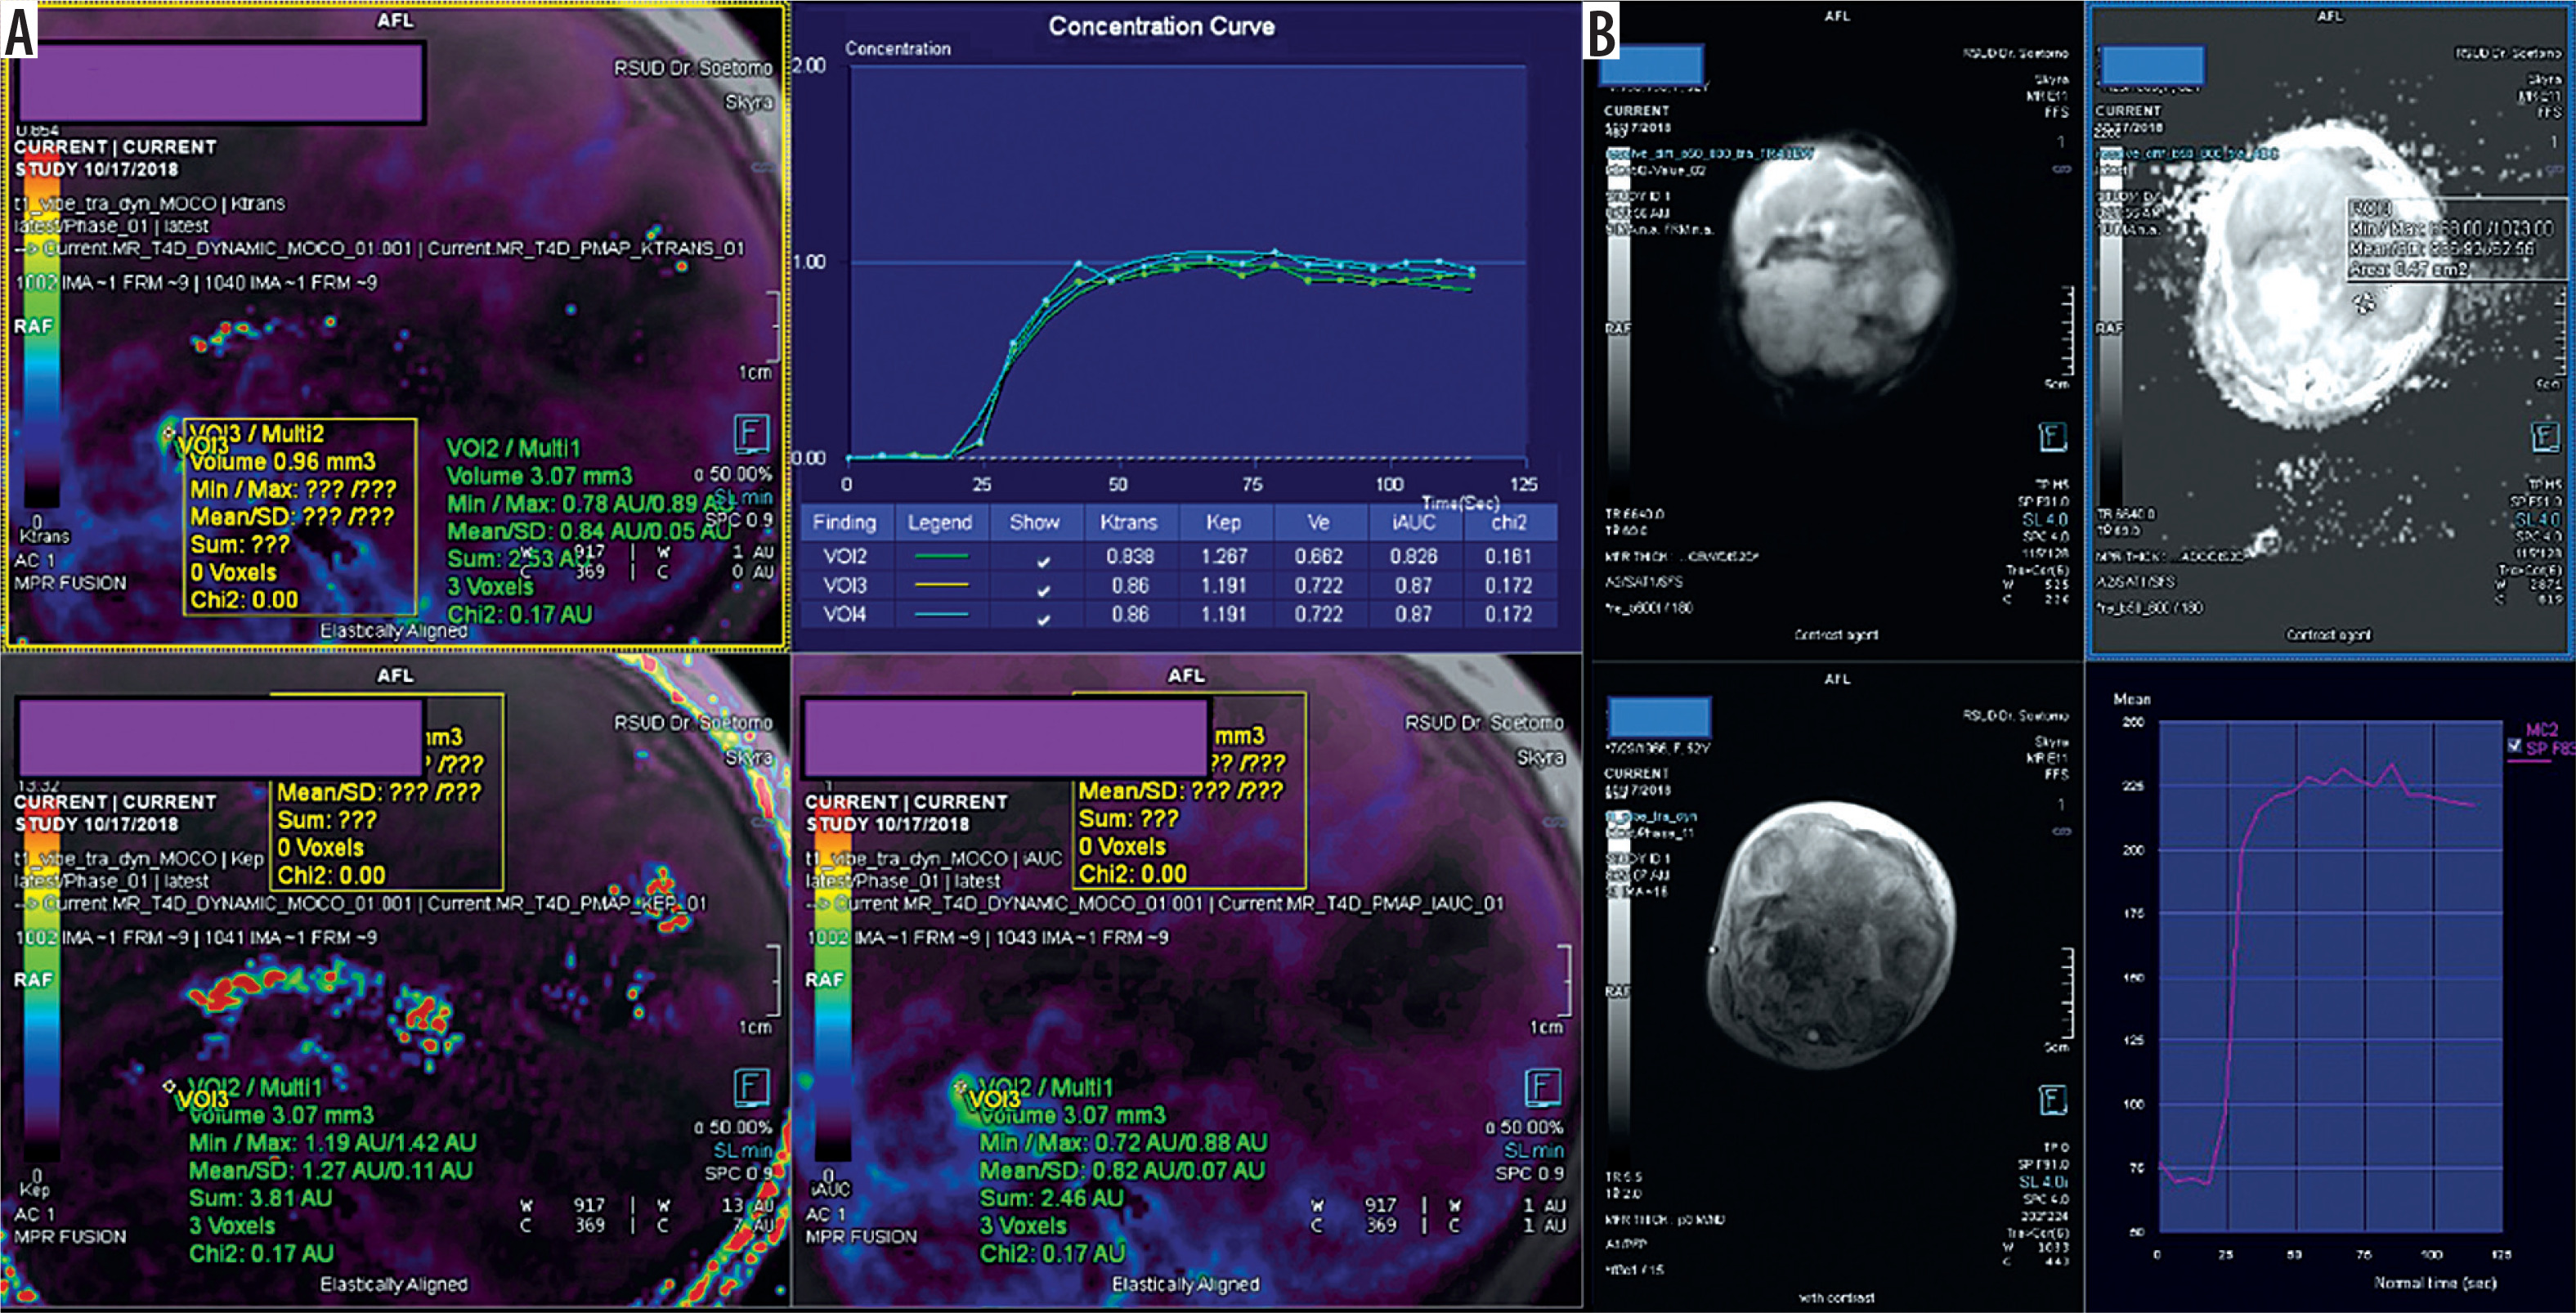
Figure 3
Multiparametric magnetic resonance imaging (MRI) in a 13-year-old male patient with histopathologically confirmed chondroblastic osteosarcoma was analyzed using the Tofts pharmacokinetic model. (A) Quantitative dynamic contrast-enhanced MRI (DCE-MRI) maps derived from the Tofts pharmacokinetic model demonstrate elevated Ktrans (≈1.4-1.9) and Kep (≈5.8-6.7), with moderate Ve (≈0.18-0.23), indicating increased vascular permeability and active contrast exchange within a moderately expanded extracellular matrix. (B) The concentration–time curve shows rapid initial enhancement followed by gradual washout, consistent with malignant perfusion kinetics. Diffusion-weighted imaging demonstrates intermediate-to-elevated apparent diffusion coefficient (ADC) values, reflecting mixed tumor cellularity and chondroid extracellular matrix composition. Regions of interest (ROIs) were placed within enhancing solid tumor components while avoiding necrotic or cystic areas
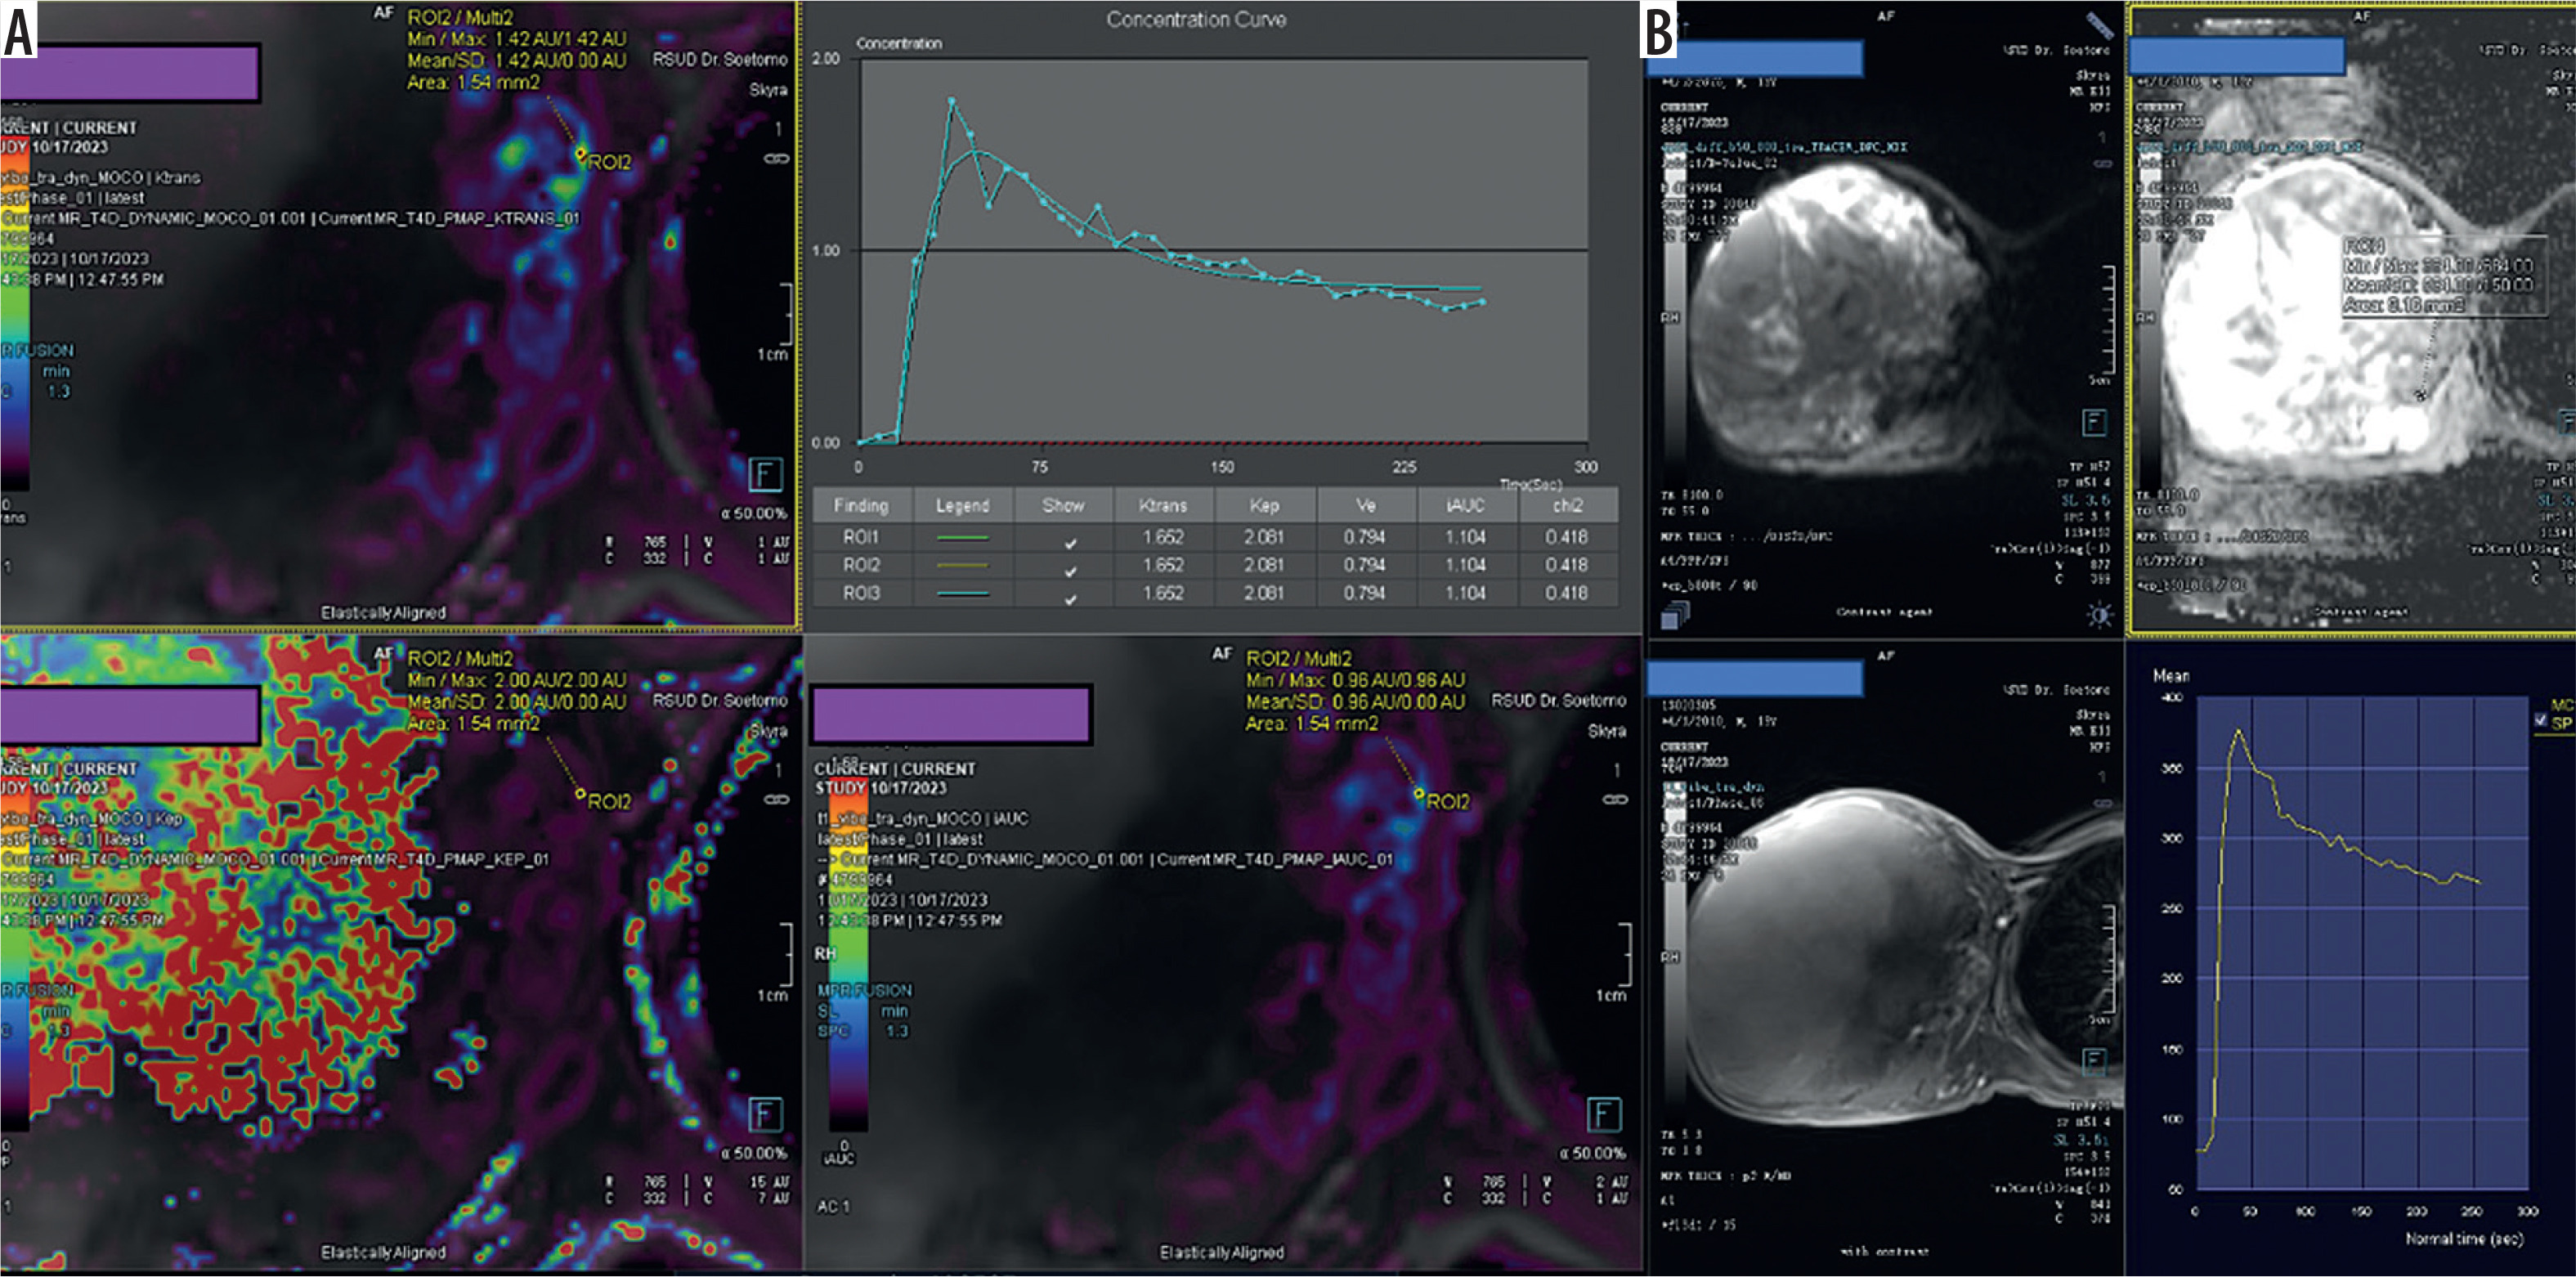
Figure 4
Multiparametric magnetic resonance imaging (MRI) in an 18-year-old male patient with histopathologically confirmed chondroblastic osteosarcoma was analyzed using the Tofts pharmacokinetic model. Quantitative dynamic contrast-enhanced MRI (DCE-MRI) maps (A) demonstrated elevated Ktrans (≈2.14-2.26) and Kep (≈12.4-12.6), with moderate Ve (≈0.17-0.18), indicating increased vascular permeability and rapid contrast exchange within a moderately expanded extracellular space. The concentration–time curve shows rapid initial enhancement followed by gradual washout, consistent with malignant perfusion kinetics. Diffusion-weighted imaging (B) demonstrated relatively low-to-intermediate apparent diffusion coefficient (ADC) values, reflecting restricted diffusion due to viable tumor cellularity interspersed with chondroid matrix. Regions of interest (ROIs) were placed on enhancing solid tumor components while avoiding necrotic or cystic areas (yellow stars)
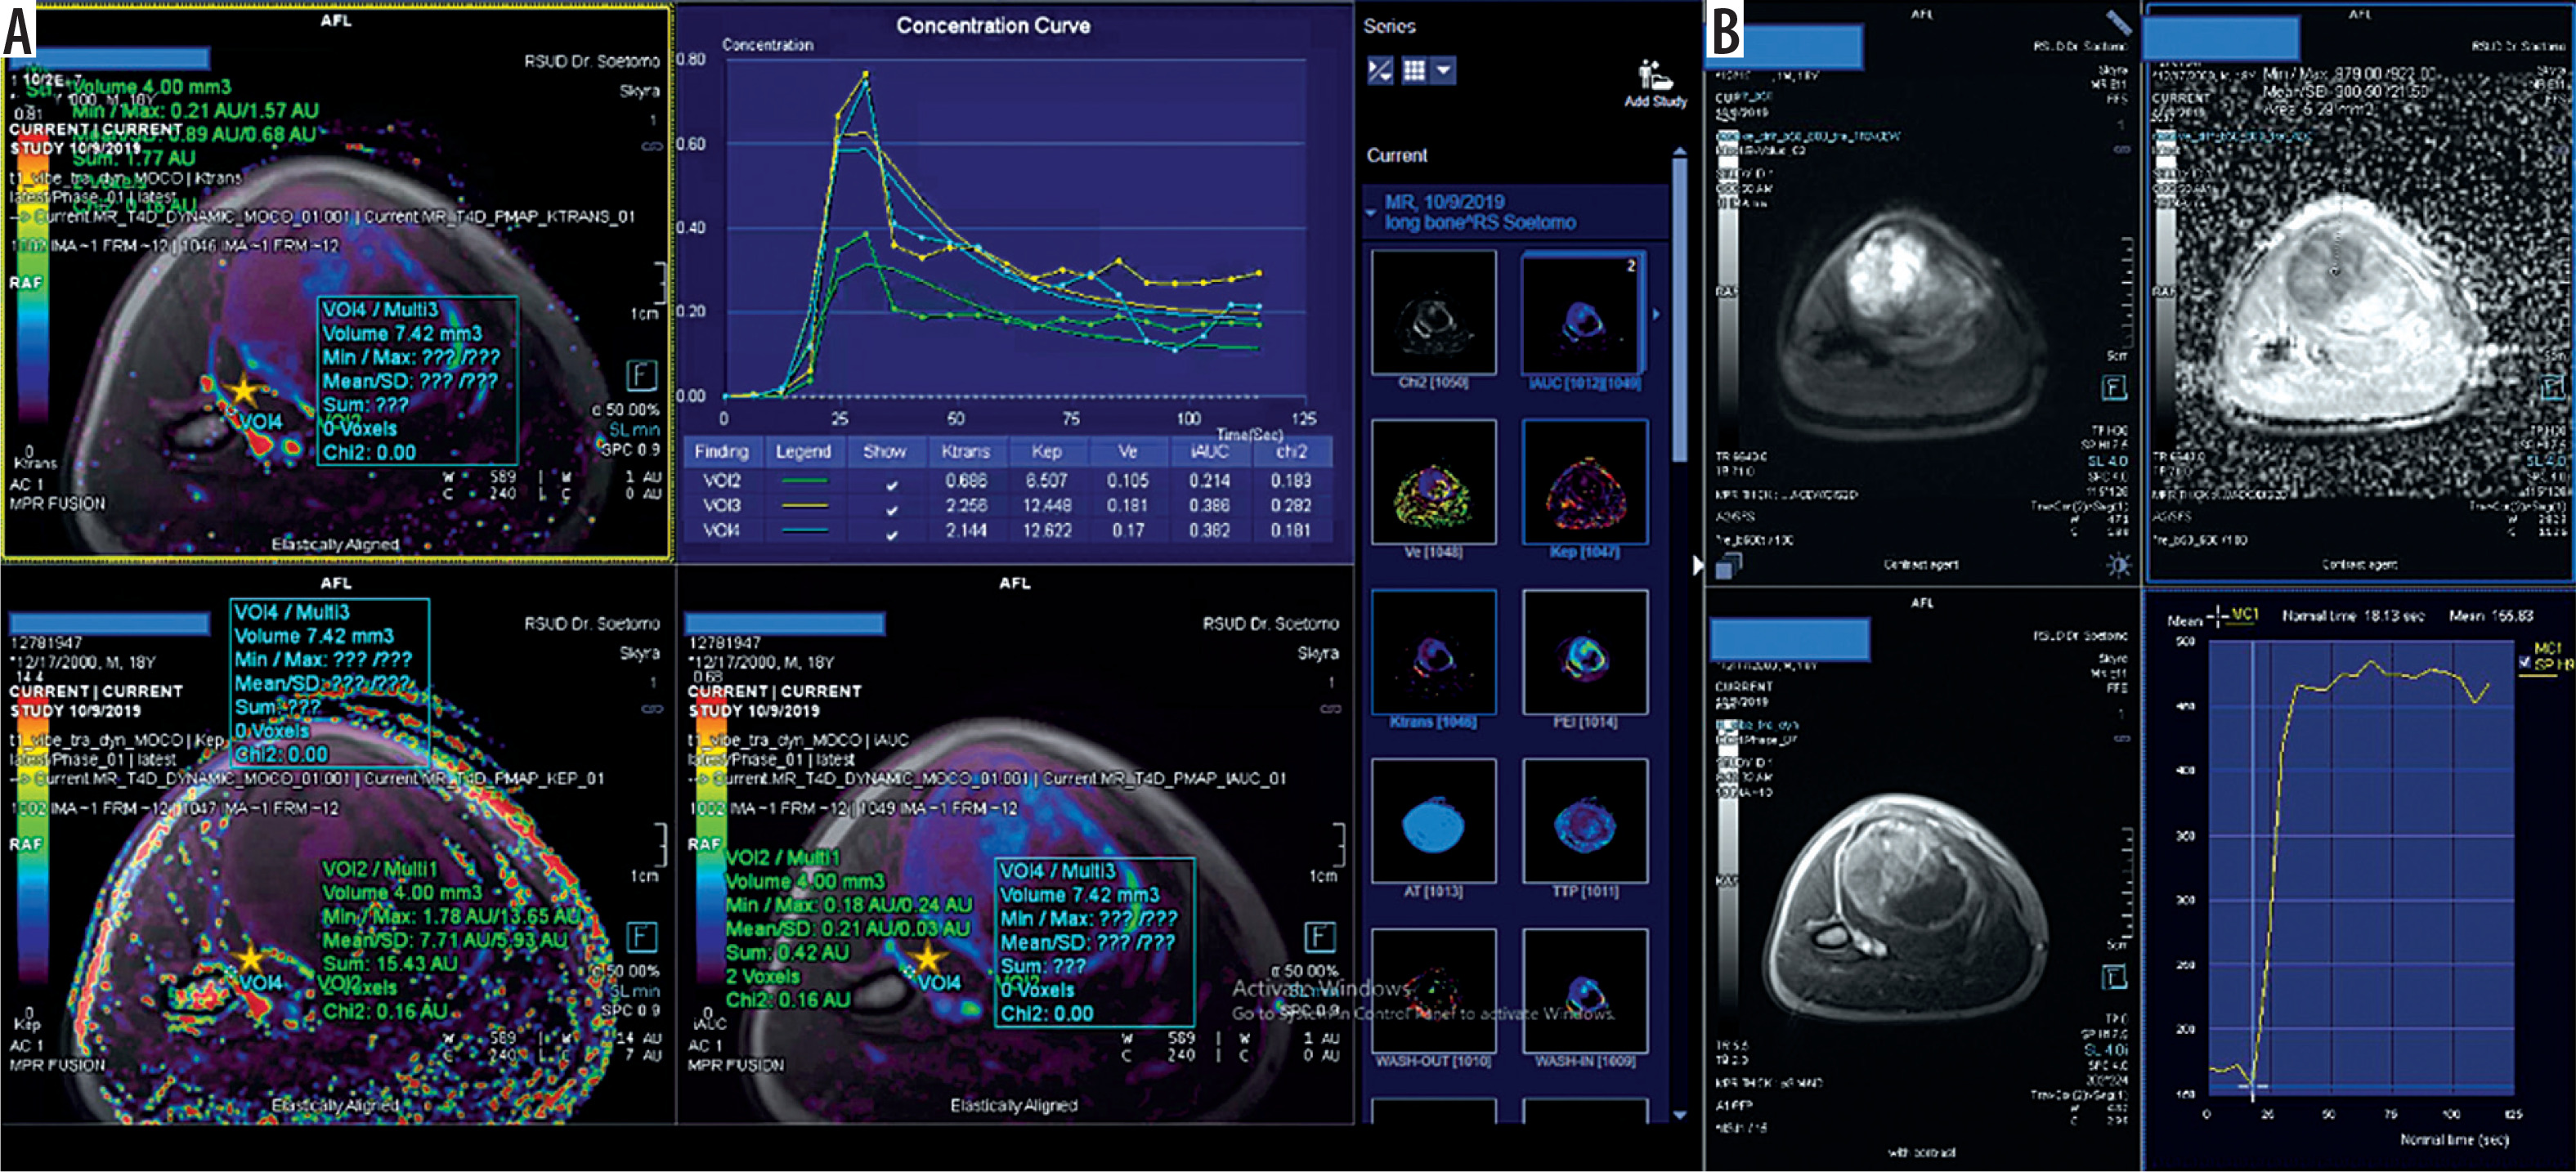
Figure 5
Multiparametric magnetic resonance imaging (MRI) in an 18-year-old male patient with histopathologically confirmed fibroblastic osteosarcoma was analyzed using the Tofts pharmacokinetic model. Quantitative dynamic contrast-enhanced MRI (DCE-MRI) maps (A) demonstrated relatively low-to-moderate Ktrans (≈0.27-1.35) and Kep (≈1.08-4.13), with moderate Ve (≈0.24-0.33), indicating reduced vascular permeability and slower contrast exchange compared to highly angiogenic tumor subtypes. The concentration–time curve shows rapid initial enhancement followed by a plateau and gradual washout, consistent with less aggressive perfusion kinetics. Diffusion-weighted imaging (B) revealed elevated apparent diffusion coefficient (ADC) values, reflecting increased extracellular diffusion associated with less compact cellular architecture and fibrous stromal composition. Regions of interest (ROIs) were placed within enhancing solid tumor components while avoiding necrotic or cystic areas (yellow star)
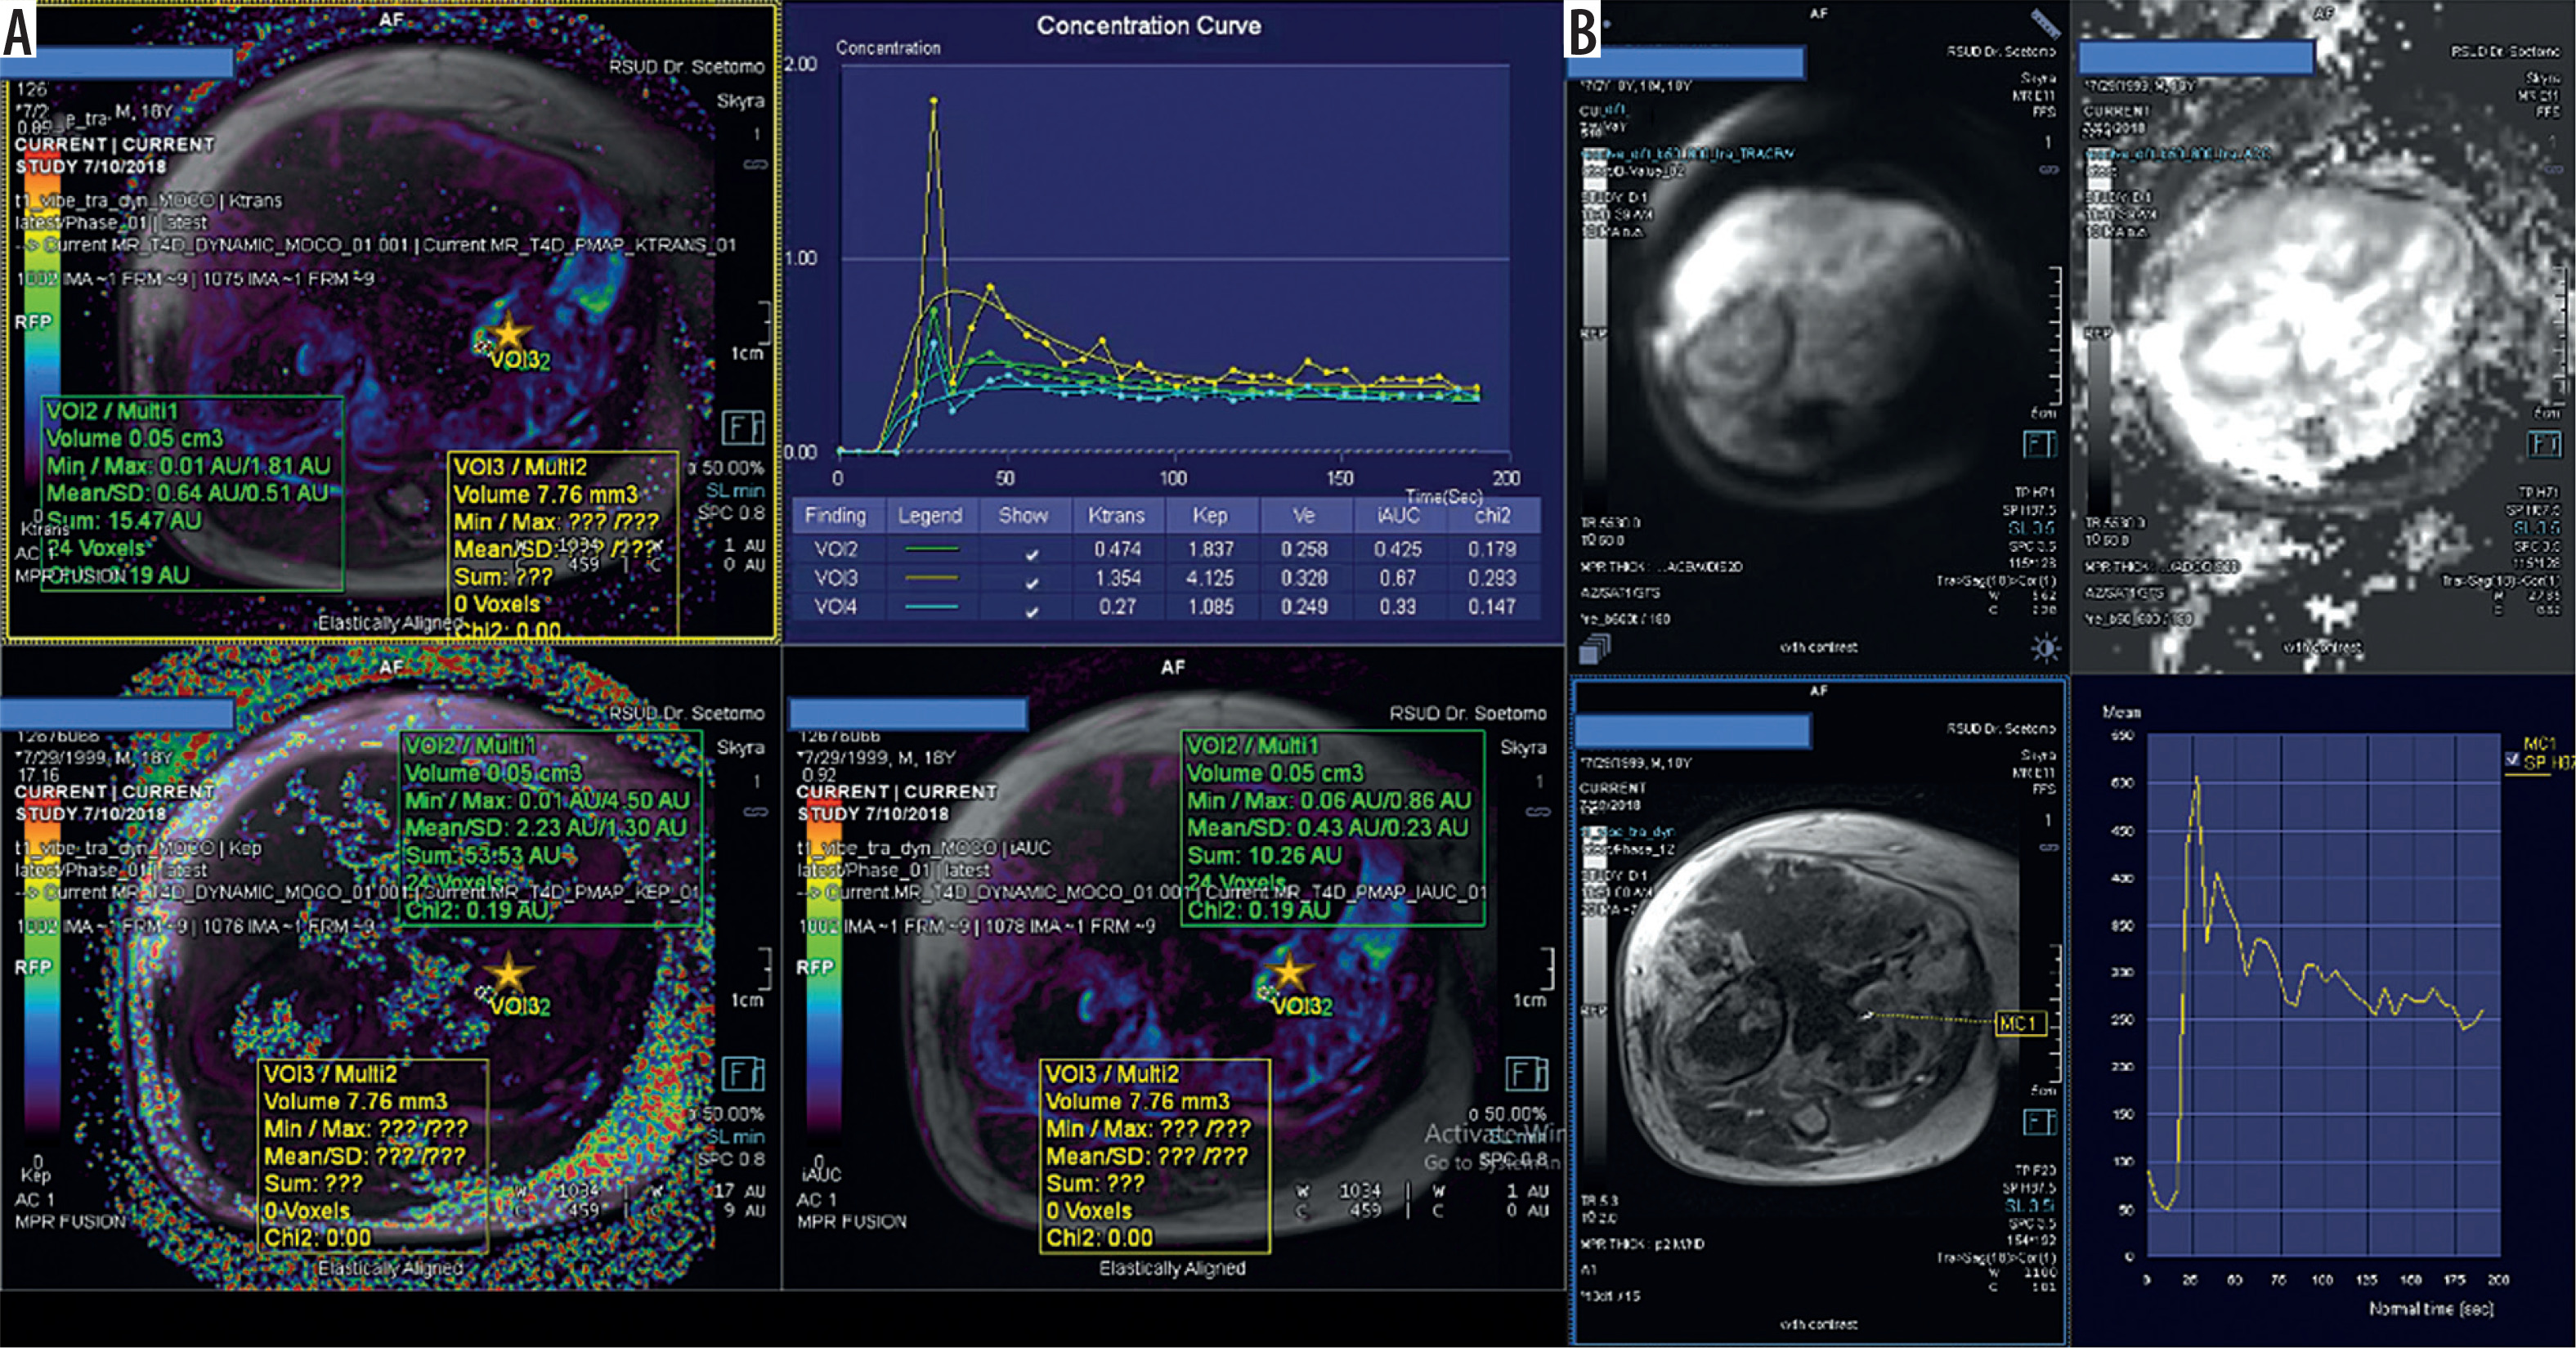
Figure 6
Multiparametric magnetic resonance imaging (MRI) in a 24-year-old female patient with histopathologically confirmed giant cell-rich osteosarcoma was analyzed using the Tofts pharmacokinetic model. (A) Quantitative dynamic contrast-enhanced MRI (DCE-MRI) demonstrated low-to-moderate Ktrans (≈0.3-1.1) and Kep (≈1.1-1.6), with moderate Ve (≈0.26-0.34), indicating relatively reduced vascular permeability and slower contrast exchange compared to highly angiogenic subtypes. The concentration–time curve shows gradual enhancement with a plateau pattern, consistent with less aggressive perfusion kinetics. Diffusion-weighted imaging (B) demonstrated heterogeneous but relatively elevated apparent diffusion coefficient (ADC) values, reflecting mixed cellular and stromal composition with areas of extracellular expansion. Regions of interest (ROIs) were placed within enhancing tumor components (yellow stars) while avoiding necrotic or cystic areas (yellow arrows)
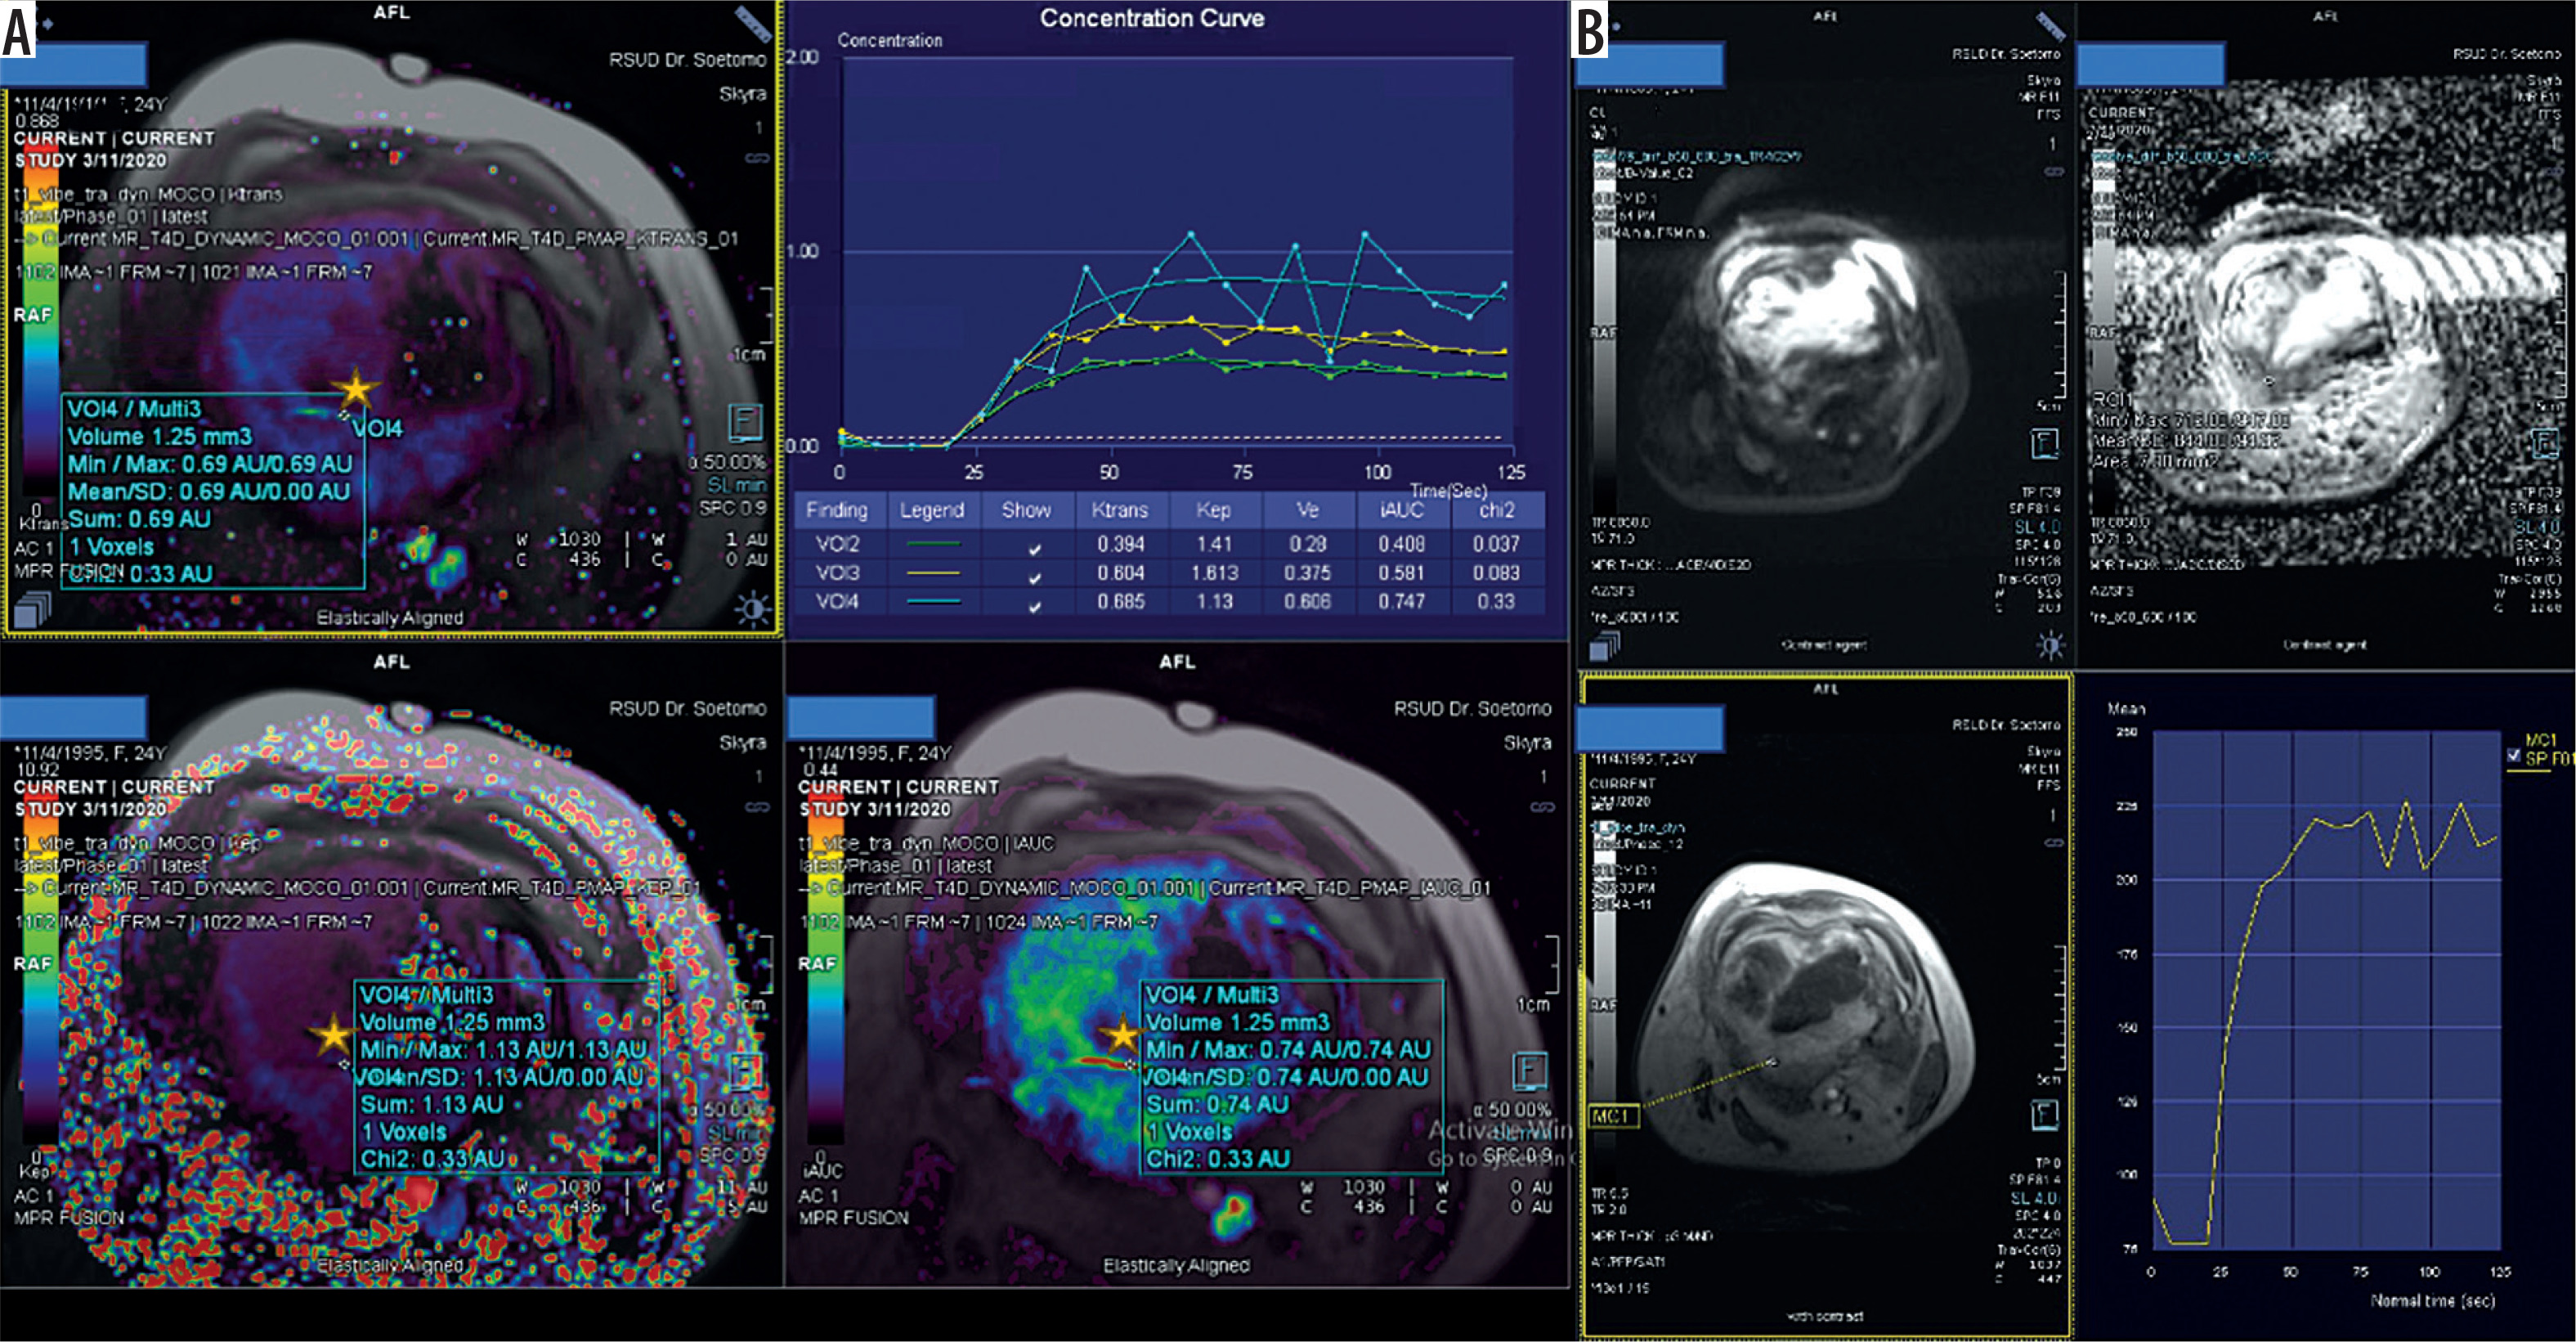
Figure 7
Multiparametric magnetic resonance imaging (MRI) in a 28-year-old female patient with histopathologically confirmed extraskeletal osteosarcoma was analyzed using the Tofts pharmacokinetic model. Quantitative dynamic contrast-enhanced MRI (DCE-MRI) (A) demonstrated markedly elevated Ktrans (≈3.9), with relatively low Kep (≈1.2) and low Ve (≈0.07), indicating high vascular permeability with limited extracellular volume and delayed contrast washout. The concentration–time curve shows rapid and intense enhancement followed by a persistent plateau pattern, consistent with sustained contrast retention. Diffusion-weighted imaging (B) demonstrates heterogeneous signal with relatively increased apparent diffusion coefficient (ADC) values, reflecting areas of extracellular expansion and variable tumor cellularity. Regions of interest (ROIs) were placed within enhancing tumor components (yellow stars) while avoiding necrotic or non-enhancing areas
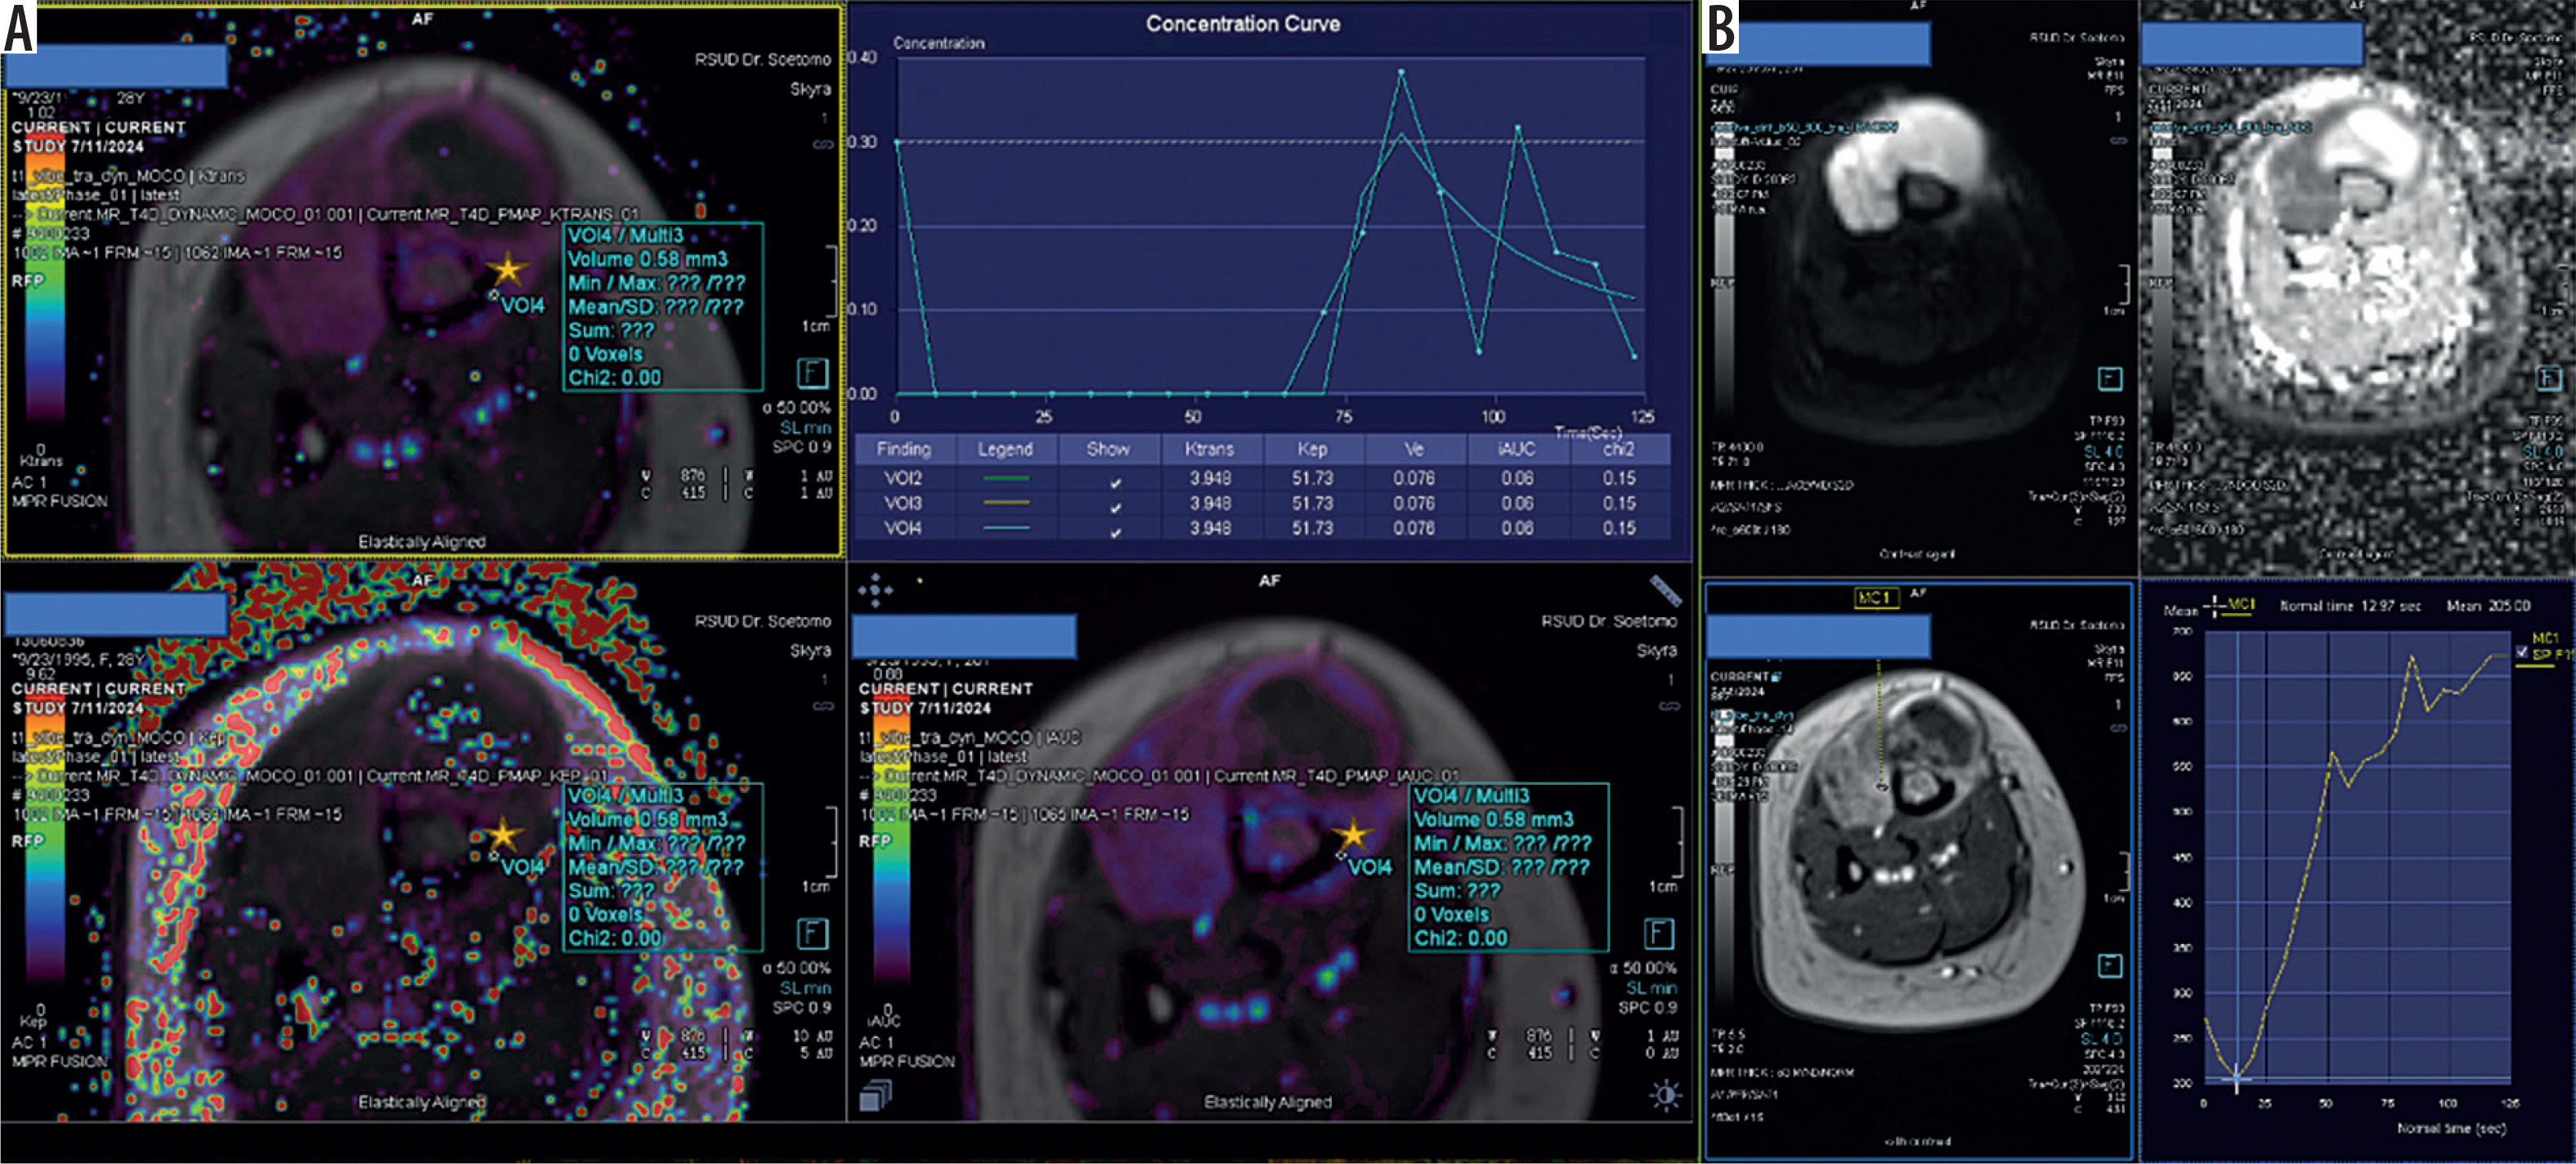
Figure 8
Multiparametric magnetic resonance imaging (MRI) in an 8-year-old boy with histopathologically confirmed telangiectatic osteosarcoma was analyzed using the Tofts pharmacokinetic model. Quantitative dynamic contrast-enhanced MRI (DCE-MRI) (A) demonstrated low Ktrans (≈0.21-0.28) and low Kep (≈0.05-0.10), with relatively high Ve (≈ 0.30–0.34), indicating reduced vascular permeability and slow contrast exchange within an expanded extracellular space. The concentration–time curve shows rapid initial enhancement followed by a persistent plateau without significant washout, consistent with contrast pooling within cystic or hemorrhagic components. Diffusion-weighted imaging (B) demonstrates markedly elevated apparent diffusion coefficient (ADC) values, reflecting increased extracellular diffusion due to fluid-filled and necrotic tumor regions. Regions of interest (ROIs) were placed within enhancing tumor components (yellow stars) while avoiding non-enhancing cystic areas
From a clinical perspective, these results support the role of multiparametric MRI as a non-invasive tool for evaluating osteosarcoma heterogeneity, as combined diffusion- and perfusion-based imaging has been shown to reflect tumor vascularity, cellularity, and microenvironmental complexity [34,35]. Ktrans appears to be the most informative parameter for subtype differentiation, consistent with its established association with angiogenesis and vascular permeability [21], while ADC provides complementary information regarding tumor cellularity and treatment response [14,36]. Together, these parameters may support diagnosis and treatment monitoring, particularly when biopsy sampling is limited or not representative of the entire tumor [37].
Limitations
Several limitations should be acknowledged. The retrospective single-center design limits generalizability, as imaging biomarker performance may vary across institutions and patient populations. In addition, small subgroup sizes reduce statistical power and contribute to model instability, particularly in multivariable analyses. Manual ROI placement may not fully capture whole-tumor heterogeneity, as focal sampling can underestimate spatial variability within osteosarcoma lesions. Furthermore, variability in acquisition protocols and pharmacokinetic modeling approaches may affect the reproducibility and comparability of quantitative DCE-MRI parameters across studies.
Future studies should focus on larger prospective multicenter cohorts with standardized imaging protocols, as current radiomics and machine learning studies in osteosarcoma remain limited by small sample sizes, methodological heterogeneity, and lack of external validation [38]. Integration of radiomics and machine learning approaches may further enhance the ability to characterize tumor heterogeneity, as these methods enable extraction of high-dimensional imaging features and have demonstrated promising diagnostic and predictive performance [39]. However, external validation remains necessary before clinical implementation, as current evidence is not yet fully generalizable across institutions [40]. These findings suggest that osteosarcoma subtypes exhibit distinct perfusion–diffusion signatures and multiparametric MRI may assist in non-invasive tumor characterization and guide biopsy targeting in heterogeneous osteosarcoma [41].
Conclusions
Multiparametric MRI combining DCE-MRI and DWI enables non-invasive characterization of osteosarcoma heterogeneity. Ktrans demonstrated the strongest discriminatory performance across subtypes, reflecting differences in tumor vascularity, while ADC provided complementary information on tumor cellularity. These findings support the clinical potential of quantitative MRI biomarkers, although further validation in larger prospective studies is required.