Introduction
Chronic liver disease (CLD) is a serious public health problem [1]. Hepatitis B virus (HBV), hepatitis C virus (HCV), alcohol-related liver disease (ALD), metabolic dysfunction-associated steatotic liver disease (MASLD), and autoimmune, metabolic, and vascular liver diseases are common causes of CLD. Cirrhosis is the pathological end-stage of any CLD, and in general it is considered to be irreversible in its advanced stages [2].
Portal hypertension (PHT) is defined as a portal vein pressure higher than 5 mmHg, with cirrhotic and non-cirrhotic aetiologies. Cirrhosis is the most common cause of PHT. Clinically significant portal hypertension (CSPH) is considered as a hepatic venous pressure gradient (HVPG) ≥ 10 mmHg and is associated with an increased risk of complications like gastrointestinal varices [3].
Oesophageal varices and related bleeding are the most common life-threatening complications of PHT [1]. Upper gastrointestinal endoscopic examination is the gold standard for the diagnosis of oesophageal varices. However, it is an invasive and costly tool [4]. There is an increasing clinical demand for non-invasive methods to predict oesophageal varices in patients with cirrhosis.
Several non-invasive biochemical-based biomarkers, including AST (aspartate aminotransferase) to Platelet Ratio Index (APRI), Fibrosis-4 (FIB-4) Index, and imaging methods, including transient elastography (TE) and magnetic resonance elastography (MRE), are widely used for assessing liver fibrosis in routine clinical practice [4-6]. Previous studies reported that MRE is a reasonably accurate assessment of hepatic fibrosis in patients with CLD compared to other non-invasive tests. In addition, MRE provides information about fibrosis over a large cross-sectional area of the liver compared to biopsy, and stiffness values determined by MRE correlate closely with the stage of liver fibrosis [7].
In recent years, shear wave elastography (SWE) has emerged as an increasingly important noninvasive technique for assessing liver stiffness. This ultrasound-based modality provides real-time quantitative measurements and has shown good diagnostic performance in predicting PHT and oesophageal varices, particularly in settings where MRE is not widely available. While MRE remains one of the most accurate imaging-based tools for liver fibrosis staging, SWE is gaining prominence due to its accessibility, lower cost, and point-of-care applicability [8, 9].
This study aimed to determine the efficacy of MRE in predicting the presence and the severity of oesophageal varices in patients with CLD.
Material and methods
Study population
The study protocol was approved by our hospital’s institutional Medical Ethics Committee (decision number 03-213-19, dated February 2019), and written informed consent was waived for this retrospective, cross-sectional study. Between January 2017 and January 2022, a total of 165 consecutive adult patients with CLD were examined with multiparametric liver MRI. The patients with aetiologies of primary biliary cholangitis, primary sclerosing cholangitis, and autoimmune hepatitis (n = 47), those with a total measurable liver parenchyma area of smaller than 50 cm2 on the MRE confidence map (n = 8), and patients who did not undergo upper gastrointestinal endoscopy (UGE) or who had more than 1 year between the date of MRE and the date of UGE (n = 53) were excluded. The flowchart of the patient enrolment is shown in Figure 1.

The diagnosis of CLD was based on clinical, biochemical, imaging, and histological findings, when available. ICD-10 codes were used to identify the patients. The hospital information system was used to analyse patients’ documents.
A total of 57 patients (32 men, and 25 women) with CLD were included in the analysis. The mean age of the patients was 60.8 years (range: 34-81 years). The aetiology of the CLD was viral hepatitis in 35 patients, MASLD in 9 patients, ALD in 6 patients, and cryptogenic in 7 patients.
Upper gastrointestinal tract endoscopy
An experienced gastroenterologist who was blinded to the MRE results performed the upper gastrointestinal tract endoscopies. The presence and grade of oesophageal varices were classified based on the international guidelines [10]. The high-risk varices were defined as follows: grade 3 oesophageal varices and grade 2 varices with red wale markings [11].
Out of 57 patients with CLD who were included in the analysis, 42 patients had oesophageal varices, whereas the remaining 15 patients did not have varices. Of the 42 patients with varices, 11 had low-risk varices (grade 1 varices and grade 2 varices without red wale markings) and 31 had high-risk varices (grade 2 varices with red wale markings or grade 3 varices).
MRE technique
All patients were examined using a 1.5-T MR scanner (Aera, Siemens Healthcare, Erlangen, Germany) after a 6-hour fast. Standard body and spine matrix coils were used for signal reception. A phase-contrast two-dimensional gradient-recalled echo (2D GRE MRE) sequence was utilised for MRE. Three transverse slices of 10 mm thickness through the largest cross-section of the liver were obtained during breath-holds at end-expiration. The technical parameters used for MRE were as follows: 400 × 300 matrix, FOV 48 × 128 mm, slice thickness 10 mm, TR 50 ms, TE 27.5 ms, flip angle 25 degrees, and averages of 1. A GRAPPA undersampling pattern with a reduction factor of 2 was utilised. Stiffness maps (elastograms), confidence maps, and wave images were constructed with postprocessing software.
Image analysis
Images were analysed on the Picture Archiving and Communication System (PACS). The stiffness of the liver parenchyma was measured from the MRE confidence map with the ‘free hand’ region of interest (ROI) method, and the stiffness value per unit area was calculated. Measurements were made at 3 different levels, avoiding large vessels and parenchymal lesions. Liver stiffness measurements (LSMs) based on MRE were performed in consensus by 2 radiologists with 2 and 5 years of experience in MR elastography, respectively. The LSM method is shown in Figures 2 and 3.
Figure 2
A 68-year-old patient with a diagnosis of chronic liver disease secondary to hepatitis C virus, without oesophageal varices at endoscopy. In measurements made from magnetic resonance elastography confidence maps (B, D, F), liver parenchymal stiffness per unit area was determined as 2.7 kPa

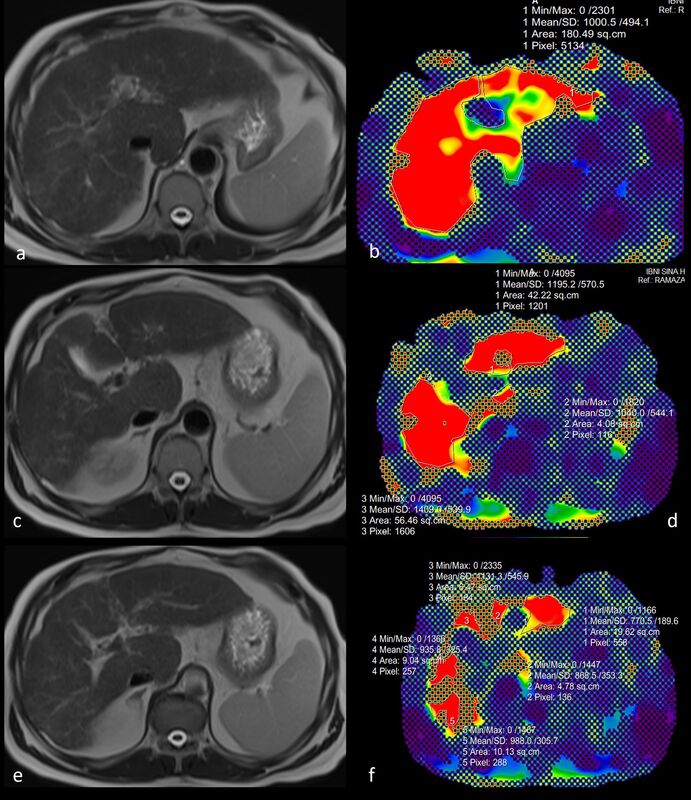
Figure 3
A 58-year-old male patient with grade 3 oesophageal varices at endoscopy and a diagnosis of cirrhosis secondary to non-alcoholic fatty liver disease. In measurements made from magnetic resonance elastography confidence maps (B, D, F), liver parenchymal stiffness per unit area was calculated as 10.7 kPa

Patients were categorized into 3 groups according to the LSM values:
Statistical analysis
Statistical analyses were performed using Statistical Package for Social Sciences Version 27 software (IBM Corp.). Mean ± standard deviation was used for normally distributed numerical variables, median (minimum-maximum) was used for numerical variables that did not show normal distribution, and frequency and percentage were used for categorical variables. For numerical variables with normal distribution, the difference between the 2 groups was determined by the independent samples t-test. For numerical variables that did not have a normal distribution, the difference between 2 groups was determined with the Mann-Whitney U test, and the difference between 3 or more groups was determined with the Kruskal-Wallis test. Receiver operator characteristic (ROC) analysis was used to determine the cut-off value for the presence of oesophageal varices. A p-value less than 0.05 was considered indicative of a statistically significant difference.
Results
The mean LSM for the whole study population (57 CLD patients) was 4.6 ± 1.7 kPa. The median LSM was 4.3 kPa (range: 2.2-10.7 kPa). The LSM was < 3 kPa in 10 patients (17.5%), 3-4 kPa in 14 patients (24.5%), and ≥ 4 kPa in 33 patients (58%).
Seventy-four per cent of our patients had CSPH, which was associated with oesophageal varices. The median value of liver parenchymal stiffness was 4.8 kPa in patients with oesophageal varices, whereas it was 3.2 kPa in patients without varices (p < 0.001). The median interval between the UGE and MRE was 6 months. The baseline characteristics of the patients are shown in Table 1.
Table 1
Characteristics of patients with chronic liver diseases (N = 57)
A statistically significant correlation was found between LSMs and the presence of oesophageal varices (p = 0.016). The distribution of oesophageal varices between the groups is shown in Figure 4. When the threshold value was set as 4 kPa, the sensitivity and specificity of MRE in predicting the presence of oesophageal varices were 69.0% and 73.3%, respectively. The area under the ROC curve (AUC) was calculated as 0.72, indicating a moderate diagnostic performance (Figure 5). Sensitivity of MRE was 81% for predicting high-risk varices.
Figure 4
Distribution of patients with and without oesophageal varices according to their liver stiffness measurements values

Figure 5
Receiver operating characteristic curve of magnetic resonance elastography-based liver stiffness measurements for predicting the presence of oesophageal varices. At a threshold of 4 kPa, the sensitivity and specificity were 69.0% and 73.3%, respectively. The area under the curve (AUC) was 0.72, indicating moderate diagnostic accuracy. The diagonal dashed line represents the line of no discrimination (AUC = 0.5)

All potential risk factors were evaluated using univariate logistic regression analysis. Variables with a p-value below 0.25 in the univariate analysis, including LSM by MRE, alanine aminotransferase (ALT), AST, bilirubin levels, and the FIB-4 score, were considered candidate variables for the multivariate analysis. Although the p-value of the platelet count variable was below 0.25 in the univariate analysis, it was excluded from the multivariate analysis due to a strong inverse correlation with the FIB-4 score. As a result of the multivariate logistic regression analysis, LSM by MRE (odds ratio [OR]: 2.65, confidence interval [CI]: 1.07-6.52, p = 0.035) and FIB-4 score (OR: 2.55, CI: 1.25-5.18, p = 0.01) were identified as risk factors influencing the presence of varices. Univariate and multivariate analyses of the influence of demographic characteristics, LSM values, and laboratory parameters associated with the presence of varices in patients with CLD are shown in Table 2.
Table 2
Univariate and multivariate analysis of the influence of demographic characteristics, stiffness values, and laboratory parameters associated with the presence of varices in patients with chronic liver disease
Multivariate analysis showed that a 1-kPa increase in LSM increased the risk of the presence of oesophageal varices by 2.7-fold, while a 1-unit increase in the FIB-4 score increased the risk of the presence of oesophageal varices 2.6-fold.
Discussion
The present study determined that LSMs obtained by MRE could assess CSPH. In the present study, 74% of the patients had oesophageal varices of varying grades. A significant correlation was found between LSMs and the presence of oesophageal varices. There was a statistically significant difference in terms of LSMs between CLD patients with/without oesophageal varices. When we set the threshold value as 4 kPa, MRE predicted the presence of varices with 69% sensitivity. This finding confirms a previous study demonstrating that when 4.6 kPa was taken as the threshold value for LSM, the presence of varices was predicted with 66% sensitivity [12]. Sun et al. [13] reported that when the threshold value for liver parenchymal stiffness was determined as 5.8 kPa, high-risk oesophageal varices were predicted with a sensitivity of 96%. The investigators reported significantly different LSMs by MRE in patients with low-risk and high-risk varices and suggested that the small total measurement area and the long interval between the endoscopy and MRE reduced the sensitivity of the MRE [13]. The cutoff value is variable and affected by the aetiology of CLD. In the present study, unfortunately, we do not have enough patients with high-risk oesophageal varices to draw firm conclusions. This study indicates that MRE accurately identifies CSPH.
With multivariable logistic regression, LSM by MRI and high FIB-4 score were predictors of oesophageal varices in patients in the present study. According to the results of multivariate analysis, it was determined that a 1-kPa increase in LSM increased the risk of the presence of oesophageal varices 2.7-fold, while a 1-unit increase in the FIB-4 score increased the risk of the presence of oesophageal varices 2.6-fold.
Our study has some limitations. This was a retrospective, single-centre study involving a relatively small number of patients, which may limit the generalisability of the findings to broader populations. Additionally, the interval between the UGE and MRE was relatively long compared to other studies in the literature, which could have introduced temporal variability in the disease status, potentially influencing the accuracy of the correlation between liver stiffness and endoscopic findings. These limitations may also contribute to selection and information bias, and should be taken into account when interpreting the results or applying them to clinical decision-making. Future prospective, multicentre studies with standardised timing between imaging and endoscopy would help validate and expand upon our findings. Unfortunately, we did not have data regarding HVPG measurement.