Introduction
Prostate cancer is the second most commonly diagnosed cancer in men worldwide after lung cancer, and it is the fifth leading cause of cancer-related death globally [1]. Efforts to increase the sensitivity and specificity of magnetic resonance imaging (MRI) in the diagnosis of prostate cancer have led to the development of the multiparametric MRI (mp-MRI) concept [2]. To standardise the interpretation of these parameters and increase sensitivity in prostate cancer diagnosis, similarly to mammography screenings, the Prostate Imaging Reporting and Data System (PI-RADS) was developed. This system has been updated, with the latest guideline being PI-RADS v2.1 [2,3].
The desire to increase sensitivity and specificity in radiological imaging, as well as to predict prognosis and subtype determination in advance, has driven researchers to seek new approaches. In this context, the idea of examining information present in the pixels and voxels that constitute image information not discernible by the human eye using computer-aided programs has emerged [4,5]. Today, analysis of the pixels and voxels that form images is becoming increasingly popular, with more studies focusing on this area each day. Various studies employing these analyses have yielded promising and significant results in distinguishing between benign and malignant conditions, staging diseases, predicting prognosis, and foreseeing responses to treatment across different diseases [6–9]. PI-RADS is a categorisation system that indicates the risk of lesions being malignant. It does not provide an estimation of the aggressiveness of lesions. Furthermore, a multicentre study reported that the positive predictive value of PI-RADS is low and varies between centres [10]. Our objectives in this study are to elucidate the contribution of ADC histogram analysis data to the diagnosis and determination of aggressiveness of peripheral zone prostate cancers.
Material and methods
Patient selection
Prior to data collection for the study, approval was obtained from the local Ethics Committee (2022-01/41). The study retrospectively investigated hospital records of patients who underwent mp-MRI examination and 12-quadrant prostate biopsy and cognitive biopsy at our centre between 1 January 2018, and 31 December 2021. Among the 81 patients identified, one patient was excluded because their images could not be accessed via PACS (Picture Archiving and Communication System), 3 patients were excluded because their ADC maps were not of diagnostically sufficient quality, and 11 patients were excluded because they were diagnosed with transitional zone (TZ) prostate cancer via transurethral resection of the prostate (TUR-P). Additionally, 5 patients with no significant focal pathological signal detected in the peripheral zone (PZ) of the prostate on mp-MRI were also excluded. A total of 61 patients, aged between 45 and 84 years, were included in the study.
Multiparametric MRI technique
The mp-MRI scans of the patients included in the study were performed using 1.5 Tesla (Signa Explorer, GE) (n = 22) and 3 Tesla (Magnetom Skyra, Siemens) (n = 39) MRI machines. To reduce potential artifacts, patients underwent bowel cleansing prior to the scan. The scanning protocol included axial and sagittal T2-weighted images, axial pre-contrast fat-suppressed T1-weighted images, diffusion sequences (b50-400-800-1000-1400), dynamic contrast-enhanced sequences following the administration of contrast material, and subtraction images derived from these sequences. For patients scanned before 2019, who did not have b1400 images taken, these images were later calculated and generated through extrapolation. Bittencourt et al. [11] indicated in their study that the quality of these extrapolated images is superior. The imaging parameters are shown in Table 1.
Table 1
Imaging parameters
Radiological evaluation and histopathological correlation
In our hospital, prostate biopsies were performed under transrectal ultrasonography (TRUS) guidance adhering to the 12-quadrant biopsy rules using an 18G automatic tru-cut biopsy needle. Additionally, using the cognitive biopsy technique, one extra core was taken from the area thought to correspond to the lesion described on MRI, and from areas that appeared suspicious on TRUS when necessary.
While evaluating mp-MRI scans, the lesion corresponding to the section on the sector map, where samples with given Gleason scores were localised according to pathology data, was selected as the target lesion. Patients without a specified Gleason score in their pathology data but with lesions in the PZ on their mp-MRI were included in the study, and these lesions were designated as the target lesions. The PI-RADS category of the lesions was determined separately by 2 evaluators. In cases of discrepancies in PI-RADS scores, the images were reviewed together to reach a consensus PI-RADS score.
Türkbey et al. [12] reported that MRI could accurately predict tumour volume as determined by histology, with higher accuracy for tumours with a volume greater than 0.5 cc. Considering this study, 7 patients with a pathology result of Gleason score 6 but with a tumour volume of less than 0.5 cc, as indicated by the analyses, were reclassified. According to the definition in PI-RADS v2.1, these were not clinically significant cancer (CSC); thus, they were excluded from the malignant group (n = 35) and included in the benign group (n = 26).
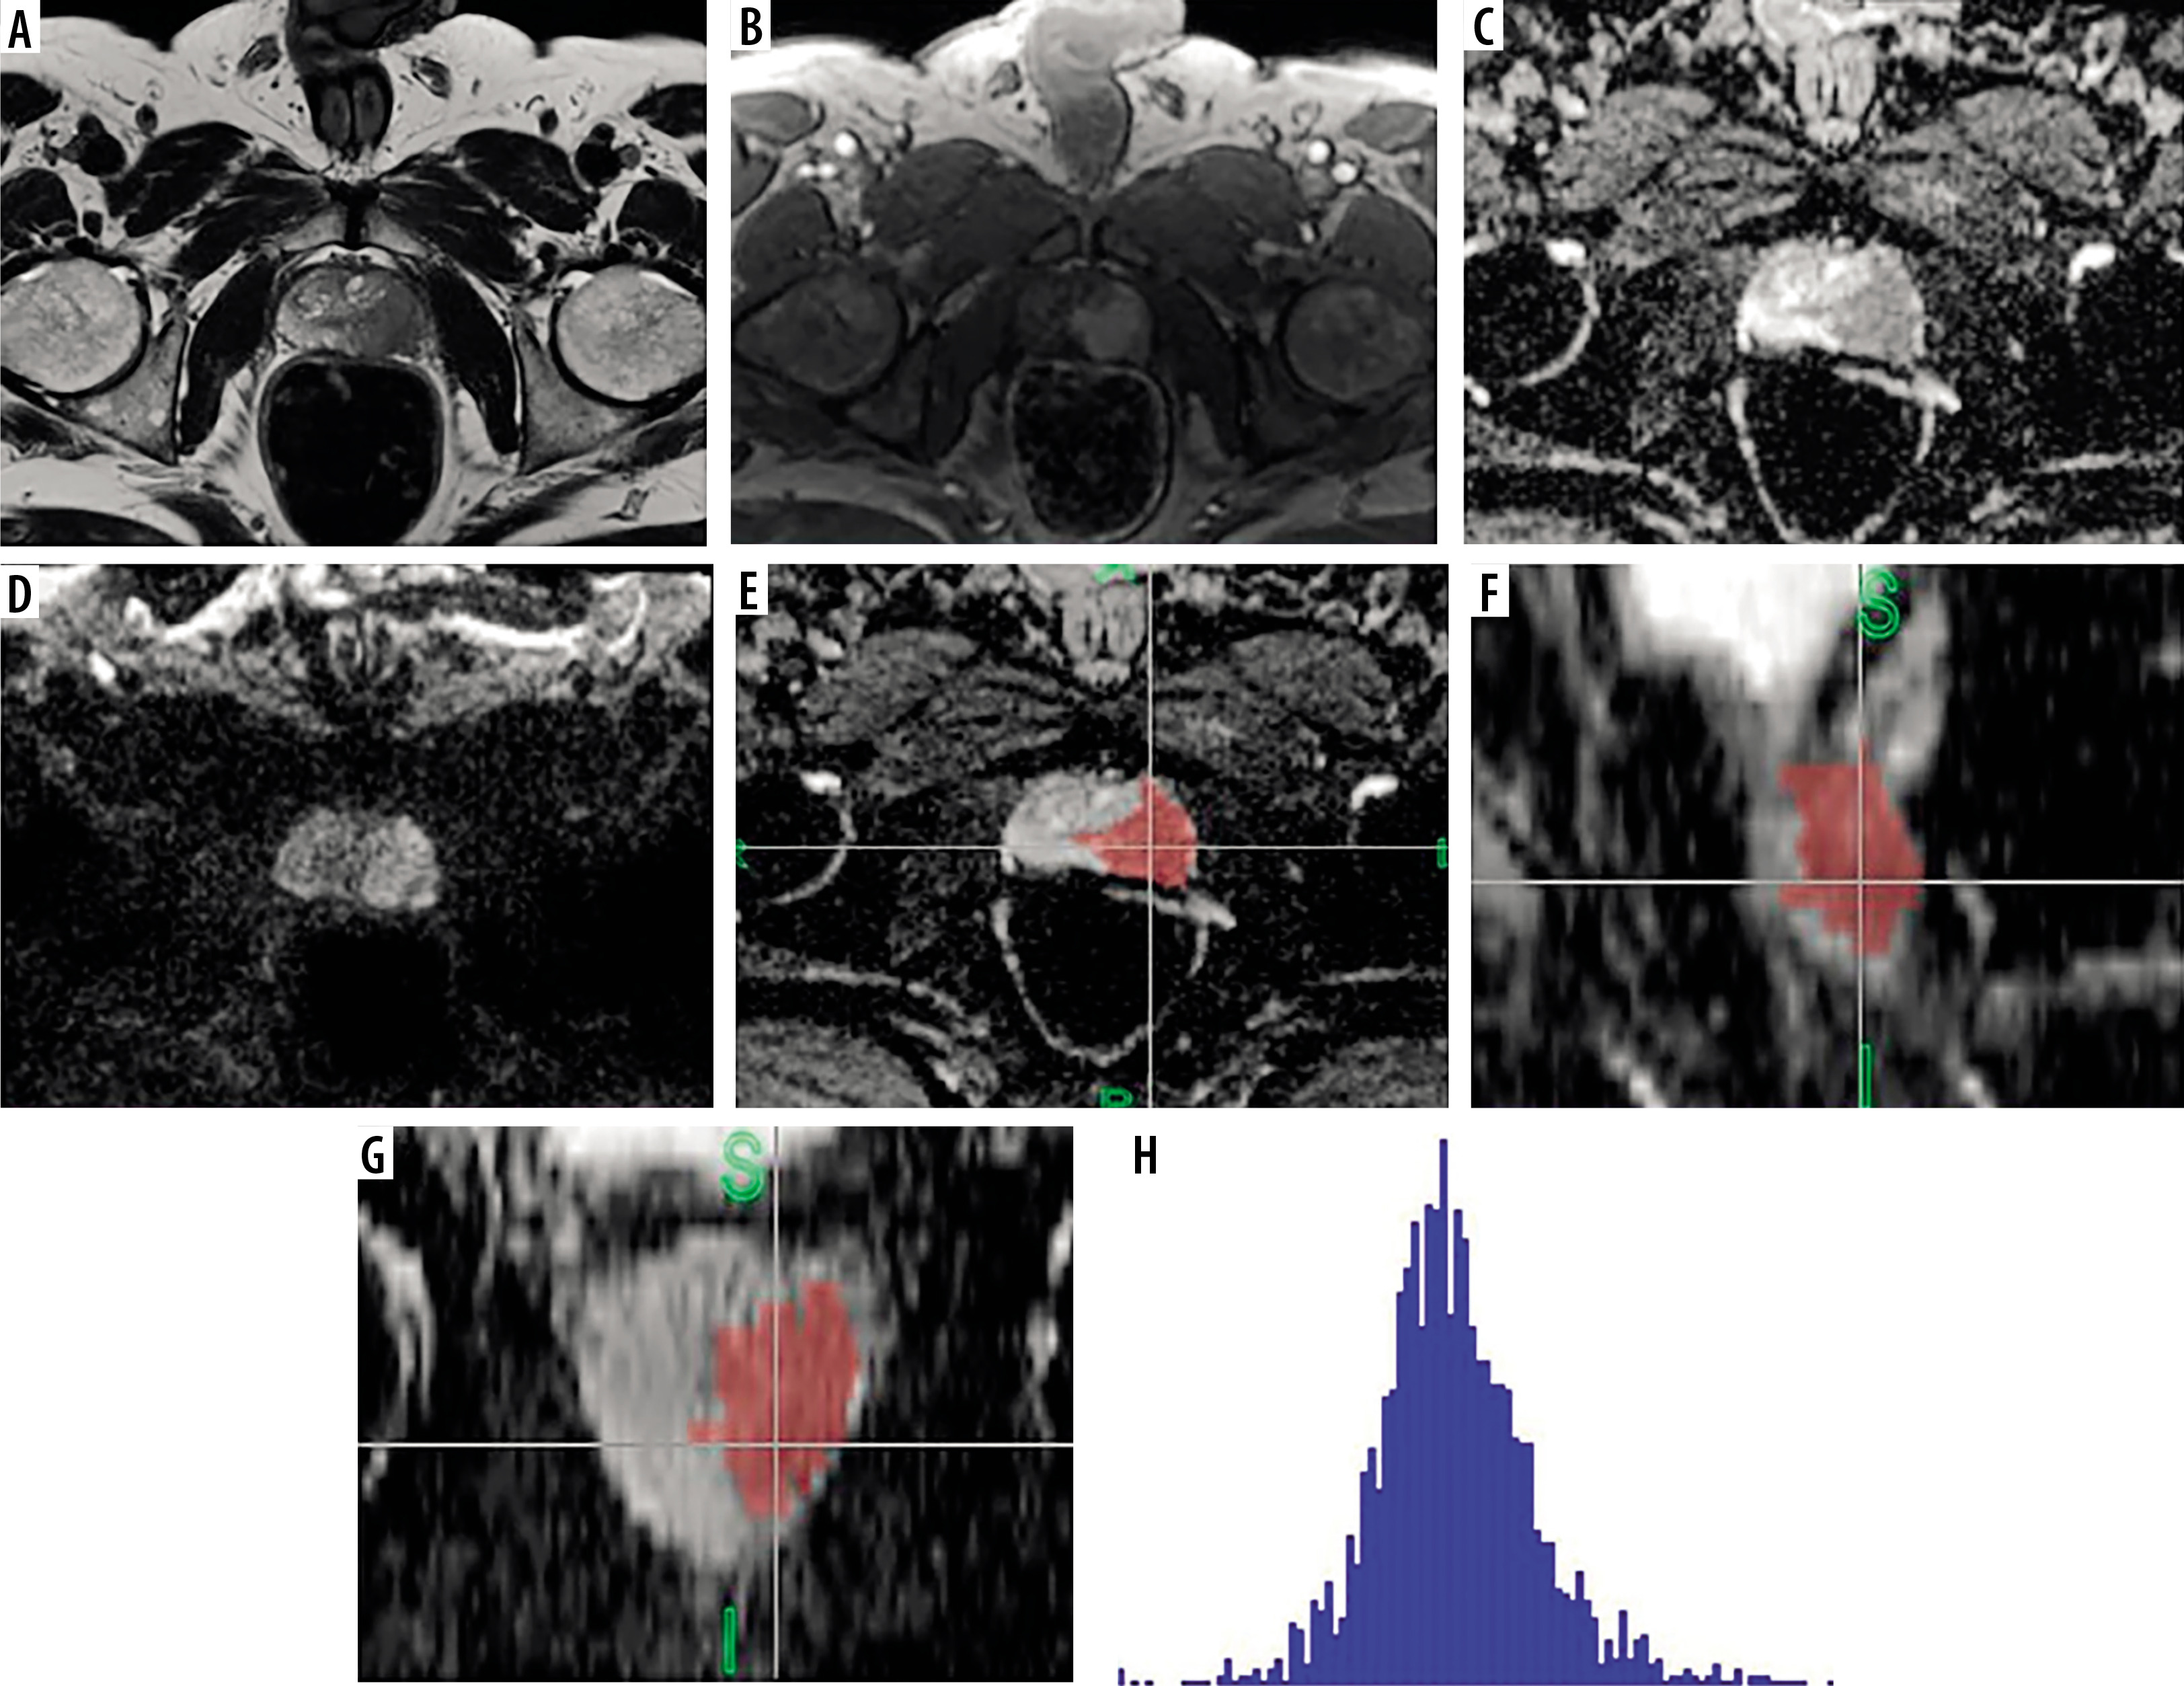
Images obtained from the PACS system were loaded into FireVoxel software (https://firevoxel.org), which is used for the analysis of radiological images. ADC images of the target lesions were marked with 3-dimensional regions of interest (3D ROI) across sequential slices to obtain data on the entire volume of interest (VOI) of the lesion. The marking was performed carefully to avoid potential errors and partial volume effects, ensuring that lesion contours were not exceeded. After the accuracy of the marking was verified by a second radiologist, histogram analysis data were obtained with the aid of the software (Figure 1).
Figure 1
In the peripheral zone of the left side of the prostate gland (A), T2-weighted images show a hypointense lesion. B) Contrast-enhanced series demonstrate significant early enhancement. C-D) ADC images reveal pronounced hypointensity, and diffusion-weighted imaging shows restricted diffusion, indicating a PI-RADS 5 lesion. The same case’s ADC map images (E) in the axial, (F) sagittal, and (G) coronal planes are segmented with 3D ROI, and (H) the histogram obtained after segmentation. The pathology result for this patient was reported as Gleason grade 4+4
Statistical analysis
Statistical analyses were performed using IBM SPSS Statistics 25 (IBM Corp., Armonk, New York). Descriptive statistical methods (mean, standard deviation, median, frequency, percentage, minimum, maximum) were used to evaluate the data. The normality of quantitative data was tested using the Kolmogorov-Smirnov and Shapiro-Wilk tests, as well as graphical assessments. Independent t-tests were used for comparisons between 2 groups of quantitative variables with normal distribution, while the Mann-Whitney U test was used for comparisons between 2 groups of quantitative variables without normal distribution. For comparisons among more than 2 groups of quantitative variables with normal distribution, one-way ANOVA and Bonferroni-corrected pairwise comparisons were employed. For comparisons among more than 2 groups of quantitative variables without normal distribution, the Kruskal-Wallis test and Dunn-Bonferroni test were used. ROC analysis was employed to determine the discriminative ability of parameters. In logistic regression analysis, the Backward model was used as the modelling method, and statistical significance was accepted at p < 0.05.
In the current study, the inter-observer agreement on PI-RADS scores was assessed using the significance of the k coefficient. It was found that the MR readers’ evaluations of PI-RADS categories were significantly and substantially consistent (κ = 0.77; p < 0.01) [13].
Results
The study was conducted with 61 male patients. The mean age of the patients was 67.06 years (range: 45-84). The average prostate specific antigen (PSA) value of the patients was 34.6 (range: 4.2-504.0). The pathology results and PI-RADS distributions of individuals included in the study are shown in Table 2 and Table 3.
Table 2
Distribution of patients according to Gleason scores
| Gleason scores | n | % |
|---|---|---|
| 3+3 | 11 | 18.03 |
| 3+4 | 7 | 11.47 |
| 4+3 | 2 | 3.27 |
| 3+5 | 5 | 8.19 |
| 4+4 | 4 | 6.55 |
| 4+5 | 4 | 6.55 |
| 5+4 | 1 | 1.63 |
| 5+5 | 1 | 1.63 |
| Benign | 26 | 42.62 |
| Total | 61 | 100.0 |
Table 3
Distribution of patients according to PI-RADS scores
| PI-RADS | n | % |
|---|---|---|
| PI-RADS 2 | 7 | 11.5 |
| PI-RADS 3 | 15 | 24.6 |
| PI-RADS 4 | 15 | 24.6 |
| PI-RADS 5 | 24 | 39.3 |
| Total | 61 | 100.0 |
When comparing ADC values for benign and malignant conditions, no significant differences were found in ADC min, ADC mean, or ADC percentile values. There were no significant differences in coefficient of variation and kurtosis values. However, ADC max, standard deviation, entropy, voxel count, and volume showed significant differences (p < 0.05; p < 0.05; p < 0.01; p < 0.01; p < 0.01). Malignant values were numerically higher than benign values in these measures (Table 4).
Table 4
Comparison of ADC values based on benign and malignant conditions
| Benign | Malign | p | ||
|---|---|---|---|---|
| ADCmax | Median (Min/Max) | 1284.0 (624.0/2317.0) | 1466.0 (927.0/34733.0) | 0.03a,* |
| Mean ± SD | 1315.9 ± 370.9 | 3366.6 ± 7542.5 | ||
| SD | Median (Min/Max) | 148.9 (74.5/247.2) | 186.8 (92.0/373.7) | 0.02b,* |
| Mean ± SD | 152.6 ± 48.6 | 187.1 ± 59.6 | ||
| Entropy | Median (Min/Max) | 3.7 (2.7/4.0) | 3.9 (3.3 /4.2) | 0.00b,** |
| Mean ± SD | 3.6 ± 0.3 | 3.9 ± 0.1 | ||
| Voxel count | Median (Min/Max) | 110.5 (19.0/507.00) | 390.0 (45.0/12550.0) | 0.00a,** |
| Mean ± SD | 138.0 ± 114.9 | 1100.0 ± 2293.6 | ||
| Volume | Median (Min/Max) | 0.8 (0.1/ 4.8) | 3.1 (0.3/86.1) | 0.00a,** |
| Mean ± SD | 1.0 ± 1.0 | 8.1 ± 15.8 | ||
In the logistic regression analysis (Backward model), it was found that a one-unit increase in volume increased the risk of malignant tumours by 1.75 times (p = 0.04; OR = 1.75; 95% CI: 1.00-3.04).
When comparing ADC values based on PI-RADS scores, no significant differences were found in ADC mean and ADC percentile values. However, significant differences were observed in ADC min and ADC max values based on PI-RADS scores (p = 0.01, p < 0.05; p = 0.03, p < 0.05). Pairwise comparisons revealed that the significant difference in ADC min was between PI-RADS 5 and PI-RADS 3 (p = 0.02; p < 0.05). For ADC max, the significant difference was between PI-RADS 4 and PI-RADS 5 (p = 0.04; p < 0.05) (Table 5).
Table 5
Comparison of ADC values based on PI-RADS categories
| PI-RADS 2 | PI-RADS 3 | PI-RADS 4 | PI-RADS 5 | p | ||
|---|---|---|---|---|---|---|
| ADCmin | Median (min/max) | 433.0 (0.0/33532.0) | 548.0 (268.0/935.0) | 477.0 (0.0/992.0) | 287.0 (3.3/33349.0) | 0.01a,* |
| Mean ± SD | 5122.1 ± 12533.1 | 570.0 ± 211.1 | 502.0 ± 249.8 | 1645.6 ± 6758.3 | ||
| ADCmax | Median (min/max) | 1522.0 (923.0/34108.0) | 1300.0 (638.0/2317.0) | 1195.0 (624.0/2290.0) | 1511.5 (927.0/34733.0) | 0.03a,* |
| Mean ± SD | 6076.0 ± 12363.5 | 1404.7 ± 436.2 | 1277.4 ± 367.6 | 3057.6 ± 6768.0 | ||
| SD | Median (min/max) | 148.4 (82.2/247.2) | 159.0 (89.1/230.1) | 140.6 (74.5/211.4) | 201.4 (113.7/373.7) | 0.00b,** |
| Mean ± SD | 148.9 ± 52.4 | 161.9 ± 46.4 | 148.5 ± 39.0 | 203.6 ± 62.6 | ||
| Variance | Median (min/max) | 21823.6 (6580.4/60559.2) | 25101.4 (7521.9/52809.5) | 19708.0 (5454.1/44246.5) | 40432.9 (12917.1/139707.0) | 0.01a,* |
| Mean ± SD | 24308.5 ± 17634.3 | 27844.2 ± 14824.9 | 23316.0 ± 11480.9 | 45141.3 ± 29547.8 | ||
| Coeff. of variance | Median (min/max) | 0.1 (0.0/0.2) | 0.1 (0.1/0.2) | 0.1 (0.0/0.2) | 0.2 (0.0/0.3) | 0.00b,** |
| Mean ± SD | 0.1 ± 0.0 | 0.1 ± 0.0 | 0.1 ± 0.0 | 0.2 ± 0.0 | ||
| Kurtosis | Median (min/max) | 0.8 (–0.8/4.5) | 0.3 (–0.8/2.1) | –0.1 (–0.7/4.0) | 0.5 (–0.3/4.6) | 0.04a |
| Mean ± SD | 1.8 ± 2.4 | 0.4 ± 1.0 | 0.2 ± 1.1 | 1.1 ± 1.2 | ||
| Entropy | Median (min/max) | 3.5 (3.3/4.0) | 3.9 (2.7/4.0) | 3.9 (3.5/4.1) | 3.9 (3.3/4.2) | 0.04a |
| Mean ± SD | 3.6 ± 0.2 | 3.7 ± 0.4 | 3.9 ± 0.1 | 3.9 ± 0.1 | ||
| Voxel count | Median (min/max) | 108.0 (36.0/507.0) | 114.0 (19.0/338.0) | 169.2 (52.0/709.0) | 478.0 (45.0/12550.0) | 0.00a,** |
| Mean ± SD | 156.7 ± 161.2 | 139.5 ± 90.5 | 190.4 ± 27314.5 | 1582.7 ± 2743.9 | ||
| Volume | Median (min/max) | 0.7 (0.2/4.8) | 0.8 (0.1/2.3) | 1.2 (0.3/9.3) | 4.0 (0.3/86.1) | 0.00a,** |
| Mean ± SD | 1.2 ± 1.6 | 1.0 ± 0.6 | 2.0 ± 2.3 | 11.4 ± 19.0 | ||
Significant differences were found between PI-RADS scores and standard deviation (p < 0.01), variance (p < 0.01), coefficient of variation (p < 0.01), kurtosis (p < 0.05), entropy (p < 0.05), voxel count (p < 0.01), and volume (p < 0.01). Pairwise comparisons revealed that the significant differences were as follows: standard deviation was different between PI-RADS 4 and PI-RADS 5 (p = 0.02; p < 0.05); variance was different between PI-RADS 4 and PI-RADS 5 (p = 0.02; p < 0.05); coefficient of variation was different between PI-RADS 2 and PI-RADS 5 (p = 0.01; p < 0.05); entropy was different between PI-RADS 2 and PI-RADS 4 (p = 0.04; p < 0.05); and voxel count was different between PI-RADS 2 and PI-RADS 5 (p < 0.01), PI-RADS 3 and PI-RADS 5 (p < 0.01), and PI-RADS 4 and PI-RADS 5 (p < 0.01). No specific group was identified for the significant difference in Kurtosis value when comparing between groups (Table 5).
According to the ROC curve analysis, the ADC histogram parameters entropy (AUC = 0.75; 95% CI: 0.63-0.87), voxel count (AUC = 0.83; 95% CI: 0.73-0.93), and volume (AUC = 0.83; 95% CI: 0.73-0.93) were statistically significant in differentiating between benign and malignant prostate tumours (p < 0.05) (Figure 2, Table 6).
Table 6
ROC analysis of ADC values in differentiating benign and malignant prostate tumours
| ADC values | AUC | Sth. error | Asymptotic sig. | Asymptotic 95% CI | |
|---|---|---|---|---|---|
| Lower bound | Upper bound | ||||
| Entropy | 0.758 | 0.061 | 0.001 | 0.638 | 0.87 |
| Voxel count | 0.837 | 0.051 | 0.000 | 0.738 | 0.93 |
| Volume | 0.832 | 0.052 | 0.000 | 0.731 | 0.93 |
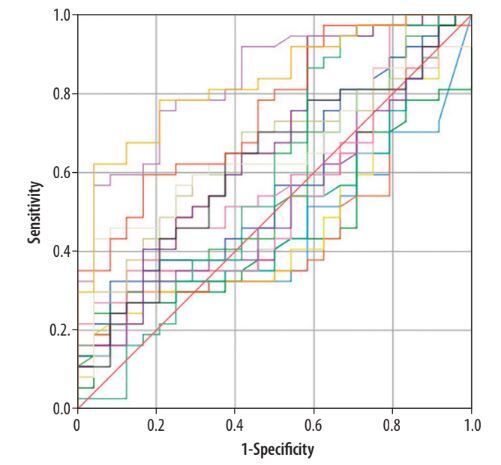
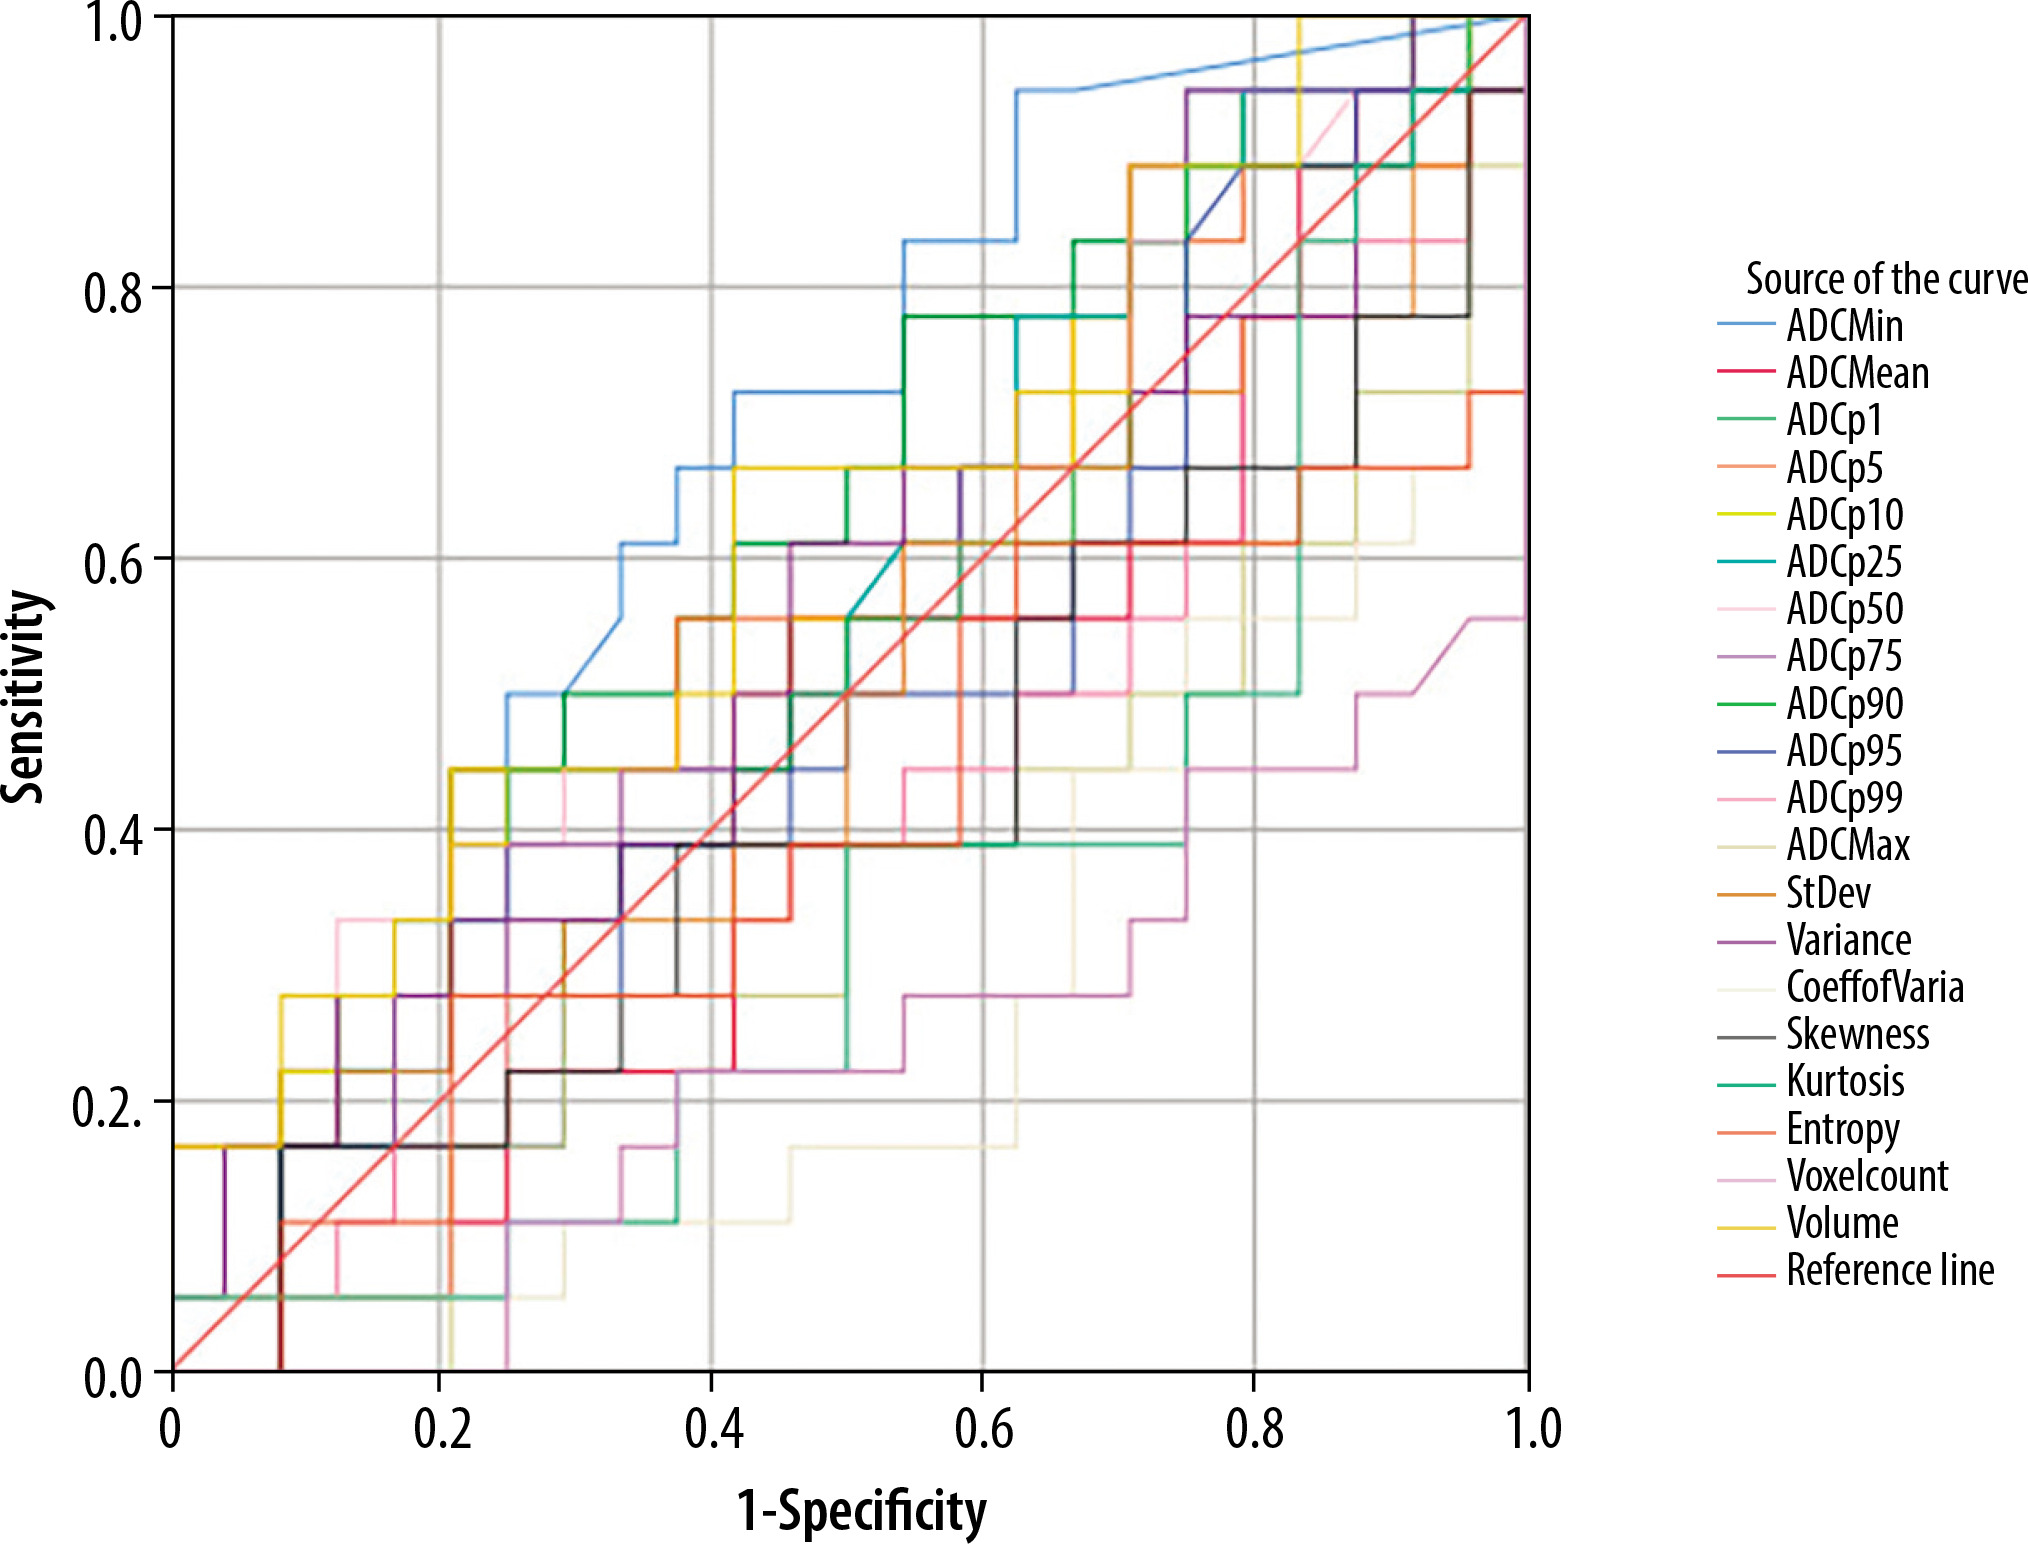
When patients classified as benign (those with benign pathology results and the 7 patients not classified as clinically significant) were excluded from the study (n = 26), and the remaining patients (n = 35) were grouped based on Gleason final scores of 6 and Gleason final scores ≥ 7. ROC curve analysis revealed that the voxel count (AUC = 0.23; 95% CI: 0.08-0.38) was statistically significant in prostate cancer grading (p < 0.01) (Figure 3).
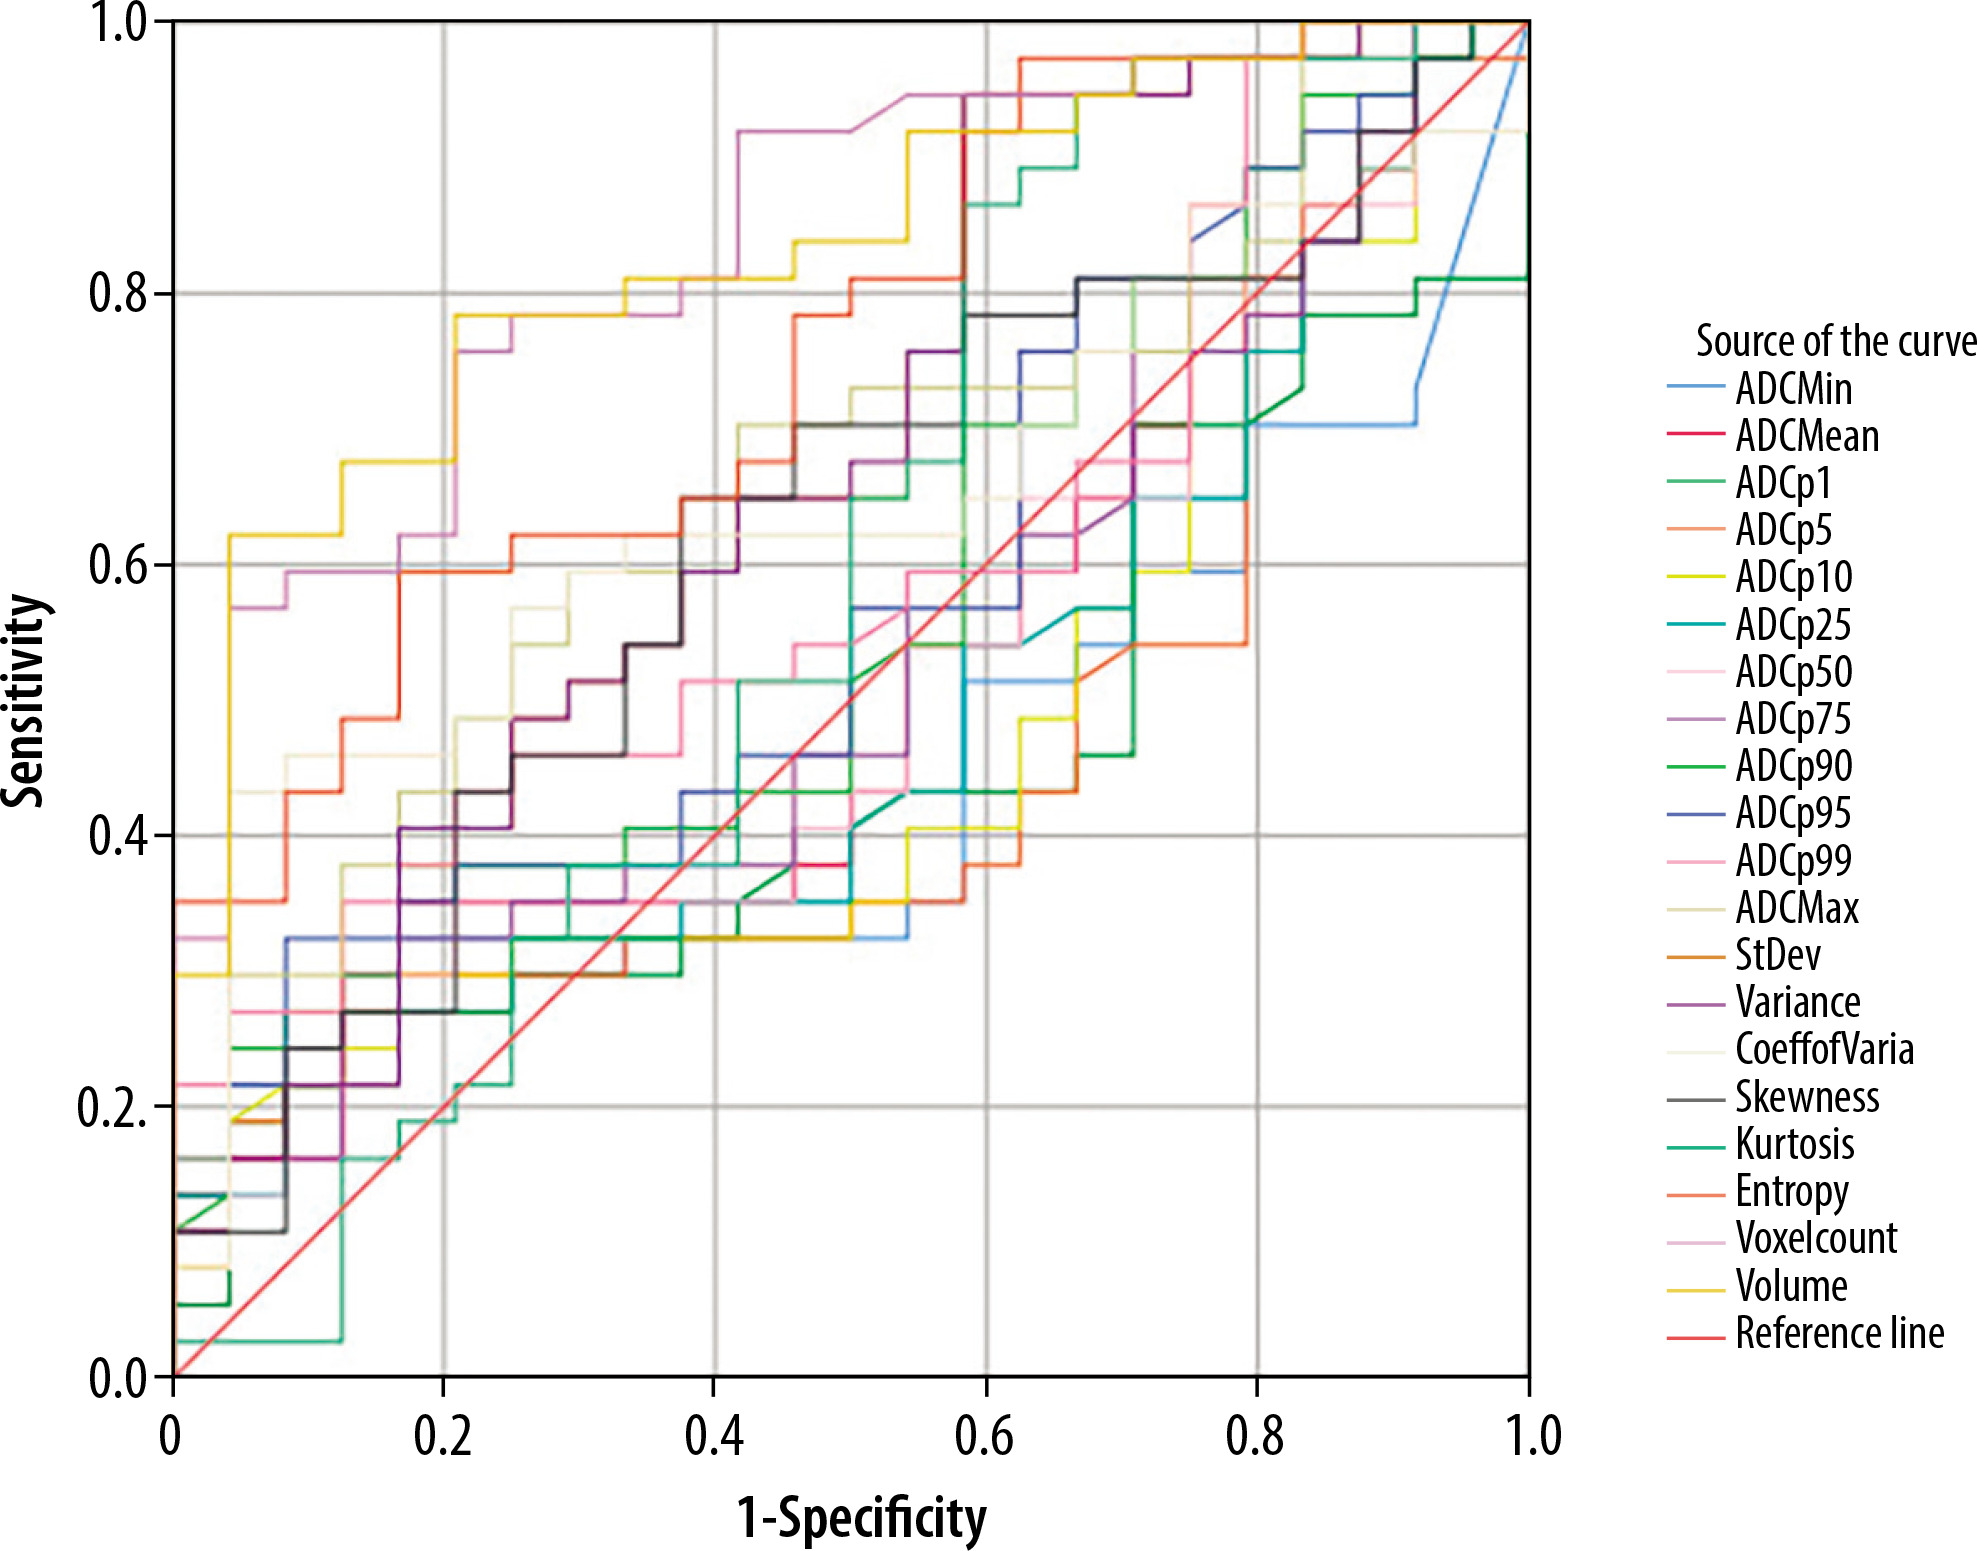
Figure 3
ROC curve for malignant patients grouped by Gleason final score of 6 and Gleason final score ≥ 7
In the malignant patient group (n = 35), ADC values were compared according to Gleason final scores (6, 7, ≥ 8). No significant differences were found among ADC mean, ADC max, and ADC percentile values (p >0.05). A significant difference was observed in ADC min values (p = 0.03; p < 0.05), with the difference being between the Gleason 6 and Gleason ≥ 8 groups (p = 0.03; p < 0.05) (Table 7). No statistically significant differences were found in standard deviation, variance, skewness, kurtosis, entropy, and volume measurements according to Gleason final scores (6, 7, ≥ 8) (p > 0.05).
Table 7
Comparison of ADC values according to Gleason final scores in malignant patients
| GLEASON 6 | GLEASON 7 | GLEASON ≥ 8 | p | ||
|---|---|---|---|---|---|
| ADC min | Median (Min/Max) | 477.0 (0.0/992.) | 410.0 (0.0/33349.0) | 0.0 (0.0/3352.0) | a0.03* |
| Mean ± SD | 525.7 ± 284.5 | 3171.0 ± 9506.3 | 2933.1 | ||
| Coeff of variance | Median (Min/Max) | 1.8 (1.1/7.6) | 1.9 (1.5/7.0) | 2.6 (1.5/3.9) | a0.00** |
| Mean ± SD | 2.1 ± 1.4 | 2.5 ± 1.5 | 2.7 ± 0.5 | ||
| Voxel count | Median (Min/Max) | 122.0 (29.0/1339.0) | 404.0 (114.0/3878.0) | 643.0 (117.0/12550.0) | a0.00** |
| Mean ± SD | 313.6 ± 413.3 | 759.7 ± 113.7 | 2183.0 ± 3714.5 | ||
Significant differences were observed in the coefficient of variation and voxel count according to the Gleason final scores of malignant patients (p < 0.05). Further analysis revealed that these differences were primarily between the Gleason score 6 and ≥ 8 groups (p < 0.01) (Table 7).
Discussion
In this study, we aimed to evaluate the diagnostic value of ADC histogram parameters in distinguishing between benign and malignant PZ lesions and in determining their aggressiveness based on Gleason scores. Our findings indicate that certain ADC histogram parameters, particularly entropy, voxel count, and volume, show significant potential for differentiating between benign and malignant lesions. Furthermore, some parameters were found to be associated with Gleason scores in malignant lesions, indicating their potential role in predicting lesion aggressiveness non-invasively.
Currently, although attempts have been made to establish objective criteria, radiological diagnostic methodsprimarily involve a system based on subjective information, where the radiologist reports findings based on their knowledge and experience. With advancements in artificial intelligence, methods such as histogram and texture analysis have gained popularity. These analytical techniques have been applied to various imaging modalities and used in numerous studies for purposes such as differential diagnosis, pathological grading, and prognosis determination. As identified in the present study, these methods have yielded clinically promising results [6–9].
In the evaluation of lesions, various studies have discussed measurements performed on a small area from a single slice, in a 2D manner including only the solid component from the widest slice, or using a 3D ROI covering the entire lesion across all slices [14–17]. It has been reported that analyses conducted with a 3D ROI encompassing the entire lesion better reflect the lesion’s characteristics and heterogeneity [16,18]. However, in a study where mean ADC values were measured both in 2D and 3D for prostate cancer, it was noted that while the 3D measurement did not enhance diagnostic performance, the reproducibility of 2D measurements among different users was insufficient [17]. In the present study, considering that a whole lesion analysis would more accurately reflect the lesion’s characteristics, 3D ROI measurements were utilised.
In the literature, there are studies conducted by Donati et al. [8], Lin et al. [19], and Oto et al. [20], using a 1.5 Tesla MRI with an endorectal coil.
Donati et al. [8], in their study that included both PZ and TZ cancers, reported that the median values of 4 ADC parameters (mean ADC, median ADC, ADC %10, and ADC %25) obtained from histogram analysis showed significant differences between tumours with Gleason score 6 and those with Gleason score 7, as well as between tumours with Gleason score 6 and Gleason score ≥ 8. The ADC %10 value was reported to have the strongest correlation with Gleason score. They also noted that ADC %10 provided the highest area under the curve (AUC) for distinguishing tumour foci with Gleason score 6 from those with Gleason score ≥ 7, while the median ADC showed the lowest AUC. In contrast to their findings, the present study did not find a significant correlation between ADC percentile values, median, and mean values with Gleason scores. However, the study revealed that the voxel count was statistically significant in differentiating between tumours with Gleason score 6 and Gleason score ≥ 7. Additionally, when malignant patients were classified based on Gleason scores of 6, 7, and ≥ 8, significant differences were observed in the coefficient of variance and voxel count values. The significance of voxel count was thought to be due to the larger size of lesions with higher Gleason scores, reflecting their aggressive nature at the time of diagnosis. Moreover, the analysis showed that a one-unit increase in volume value raised the risk of malignancy by 1.75 times.
Donati et al. [14] reported that histogram skewness could not be directly associated with Gleason score. Similarly, in the present study, no significant correlation was found between Gleason score and skewness value. In the same study, the authors noted that a limitation of their research was the selection bias introduced by including only patients who had undergone prostatectomy, which may limit the applicability of their findings to a broader patient population [8]. Due to the design of their study, patients with advanced disease who were not candidates for prostatectomy were excluded. To avoid such selection bias in the current study, we included patients who had undergone 12-core biopsies. The differing outcomes observed may be partly attributed to this patient selection criterion.
In their study, Lin et al. [19] compared the diagnostic performance of ADC histogram parameters and their combinations obtained from a single-slice 2D ROI with PIRADS v2 scores in diagnosing PZ prostate cancer. They found that PIRADS v2 scores provided good results for the diagnosis of prostate cancer. However, similar to the results of the present study, ADC percentiles, mean ADC, and median ADC values did not contribute diagnostically.
In their study, Oto et al. [20] found a significant negative correlation between mean ADC values and Gleason scores. However, their study also included lesions outside the peripheral zone and collected data using a single-slice 2D ROI.
In the literature, there are studies by Vargas et al. [21], Türkbey et al. [22], and Peng et al. [23], using a 3 Tesla MRI with an endorectal coil. Vargas et al. [21] reported that low mean ADC values were associated with high Gleason scores. Similarly, Türkbey et al. [22] found a significant negative correlation between mean ADC values and Gleason scores. Peng et al. [23] reported that mean ADC and ADC %10 values correlated with Gleason scores and were useful for differentiating prostate cancer from normal tissue. However, these studies used ADC values obtained from single-slice measurements.
Bao et al. [24] conducted a study on TZ using a 3 Tesla MRI without an endorectal coil and reported that mean ADC, median ADC, ADC %10, ADC %90, kurtosis, and skewness values were significantly different in distinguishing between benign prostatic hyperplasia nodules and prostate cancer when analysing the entire lesion. However, this study also included patients who had undergone prostatectomy, and the ROI selection differed from that in the present study.
Studies in the literature have demonstrated a positive correlation between PSA values and Gleason scores [25–27]. Consistent with the literature, the present study found that PSA values significantly differed in distinguishing between benign and malignant lesions, as well as in differentiating Gleason 6 from Gleason 7 cancers. Additionally, a study investigating the relationship between PSA values and PIRADS v2 scores showed a significant correlation [28]. In the current study, PSA values were compared with PIRADS v2.1 scores, revealing a statistically significant difference.
In the present study, ADC histogram parameters – ADC max, standard deviation, entropy, voxel count, and volume – were found to be statistically significant in distinguishing between benign and malignant lesions. These parameters were numerically higher in the malignant group compared to the benign group. Entropy, which reflects the irregularity or complexity of pixel intensity distributions, is a measure of tissue heterogeneity [29]. It is known that malignant lesions often contain high cellular atypia and components such as cystic-necrotic areas that increase heterogeneity. Considering this, we believe that entropy is a crucial parameter for distinguishing between benign and malignant prostate lesions. In texture analysis studies of genitourinary malignancies using computed tomography (CT), entropy values have been shown to correlate with malignancy versus benignity and histological subtypes in kidney lesions [30,31]. A study investigating the role of T2-weighted MRI texture analysis in evaluating aggressiveness in peripheral zone prostate cancer also found that entropy was correlated with aggressiveness [32]. Rosenkrantz et al. [33] reported that ADC entropy valueswere significantly higher in cases with Gleason 4+3 compared to those with Gleason 3+4. However, our literature review did not find other studies that specifically addressed the effectiveness of entropy in differentiating between malignant and benign prostate lesions. Thus, the current study suggests that entropy could serve as an additional diagnostic criterion in prostate cancer diagnosis beyond PIRADS scores. Furthermore, despite including premalignant lesions and lesions with Gleason score 6, which are technically not classified as prostate cancer, in the benign group, these findings enhance the value of the study.
In the literature, studies typically exclude cases with benign pathology results and include only patients with malignant pathology results. In the present study, because the goal was to distinguish between benign and malignant patients, cases with benign pathology results were also included if lesions were identified in the PZ on MR images. Our analysis revealed that parameters such as ADC histogram percentiles, ADC mean, and ADC min did not yield significant results for differentiating between benign and malignant lesions. These findings are consistent with those of Lin et al. [19]. There are 2 possible reasons why these ADC parameters did not provide significant results in our study. First, the inclusion of patients with benign results that included diagnoses such as ASAP (atypical small acinar proliferation) and PIN (prostatic intraepithelial neoplasia) in the benign group might be influencing the results. It is known that some of these lesions, upon repeat biopsies, may eventually be found malignant. Andras et al. [34] reported that patients with ASAP/HGPIN often have high PSA values and PIRADS 5 scores. Second, it is possible that the inclusion of patients whose pathology results were Gleason 3+3 but had tumour volumes of less than 0.5 cc, which were classified as benign according to PIRADS guidelines, might have contributed to the lack of significant findings in differentiating malignant lesions.
Our study had several limitations. First, being a retrospective study, it involved a relatively small patient population. However, our sample size was comparable to that of similar studies in the literature, most of which were also retrospectively designed. Second, the number of tumours with high Gleason scores in our study population was low, similar to other studies, which may have affected the distribution of the data. Third, the reliability of the correlation between MRI and pathology samples is a concern. Most studies in the literature are based on patients who have undergone radical prostatectomy or MRI/TRUS fusion biopsy, which may introduce selection bias. The MRI/TRUS fusion biopsy is time-consuming, requires specialised equipment and teams, and is costly, making it unavailable at many centres. In our study, to avoid selection bias and to evaluate the differentiation between benign and malignant lesions, the lesions corresponding to the anatomical regions from which the samples were obtained (with additional biopsies taken from MRI-described lesions and suspicious findings on TRUS during the procedure) were targeted and segmented on MRI. In addition, one study reported that there was no significant difference between cognitive biopsy and fusion biopsy in detecting CSCs [35]. Care was taken to exclude tissue considered healthy during segmentation, and accuracy was verified by 2 readers. Nevertheless, the image-pathology correlation remains uncertain.
Fourth, the lack of standardisation in both the software programs used and the methods for extracting histogram features makes it challenging to ensure reproducibility in image processing.
Fifth, variations in the magnetic flux density strength of MRI devices can impact the results. It is known that higher magnetic flux density strengths can enhance diagnostic performance by affecting signal intensity in diffusion-weighted imaging. However, ADC maps are derived from logarithmic mathematical calculations. Caruso et al. [36] compared image quality between 1.5 Tesla and 3 Tesla MRI for rectal cancer and found no significant difference in ADC signal intensity.
Finally, to account for tumour heterogeneity, this study segmented the entire lesion using a volumetric ROI. This approach requires more time and attention, which may limit its practical use in clinical settings. In the literature, alternative methods have been used for various cancer types, where measurements are taken from a single ROI in the visually most restricted diffusion area of the lesion. While this approach provides a quick assessment of minimum ADC, it does not encompass the entire lesion and may be inadequate in representing tumour heterogeneity.
Conclusions
In this study, we investigated the utility of ADC histogram parameters for differentiating between benign and malignant PZ prostate lesions, as well as predicting Gleason scores non-invasively. Our findings indicated that ADC histogram metrics such as ADC max, standard deviation, entropy, voxel count, and volume were statistically significant in distinguishing between benign and malignant lesions. Entropy emerged as a key parameter, reflecting tissue heterogeneity and demonstrating its importance in differentiating between benign and malignant lesions. In addition, our findings showed that some parameters were associated with Gleason scores in malignant lesions and gave statistically significant results. In light of these findings, we propose that ADC histogram analysis could contribute to non-invasively predicting lesion aggressiveness and could be used in conjunction with PI-RADS scores to enhance the prediction of malignancy. However, further research with larger cohorts is needed to support these findings. Future studies might investigate whether combining ADC histogram data with PI-RADS scores improves the positive predictive value for distinguishing between benign and malignant lesions compared to using PI-RADS scores alone.
In the literature, studies comparing ADC histogram data with Gleason scores often use patient samples consisting solely of prostate cancer cases, which may lead to overly optimistic results due to selection bias. We believe that the results obtained from our study, with its different design, will provide significant contributions to the literature in this context.