Introduction
Contrast-enhanced mammography – background
Contrast-enhanced mammography (CEM) is a breast imaging technique that detects iodinated contrast pooling in the interstitial space around tumour cells. Contrast accumulation is detected through near-simultaneous low-energy and high-energy acquisitions (below and above the k-edge of iodine) and the creation of a recombined CEM image [1]. The low-energy images can be obtained in standard projections, with their quality comparable to full-field digital mammography (FFDM) [2].
Due to neoangiogenesis, breast carcinoma (BC) is characterised by numerous, irregular, branching blood vessels with increased permeability [3]. CEM therefore allows for a functional assessment of the vascular bed, unlike FFDM which detects solely morphological changes in breast tissue. Although breast ultrasound (US) offers the possibility to detect increased vasculature and altered blood flow parameters in tumours [4], it does not allow for an assessment of contrast pooling in the interstitial space.
The acquisition of low- and high-energy images results in an increased average glandular radiation dose. However, this dose typically remains below 3 mGy, with specific values dependent on breast size and composition [5].
Comparison of contrast-enhanced mammography with other breast imaging modalities
Several studies have demonstrated that CEM offers superior diagnostic performance compared to FFDM or US, maintaining high sensitivity even in patients with dense breast tissue [6-12]. The high diagnostic value of CEM was further emphasised by a meta-analysis of 60 studies, including 10,605 patients [13].
Because both CEM and breast magnetic resonance imaging (MRI) detect increased vascular permeability, both methods have similar performance in lesion detection and local staging [14-16] MRI should be considered in patients with lobular carcinoma (due to weak enhancement in CEM), breast implants, and lesions that may extend beyond the field-of-view of mammography [17]. Both CEM and MRI are sensitive in detecting additional cancer foci [18,19], with some studies suggesting higher sensitivity for MRI in this regard [20,21].
Tumour staging with CEM has been shown to correlate more closely with histopathology compared to FFDM, with FFDM underestimating tumour size and CEM slightly overestimating it [22-25]. There are some conflicting results when comparing tumour size assessment by CEM and US. Some studies report that CEM has superior correlation with histopathology, while US tends to underestimate tumour size [23,25,26]. Other studies have found no significant difference in tumour size assessment between CEM and US [27,28].
Importance of accurate breast carcinoma staging
An accurate evaluation of the primary tumour size within the breast based on the TNM classification (T category) is essential for determining further disease management and improving clinical outcomes [29]. Clinical tumour staging (cT) for patients with pathologically confirmed carcinoma based on radiological examinations guides the type and extent of surgical intervention, radiation treatment, or use of chemotherapy [30]. Precise radiological assessment of the tumour extent has been used to qualify patients for partial breast irradiation [31]. Comparing the tumour size to breast size can enable breast-conserving treatment even in more advanced stages (primary tumour size > 5 cm, T3) [32,33].
A proportion of BC patients do not undergo surgical treatment, resulting in the absence of a pathological T category (pT). Others may receive surgery after several months of neoadjuvant chemotherapy, resulting in a ypT category. In such cases, the cT category, primarily based on radiological assessments at diagnosis, becomes the key indicator of the tumour’s extent before treatment. Accurate radiological determination of cT is crucial for qualifying patients for clinical trials, ensuring the accuracy of cancer registry data, and influencing 5-year survival analyses by stage and overall prognosis.
Contrast-enhanced mammography at the Greater Poland Cancer Centre
The Greater Poland Cancer Centre (GPCC), located in Poznan, Poland, serves as a prominent tertiary referral centre for oncology. It offers comprehensive services for BC, with diagnostics, surgical therapy, radiotherapy, and oncology services.
In recent years, both the COVID-19 pandemic and the war in neighbouring Ukraine have contributed to an increase in the proportion of advanced BC cases treated at the GPCC [34,35]. Amid these challenges, CEM, with its high diagnostic accuracy, has probably played a critical role in ensuring correct staging for BC patients, aiding in effective treatment.
Objectives of the study
The main objective of this study is to evaluate whether the use of CEM, compared to US and FFDM, leads to a better clinical estimation of tumour size, elevates the clinical tumour staging (cT category), and increases the detection rate of multifocal or multicentric BC – cT(m).
Material and methods
This is a single-centre, cross-sectional study of 73 adult patients, including 5 with bilateral BC, resulting in a total of 78 cases. All patients underwent breast diagnostics at the GPCC Breast Cancer Unit (BCU) between January 2022 and October 2023. We included all cases of CEM with BI-RADS scores of 4, 5, and 6 in patients who had previously undergone FFDM and breast US at the GPCC within one month prior to CEM. Cases with BI-RADS scores of 4 and 5 were included in the study due to their classification as suspicious or highly suggestive of malignancy, as defined by the American College of Radiology CEM lexicon [36]. All cases enrolled in the study were later confirmed pathologically as invasive BC.
As a tertiary referral centre, the GPCC treats patients from across Northwestern Poland. Consequently, the majority of CEM examinations performed at the GPCC BCU during the study period (299 out of 377 cases) were excluded from the study because the FFDM or US was either performed outside of the GPCC or conducted more than one month prior to CEM.
All radiological examinations for cases included in the study – CEM, FFDM, and US – were performed at our institution and read by specialist radiologists. FFDM and CEM were performed using GE Senographe Pristina, with craniocaudal (CC) and mediolateral oblique (MLO) projections of each breast. Images were read on a dedicated workstation with two 5-million-pixel monitors (Barco MDCG-5221). CEM was performed following intravenous administration of Bayer Ultravist 370, delivered using an automatic injector (MEDRAD Salient), 2.5-3.0 ml/s. The contrast dose, customised to the patient’s body weight, was calculated using the formula: body weight [kg] × 1.5 – 20%. Acquisitions were taken 2-8 min after contrast injection. Bilateral breast and axillae US scans were performed by specialist radiologists using a Samsung RS80A, equipped with a 4-15 MHz linear-array transducer LM4-15B.
Data extracted from the hospital information system (Eskulap, Nexus Polska Sp. z o.o.) included the dates of radiological examinations, BI-RADS scores, and pathology reports confirming the presence of invasive BC. Radiology reports were analysed to obtain information on the size of the largest radiologically suspicious lesion (measured in millimetres), the presence of multifocal or multicentric disease, and features of chest wall or skin invasion. Based on the data extracted, the T category was assigned for each case, according to the 8th edition manual on TNM classification published in affiliation with the Union for International Cancer Control [37]. Some reports contained information on the exact number and location of suspicious foci, while others just mentioned the presence of multifocal/multicentric disease. Due to these discrepancies, for cases with more than one suspicious focus, the suffix “(m)” was added to the T-stage to denote multiplicity.
This study was conducted in accordance with the Strengthening the Reporting of Observational Studies in Epidemiology (STROBE) guidelines [38]. Ethical review and approval were waived by the Ethics Committee of Poznan University of Medical Sciences because our study was not classified as a medical experiment.
Statistical analysis
Statistical analyses were performed using PQStat v.1.8.4.164. The type of analysis was selected based on the measurement scale representing the collected data, along with the appropriate analysis model. In cases where normal distribution assumptions were not met, non-parametric tests were applied. To assess the relationship between the cT stage determination and the diagnostic methods used (CEM, FFDM, and US), Fisher’s exact test was employed; the chi-square test could not be used due to the failure to meet Cochran’s condition. Pairwise comparisons among diagnostic methods were conducted with Bonferroni correction to account for multiple comparisons. The results of these comparisons are displayed in a contingency table.
Results
False-negative results occurred across all imaging modalities, with 1 in US, 5 in FFDM, and 2 in CEM. In each of these 8 cases, the primary tumour was successfully detected in the other 2 imaging modalities. For false-negative results the recorded tumour size was 0 mm.
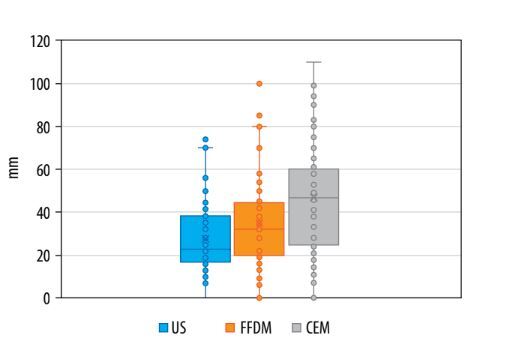
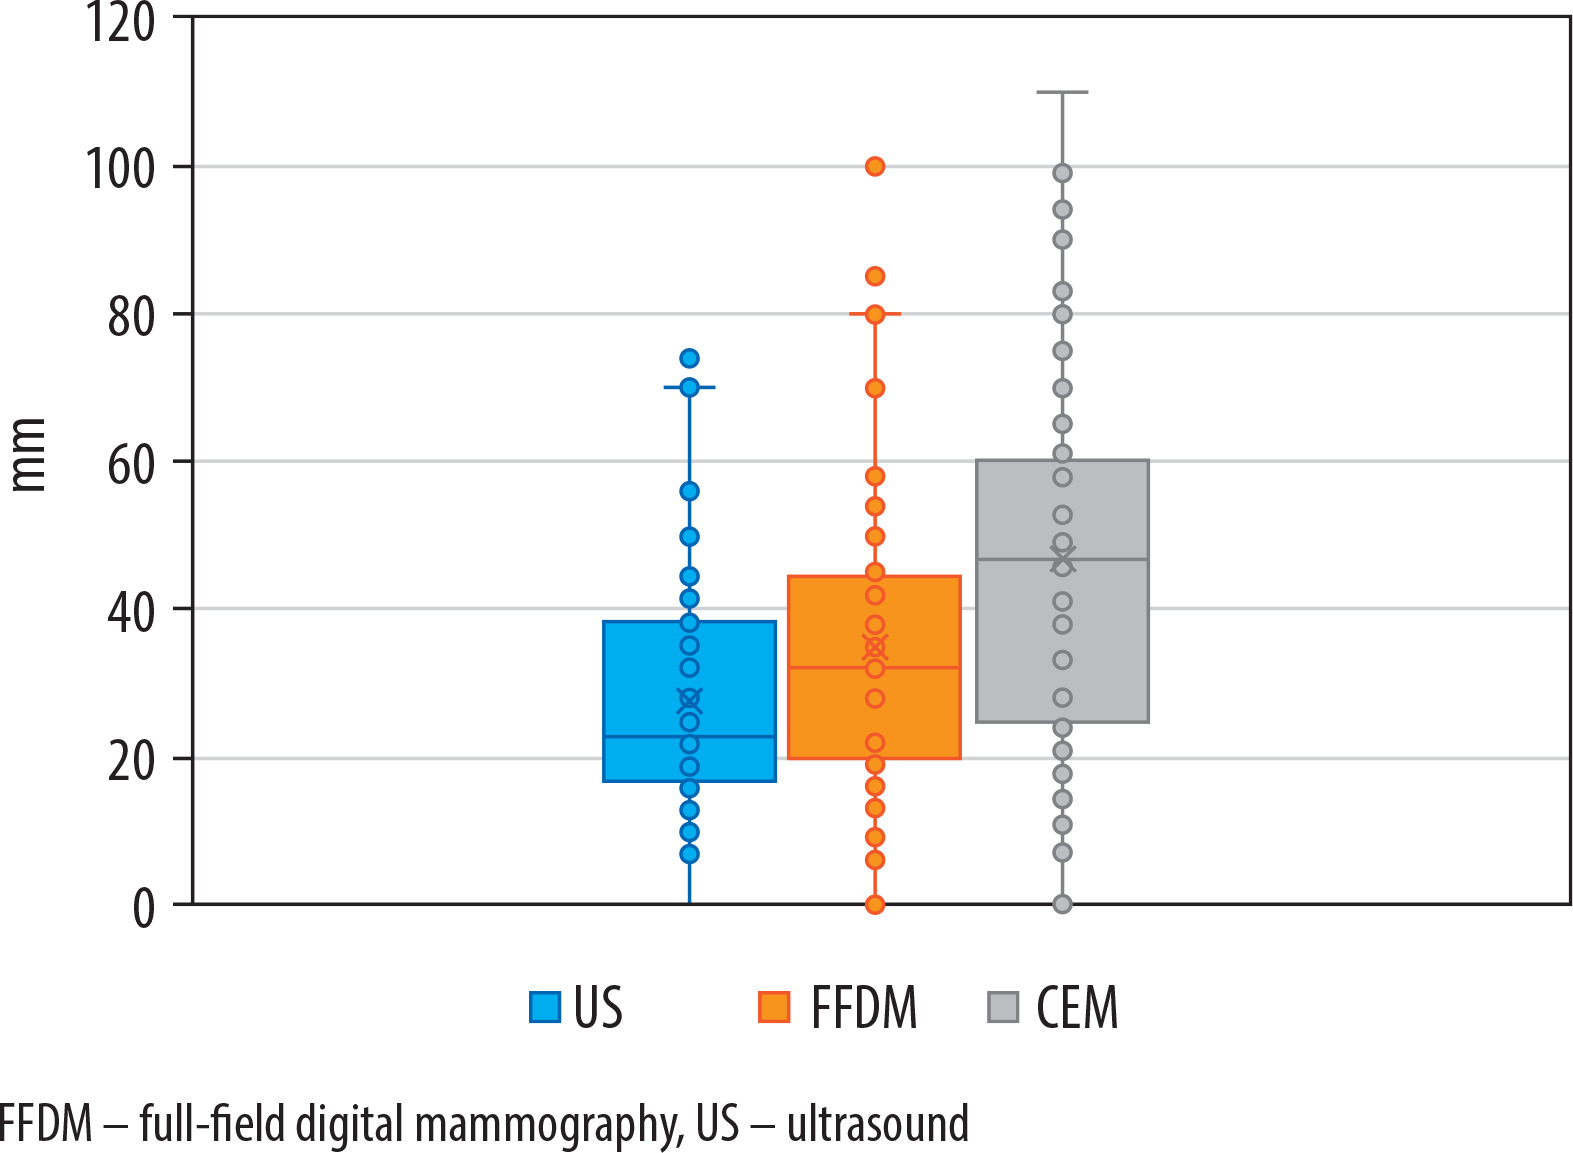
The median tumour size measured with US examinations was 23 mm, mean 28 mm (range 0-74 mm). For FFDM, the median tumour size was 33 mm, mean 35 mm (range 0-100 mm). For CEM, both the median and mean values for tumour size were 47 mm (range 0-110 mm) – see Table 1 and Figure 1. The full set of measurements for all cases is available in Supplementary Table 1.
Table 1
Descriptive statistics of tumour sizes measured in each modality
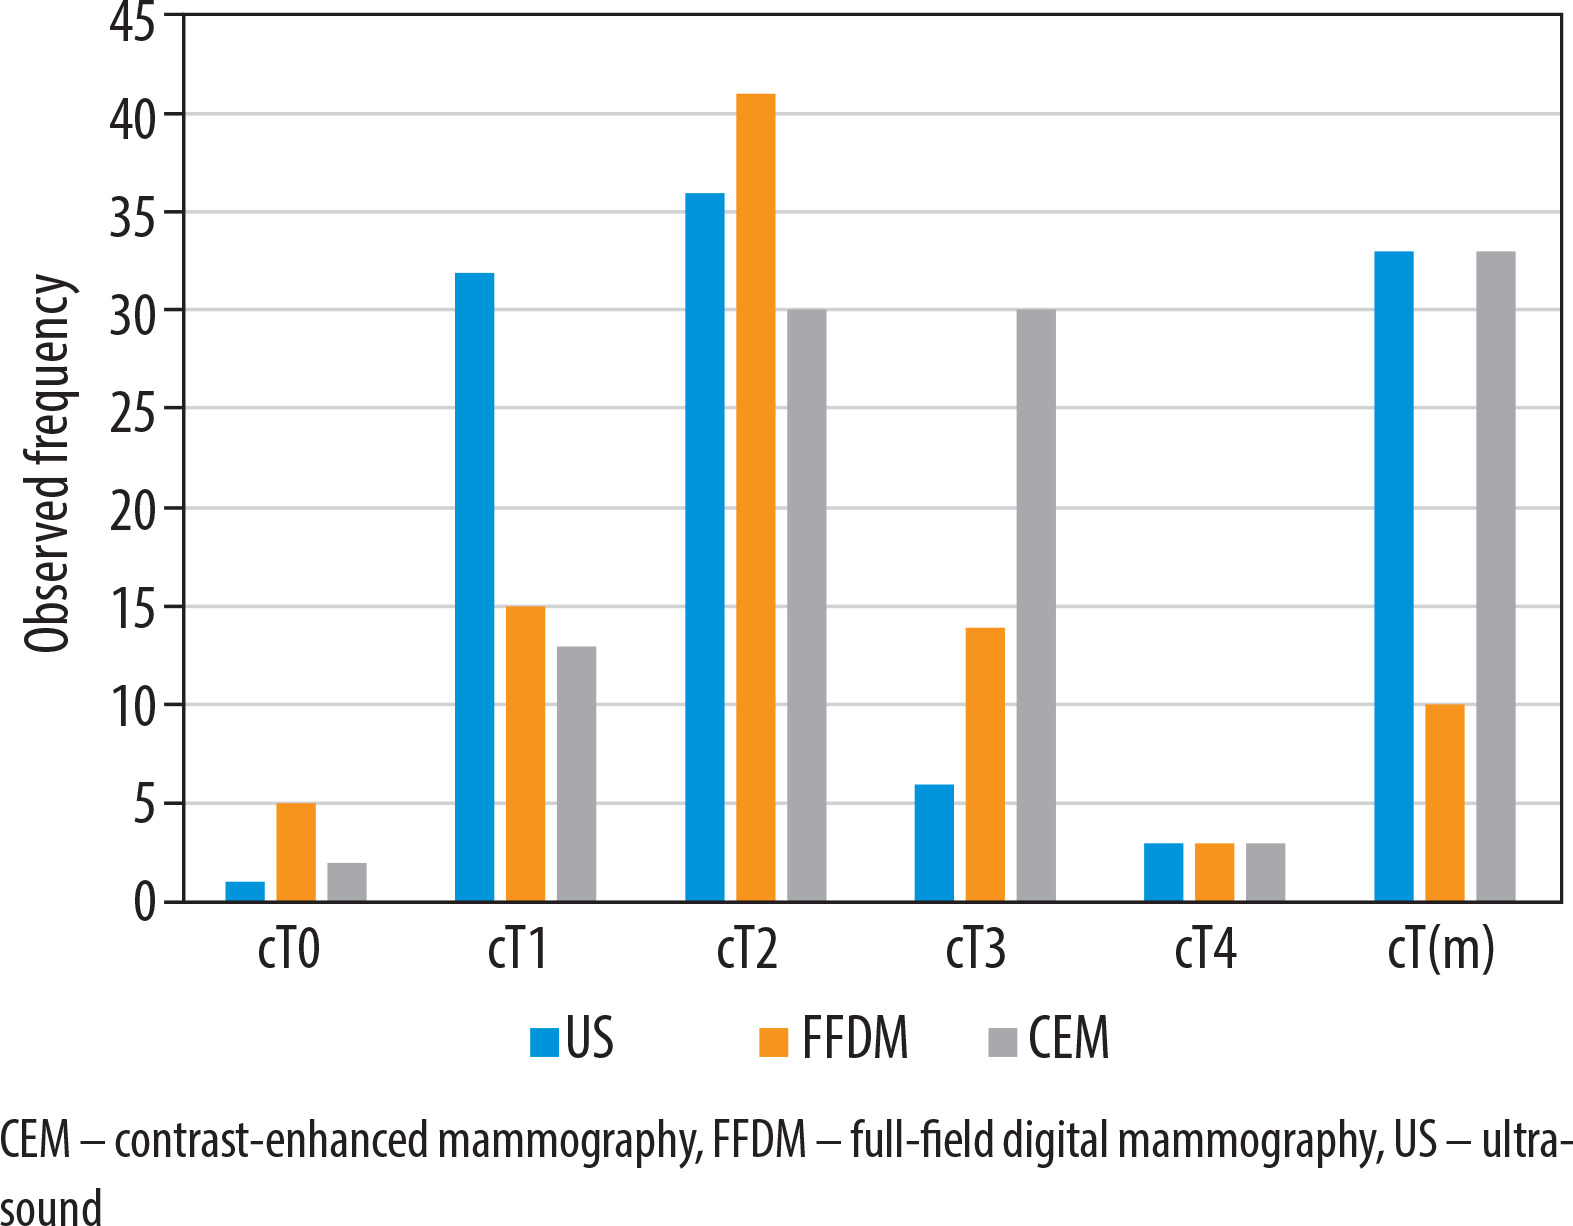
Variations in diagnosed tumour sizes led to differences in the distribution of cT categories across the 3 imaging modalities. The most frequently observed local tumour staging was cT2 for both US (46%) and FFDM (53%). The second most common category for those 2 modalities was cT1, with a higher incidence in US (41%) compared to FFDM (19%). More cases were categorised as cT3 based on FFDM (18%) than based on US (8%). The incidence of cT4 was identical in both US and FFDM, at 4%. The tumour was not identified (false-negatives) in 6% of FFDM examinations and in 1% of US examinations – cT0.
The distribution of cT categories for CEM followed a different pattern, with an equal incidence of cT2 and cT3 (both 38%), followed by cT1 (17%) and cT4 (4%). The tumour was not identified in 3% of CEM examinations – false-negatives, cT0.
US and CEM demonstrated comparable performance in detecting multiplicity – cT(m) – with each identifying 33 such cases (42%). In contrast, FFDM detected only 10 cases (13%). Table 2 and Figure 2 provide an overview of the cT category distribution, including multiplicity detection, across the 3 imaging modalities.
Table 2
Clinical T category distribution
Pairwise comparisons of the cT stage distribution across all imaging modalities showed statistically significant differences, with p-values <0.004 for each pair – exact p-values for each pair comparison are presented in Table 3.
Discussion
Tumour size measurements and detection of multiplicity
Our study demonstrates that tumour size, measured by both mean and median values, was largest in CEM, and smallest in US, consistent with other publications [23,25,26]. This outcome persists despite including false-negative cases in the calculations for each imaging modality, where undetected tumours were assigned a size of 0 mm. Notably, the impact of this inclusion was minimal for US, which had only one false-negative case, compared to FFDM and CEM with 5 and 2 false-negative cases, respectively. Consequently, the proportional reduction in tumour size was less pronounced for US than for FFDM and CEM.
We retrospectively analysed reports from US, FFDM, and CEM, extracting tumour sizes from records stored in the hospital information system. In 2 instances, the CEM reports indicated no enhancement in the recombined images, with no information provided on the lesion’s conspicuity or size in the low-energy images. For these cases, we assigned a tumour size of 0 for CEM. However, in both cases, a tumour size in millimetres was reported from a FFDM performed within a month prior (23 mm and 28 mm) – see Supplementary Table 1. It is possible that the tumours were visible in the low-energy CEM images, but this information was not included in the reports. Because CEM contains both low-energy as well as recombined images, it is crucial to report findings from both sets of images, as recommended by the ACR BI-RADS lexicon [36].
The largest mean and median values observed in CEM probably reflect the functional assessment of the tumour’s vascular bed provided by this modality. Additionally, the maximum tumour size measured by US (74 mm) was lower than that measured by FFDM (100 mm) and CEM (110 mm). This finding aligns with a study by Gruber et al. [39], who reported an increasing underestimation of invasive BC size by US as the histological tumour size increased, with the greatest discrepancy in larger lesions. Stachs et al. [40] also observed that sonographic underestimation of tumour size is most common in tumours larger than 20 mm. Large tumours may exceed the field of view of the US transducer, and their posterior margin can be difficult to visualise due to poor penetration [41].
The proportion of cases radiologically diagnosed as either multifocal or multicentric was identical for US and CEM (42%), with fewer such cases identified by FFDM (13%). This is an unexpected outcome, because CEM has previously been reported to have superior sensitivity in detecting multiple BC foci [28]. However, it is important to note that our study did not analyse the number of detected foci due to inconsistencies in radiological reports, preventing a detailed comparison of the performance of the 3 modalities in this aspect.
Clinical tumour staging – determination of the cT category
There are statistically significant differences in clinical tumour staging (cT) between the 3 imaging modalities in the study population. Reflecting the observed differences in tumour size, the cT category is highest with CEM and lowest with US. These variations can have a substantial impact on patient management, and awareness of these differences is crucial for the multidisciplinary team (MDT) to devise an optimal treatment plan. Given the extensive literature highlighting CEM’s superior diagnostic accuracy and close correlation with histopathology [22,23,25,26], it is reasonable to conclude that the use of CEM at the GPCC probably helped prevent the understaging of BC, ensuring more accurate assessments and appropriate care.
For a significant proportion of patients with BC, tumour size determined through radiological examinations at diagnosis serves as the only source for primary tumour staging, which plays a crucial role in overall clinical staging. For instance, after neoadjuvant chemotherapy, the ypT category can be assigned, often reflecting a smaller tumour size due to a favourable treatment response. A recent publication from the GPCC reported that the percentage of BC patients receiving neoadjuvant chemotherapy ranged from 27% to 43%, depending on the periods analysed within 2019 and 2020 [34]. For these patients, utilising a diagnostic method at the time of diagnosis, which closely correlates with histopathological findings, is essential to ensure accurate staging.
The significant differences in cT categories between CEM, US, and FFDM observed in our study underscore the risk of misclassifying patients for inclusion in clinical trials. Because clinical trials often have strict entry criteria to evaluate the effects of specific treatments, accurate staging is crucial to ensure that patients are appropriately qualified. Our findings suggest that CEM should be considered as a decisive examination to determine eligibility, as it may help avoid understaging of BC. By using CEM for patient qualification, clinical trials can rely on a more reliable database, leading to more accurate study results and better-informed conclusions about treatment efficacy.
The variations in cT categories observed in our study also have significant implications for cancer registries. When comparing datasets from hospitals that routinely use CEM with those that use FFDM and US for BC staging, it is essential to exercise caution, because these datasets may not be directly comparable. Similarly, caution is needed when analysing historical data on BC staging obtained using FFDM and US against more recent data collected with CEM. The shift to CEM could create the appearance of an artificial increase in BC staging, reflecting changes in imaging sensitivity rather than an actual change in disease severity. This distinction is crucial for accurate data interpretation and for maintaining consistency in registry records over time. The upgraded local tumour staging by CEM can also affect predictions of patient outcomes, including 5-year survival rates by stage.
Application of CEM at the GPCC
At the GPCC we have observed a growing proportion of advanced BC cases in recent years. During the initial months of the COVID-19 pandemic, there was a noticeable shift in disease staging among BC patients, with an increase in the proportion of stage II and III cases. This shift led to higher rates of neoadjuvant chemotherapy and mastectomies [34]. More recently, following the outbreak of full-scale war in Ukraine in February 2022, the GPCC has seen a significant influx of Ukrainian patients, many of whom are young and present with advanced disease [35]. Amid these evolving challenges, our study underscores the critical role of accurate imaging tools that can precisely determine tumour size, providing essential insights into the shifting characteristics of the patient population.
All patients in our study were referred for CEM as a follow-up to US and FFDM. Given the high proportion of cT2 and cT3 cases in CEM (Table 2), it is likely that the study group was characterised by more advanced disease and may not be fully representative of the broader BC patient population treated at our centre. For instance, patients with smaller tumours and a fatty breast composition may not have been referred for CEM. Conversely, cases diagnostically challenging in US and FFDM were more likely to be referred for further evaluation with CEM – this is a possible explanation for the relatively high proportion of false-negative cases observed in FFDM in our study. This selection bias, combined with existing literature emphasising the tendency of US to underestimate tumour size in histologically larger tumours, could account for the pronounced differences observed between CEM and US in our study [39,40].
Potential limitations of the study
The availability of prior US and FFDM reports to radiologists interpreting CEM images introduces the potential for retrospective review bias. For instance, awareness of tumour multiplicity identified in previous exams could prompt radiologists to actively search for multiple foci of disease in CEM or focus excessively on detecting additional abnormalities. Additionally, because CEM was performed as a follow-up to US and FFDM, the possibility of selection bias must also be acknowledged.
Suggestions for further research
To minimise retrospective review bias, the analysis of cT staging using CEM can be conducted with the reading radiologist blinded to previous US and FFDM results. Furthermore, in cases where neoadjuvant chemotherapy has not been administered, a comparison with histopathology can be performed to evaluate any discrepancies between cT and pT staging.
Large-scale studies are essential to identify patient characteristics that justify routine use of CEM for staging of BC. Factors such as breast composition and tumour histology could play a role in determining which patients benefit most. Additionally, investigating differences in the radiological assessments of lesion size in cases of in situ BC may provide further insight into the utility of CEM across varying patient profiles.
Conclusions
Tumour size measurements were largest with CEM, followed by FFDM, and smallest with US. These observed size differences mean that CEM tends to elevate the cT category of BC compared to US and FFDM. Furthermore, CEM and US identified an equal number of cases with multifocal or multicentric disease, while FFDM detected fewer such cases. Given the strong correlation between tumour size measurements in CEM and histopathology reported in literature, CEM enhances the accuracy of local tumour staging in BC, thereby minimising the risk of understaging.