Introduction
Synthetic magnetic resonance imaging (MRI) represents a recent breakthrough in the field of MRI that allows the reconstruction or synthesis of various contrast-weighted images from a single MRI scan. Its fundamental principle revolves around the quantitative measurement of multiple physical properties to generate multiple contrasts within a single scan. Unlike traditional MRI, where parameters like repetition time (TR), echo time (TE), and inversion time (TI) are predetermined, synthetic MRI enables the modification of these parameters through mathematical computations [1].
MR relaxometry measures the relaxation characteristics of tissues (T1 and T2) in order to assess their physical qualities. Relaxometry-derived quantitative data can improve the way in which observed signal changes are characterised and make longitudinal comparisons more reliable. Since the T1 recovery and T2 decay curves are exponential, the predicted signal associated with T1 and T2 can be found utilising obtained data and nonlinear curve-fitting techniques.
Synthetic MRI is based on a quantitative MR sequence that measures the longitudinal relaxation rate (R1), transverse relaxation rate (R2), and proton density (PD); the most commonly employed sequence is multiple delay multiple echo (MDME). This specific sequence has a relatively short scan time, typically lasting between 6 and 7 minutes [2,3]. It employs a saturation recovery fast spin-echo (FSE) sequence with various saturation delays, and each acquisition involves a multi-echo readout.
When working with relaxometry, the most commonly used parameters are the relaxation times T1 and T2. However, in the described sequence, the focus is on measuring the relaxation rates, R1 and R2. The rationale behind this choice is that R1 and R2 exhibit a linear relationship with paramagnetism. This linearity enhances the robustness of these measures when calculating tissue relaxation and considering the effects of gadolinium-based contrast agents.
Central nervous system (CNS) tuberculomas can be solitary or conglomerated lesions caused by Mycobacterium tuberculosis often presenting with significant edema and mass effect. Conventional MRI may create confusion between CNS tuberculomas and primary CNS neoplasms particularly glioblastoma and may require additional sequences for differentiation including spectroscopy and perfusion. Relaxometry can add quantitative value to differentiation of these two entities, however, conventional relaxometry techniques are often disregarded due to their long acquisition times. Synthetic MR-based relaxometry can overcome this limitation with short acquisition time and simultaneous recording of R1 and R2 relaxation rates as well as proton density.
The aim of our study was to explore the utility of synthetic MR relaxometry (R1, R2 relaxation rates and PD) in differentiating tuberculoma from glioblastoma.
Material and methods
This prospective cohort study was performed over a period of one year at a tertiary care hospital. Ethical clearance was obtained from the institutional Ethics Committee. Written informed consent was taken from all participants. All patients with CNS tuberculomas and primary CNS neoplasms (glioblastoma) referred for MRI evaluation in this period were assessed and included in the study. Patients of all age groups with MR features of tuberculoma or glioblastoma with at least one lesion of 5 mm or more in size irrespective of the clinical symptoms of the patient were included. Patients excluded from the study were those with lesions too small to be characterized, i.e. < 5 mm in size, completely calcified lesion as seen in susceptibility weighted imaging (SWI) or previous computed tomography (CT), where MRI is contraindicated (metallic implants, pacemaker, claustrophobia, cochlear implants, etc.), or there is any contraindication for gadolinium (chronic kidney disease stage 5 with estimated glomerular filtration rate < 30 ml/min/1.73 m2) and patients where a final diagnosis could not be ascertained (either lost to follow-up or the patient died without any further work up). A total of 24 patients were included in the final analysis. Final diagnosis was ascertained in each case based on clinical, biochemical, and histopathological diagnosis as per the availability. Cases with primary CNS neoplasm were confirmed with histopathology (either with stereotactic biopsy or excision biopsy) whereas subjects with tuberculomas were mostly confirmed with biochemical and clinical parameters. Out of 24 subjects, 10 belonged to tuberculoma and 14 belonged to glioblastoma.
Image acquisition and analysis
All subjects were scanned on a single MRI scanner, i.e. a 3-Tesla Siemens Somatom Vida (Siemens Healthcare, Erlangen, Germany) system with a 32-array head coil, in a supine position. Synthetic MR was acquired in each patient using a TSE_MDME sequence (multiple delay multiple echo) on the 3T Siemens scanner. The order of sequences followed for each patient was T2 WI → FLAIR → DWI → SWI → T1 MPRAGE/SPACE → TSE_MDME → contrast injection → T1 MPRAGE/SPACE PC → TSE_MDME PC.
The parameters of this sequence were field of view 230 mm, slice thickness 4 mm, number of slices 30 with interleaved multi slice mode, matrix size 0.7 × 0.7 × 0.4 mm3, TR 4350 ms, TE multiple echoes with TE1 at 23 ms, flip angle 150°, phase encoding direction right to left, bandwidth 150 Hz, echo spacing 11.26 ms, and turbo factor 5. No flow compensation was used. The total duration of the sequence was 4.25 min. The contrast agent used was any one of the standard gadolinium-based contrast agents with a dose of 0.1 mmol/kg.
Synthetic MR processing and analysis
Synthetic MR data of each patient was transferred to a dedicated SyMRI workstation, and processing was done using SyMRI software. First the non-contrast MDME sequence was processed using SyMRI software followed by the post-contrast sequence. This software generates the synthetic images of T1, T2, FLAIR, PD, DIR, and PSIR sequences along with relaxometry maps, i.e. quantitative maps of R1, R2, and PD. Additionally the software also generates myelin maps and volumetric ratios of brain parenchymal, grey and white matter volumes, as well as the myelin ratio.
Analysis of relaxometry parameters in lesions
Using a free-hand method, the region of interest (ROI) was placed over the lesion at the following places: in the wall, in the core, and in the perilesional oedema in the quantitative relaxometry maps. The ROI was first placed in the wall of lesions in such a manner as to maximally cover the entire thickness of the wall with no inclusion of areas other than the wall. A free-hand ROI of the same size was then placed in the core of the lesion as well as in the contralateral normal white matter. For each of these locations, a minimum of 2 ROIs were placed and values averaged for greater accuracy of data. The following parameters were recorded: R1 and R2 relaxation rates and proton density. The same lesions were then analysed in the post-contrast relaxation maps, a same-sized ROI was placed in identical locations in the post-contrast maps, and the parameters were recorded.
Statistical analysis
Quantitative relaxometry parameters (R1, R2, PD from core, wall, and perilesional oedema) were recorded, and normality of data was tested across groups and subgroups using the Kolmogorov-Smirnov test. Because the data were not normally distributed across subgroups nonparametric tests were used for statistical analysis. The Kruskal-Wallis test was used for group comparisons across various subgroups for each parameter. Statistical significance across pairwise subgroups was analysed by using post-hoc pairwise tests for the Kruskal-Wallis test performed using the Dunn test method with Sidak correction. The Wilcoxon signed-rank test was used for changes in parameters across time points (pre- to post-contrast changes). ROC analysis was used in statistically significant parameters to obtain cut-off values between sub groups. The data were entered in an MS EXCEL spreadsheet, and analysis was done using Statistical Package for the Social Sciences (SPSS) version 26.0. A 2-tailed p-value of <0.05 with 95% CI was considered statistically significant.
Results
Demographic details
The mean age of the participants in our study was 39.48 ± 17.76 years, range 2-79 years. Out of the 24 participants, 10 were of tuberculoma and 14 were of glioblastoma. In the tuberculoma group 3 were females (30%), and in the glioblastoma group 6 were females (42%). The mean age in tuberculoma group was 33 years and mean age in the glioblastoma group was 44 years.
Analysis of relaxometry parameters from the core of the lesions (Figure 1, Table 1)
There was a significant difference between tuberculoma and glioblastoma in terms of R1 and R2 values of the core in pre- and post-contrast with the median R1, R2 being high in tuberculoma compared to glioblastoma. There was no significant difference between the groups in terms of PD values from core in pre- and post-contrast. Change in R1, R2, or PD values from core (post–pre) were not significantly different across the subgroups.
Table 1
Comparison of relaxometry parameters across core of lesions between tuberculoma and glioblastoma
Figure 1
Bar diagrams showing comparison of pre-contrast (A) and post-contrast (B) R1 and R2 relaxation rates between tuberculoma and glioblastoma across core, wall, and perilesional oedema
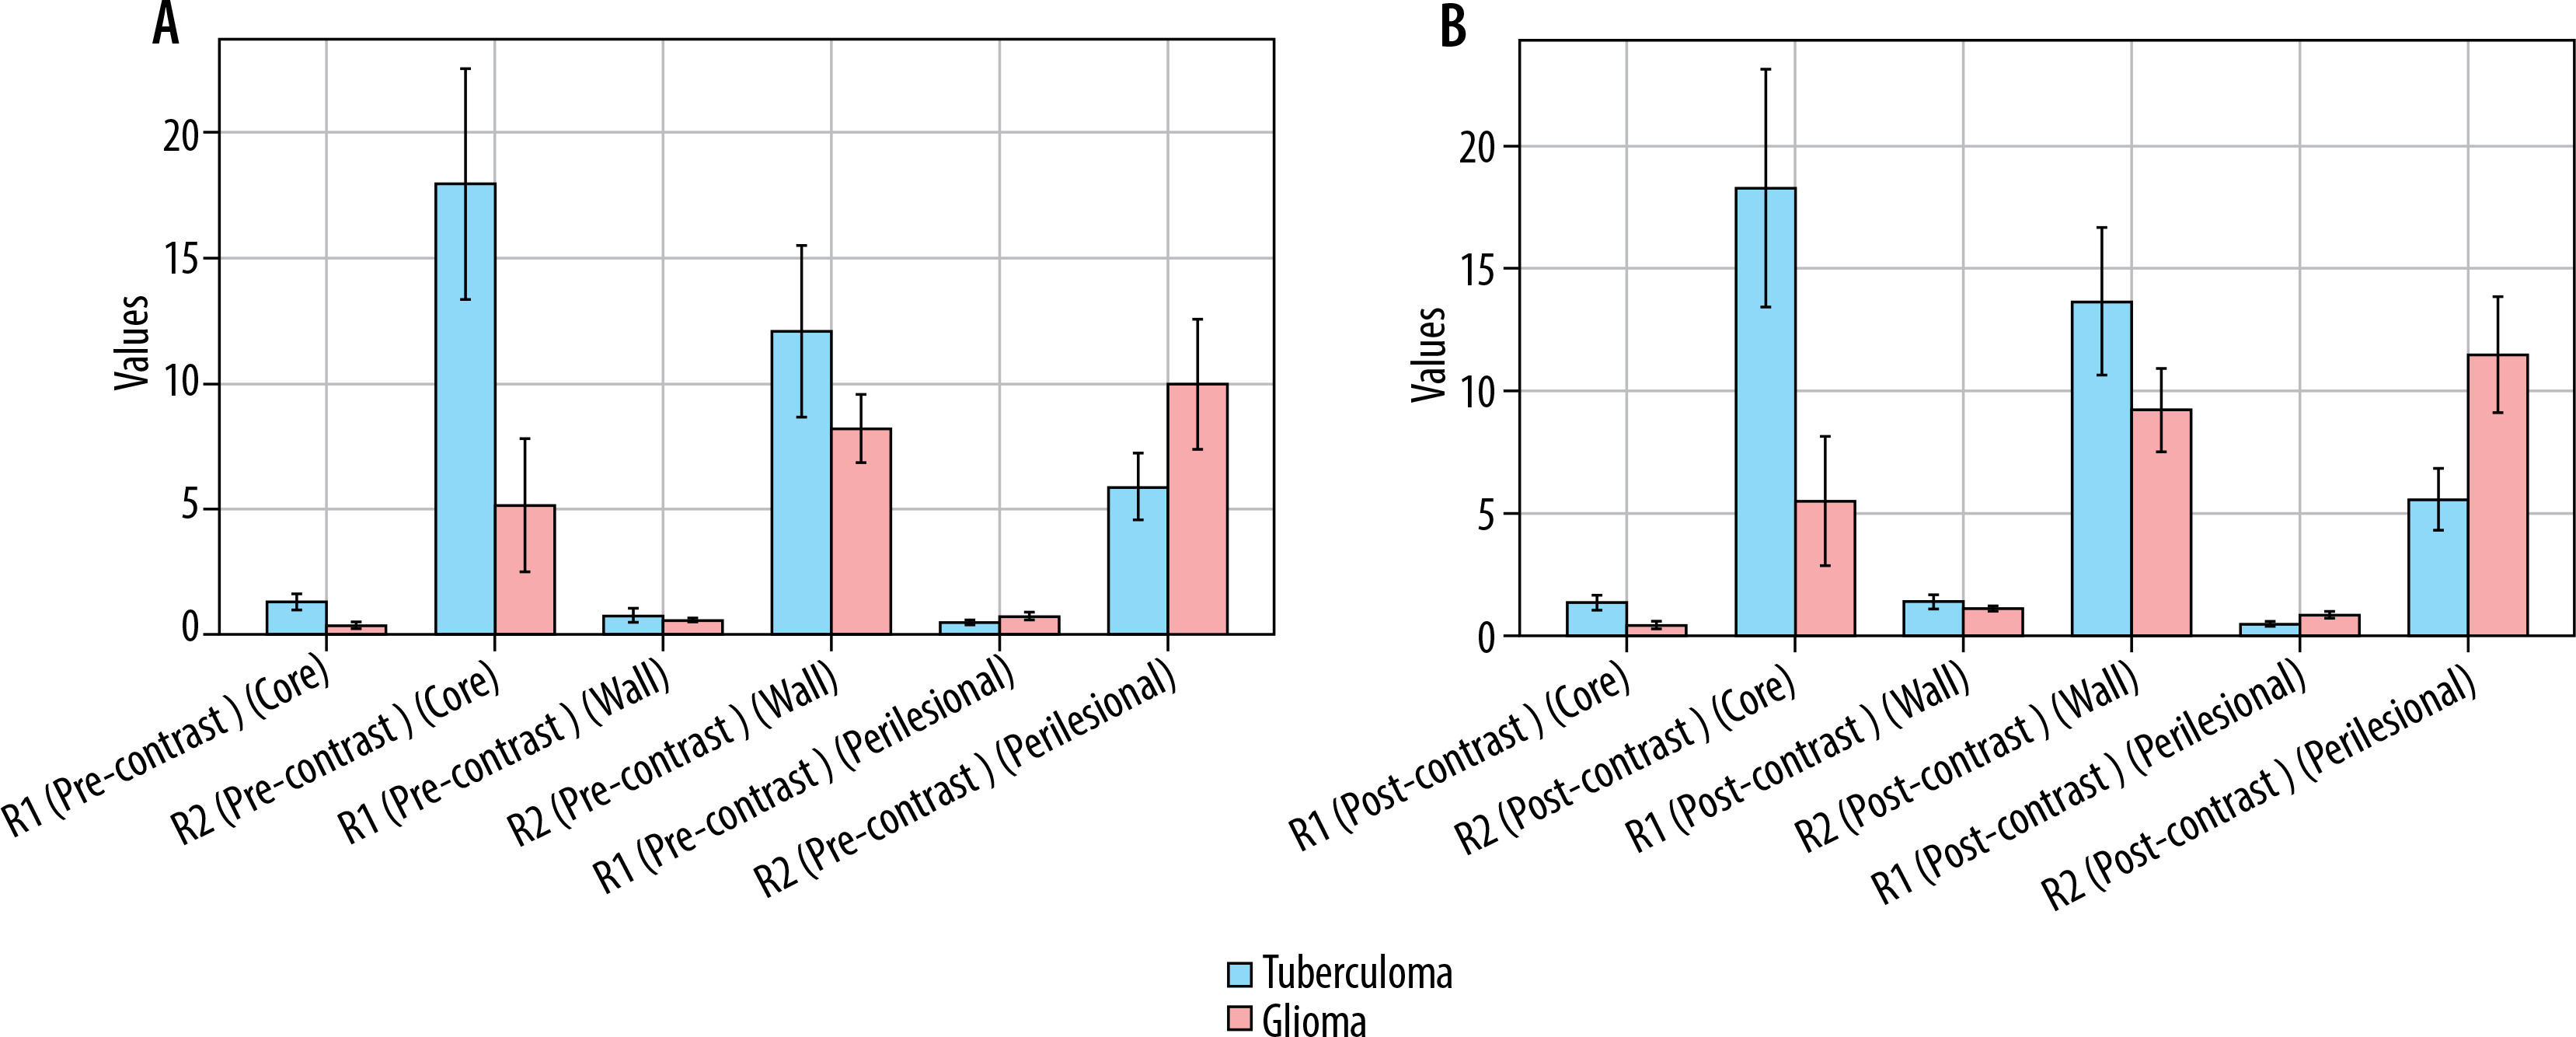
Figure 2
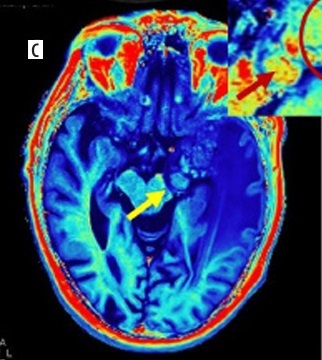
A 65-year-old male presented with low-grade fever, headache, and vomiting followed by altered sensorium for 2 days. Synthetic magnetic resonance images: axial T2 W (A) and T1 PC (B) showing conglomerated ring enhancing lesions which are T2 hypointense in left temporal lobe (yellow arrows on all images) with perilesional oedema s/o tuberculomas. Quantitative relaxometry maps of the same case. Post-contrast R1 (C) and R2 (D) maps showing the same lesions with better conspicuity with higher R1, R2 relaxation rates from the core of the lesions with low values in perilesional oedema (insight zoomed in image)
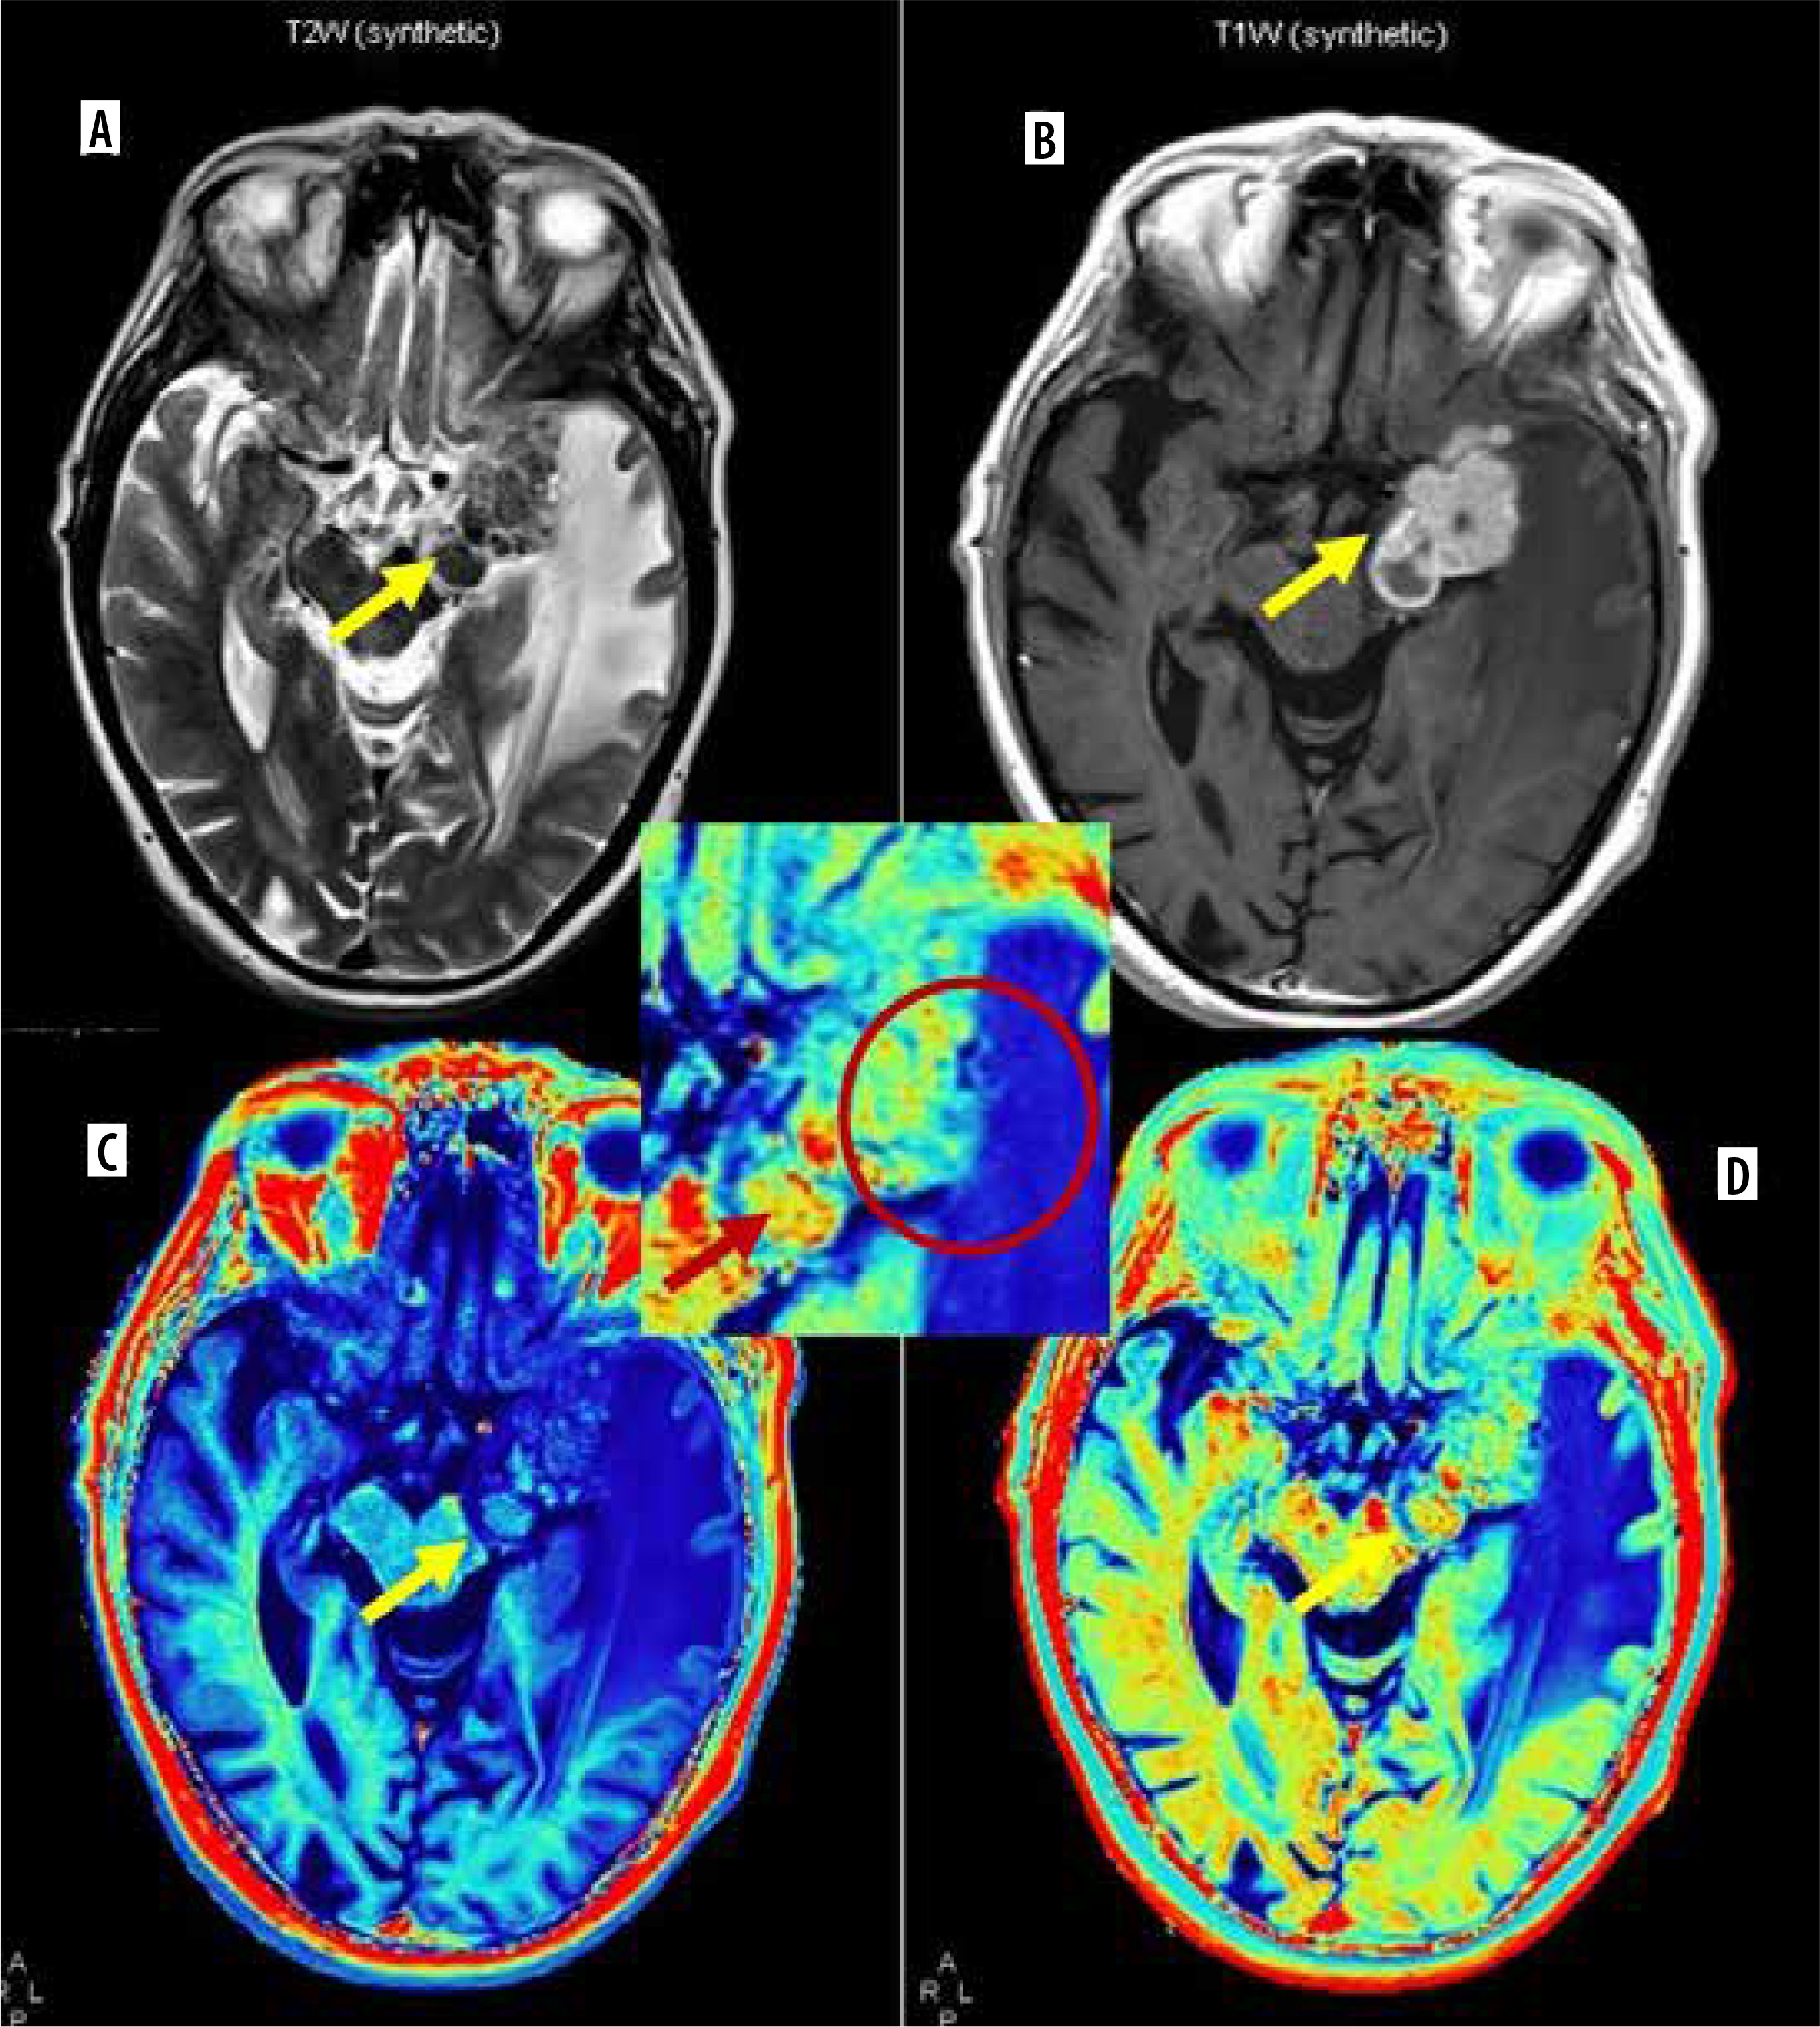
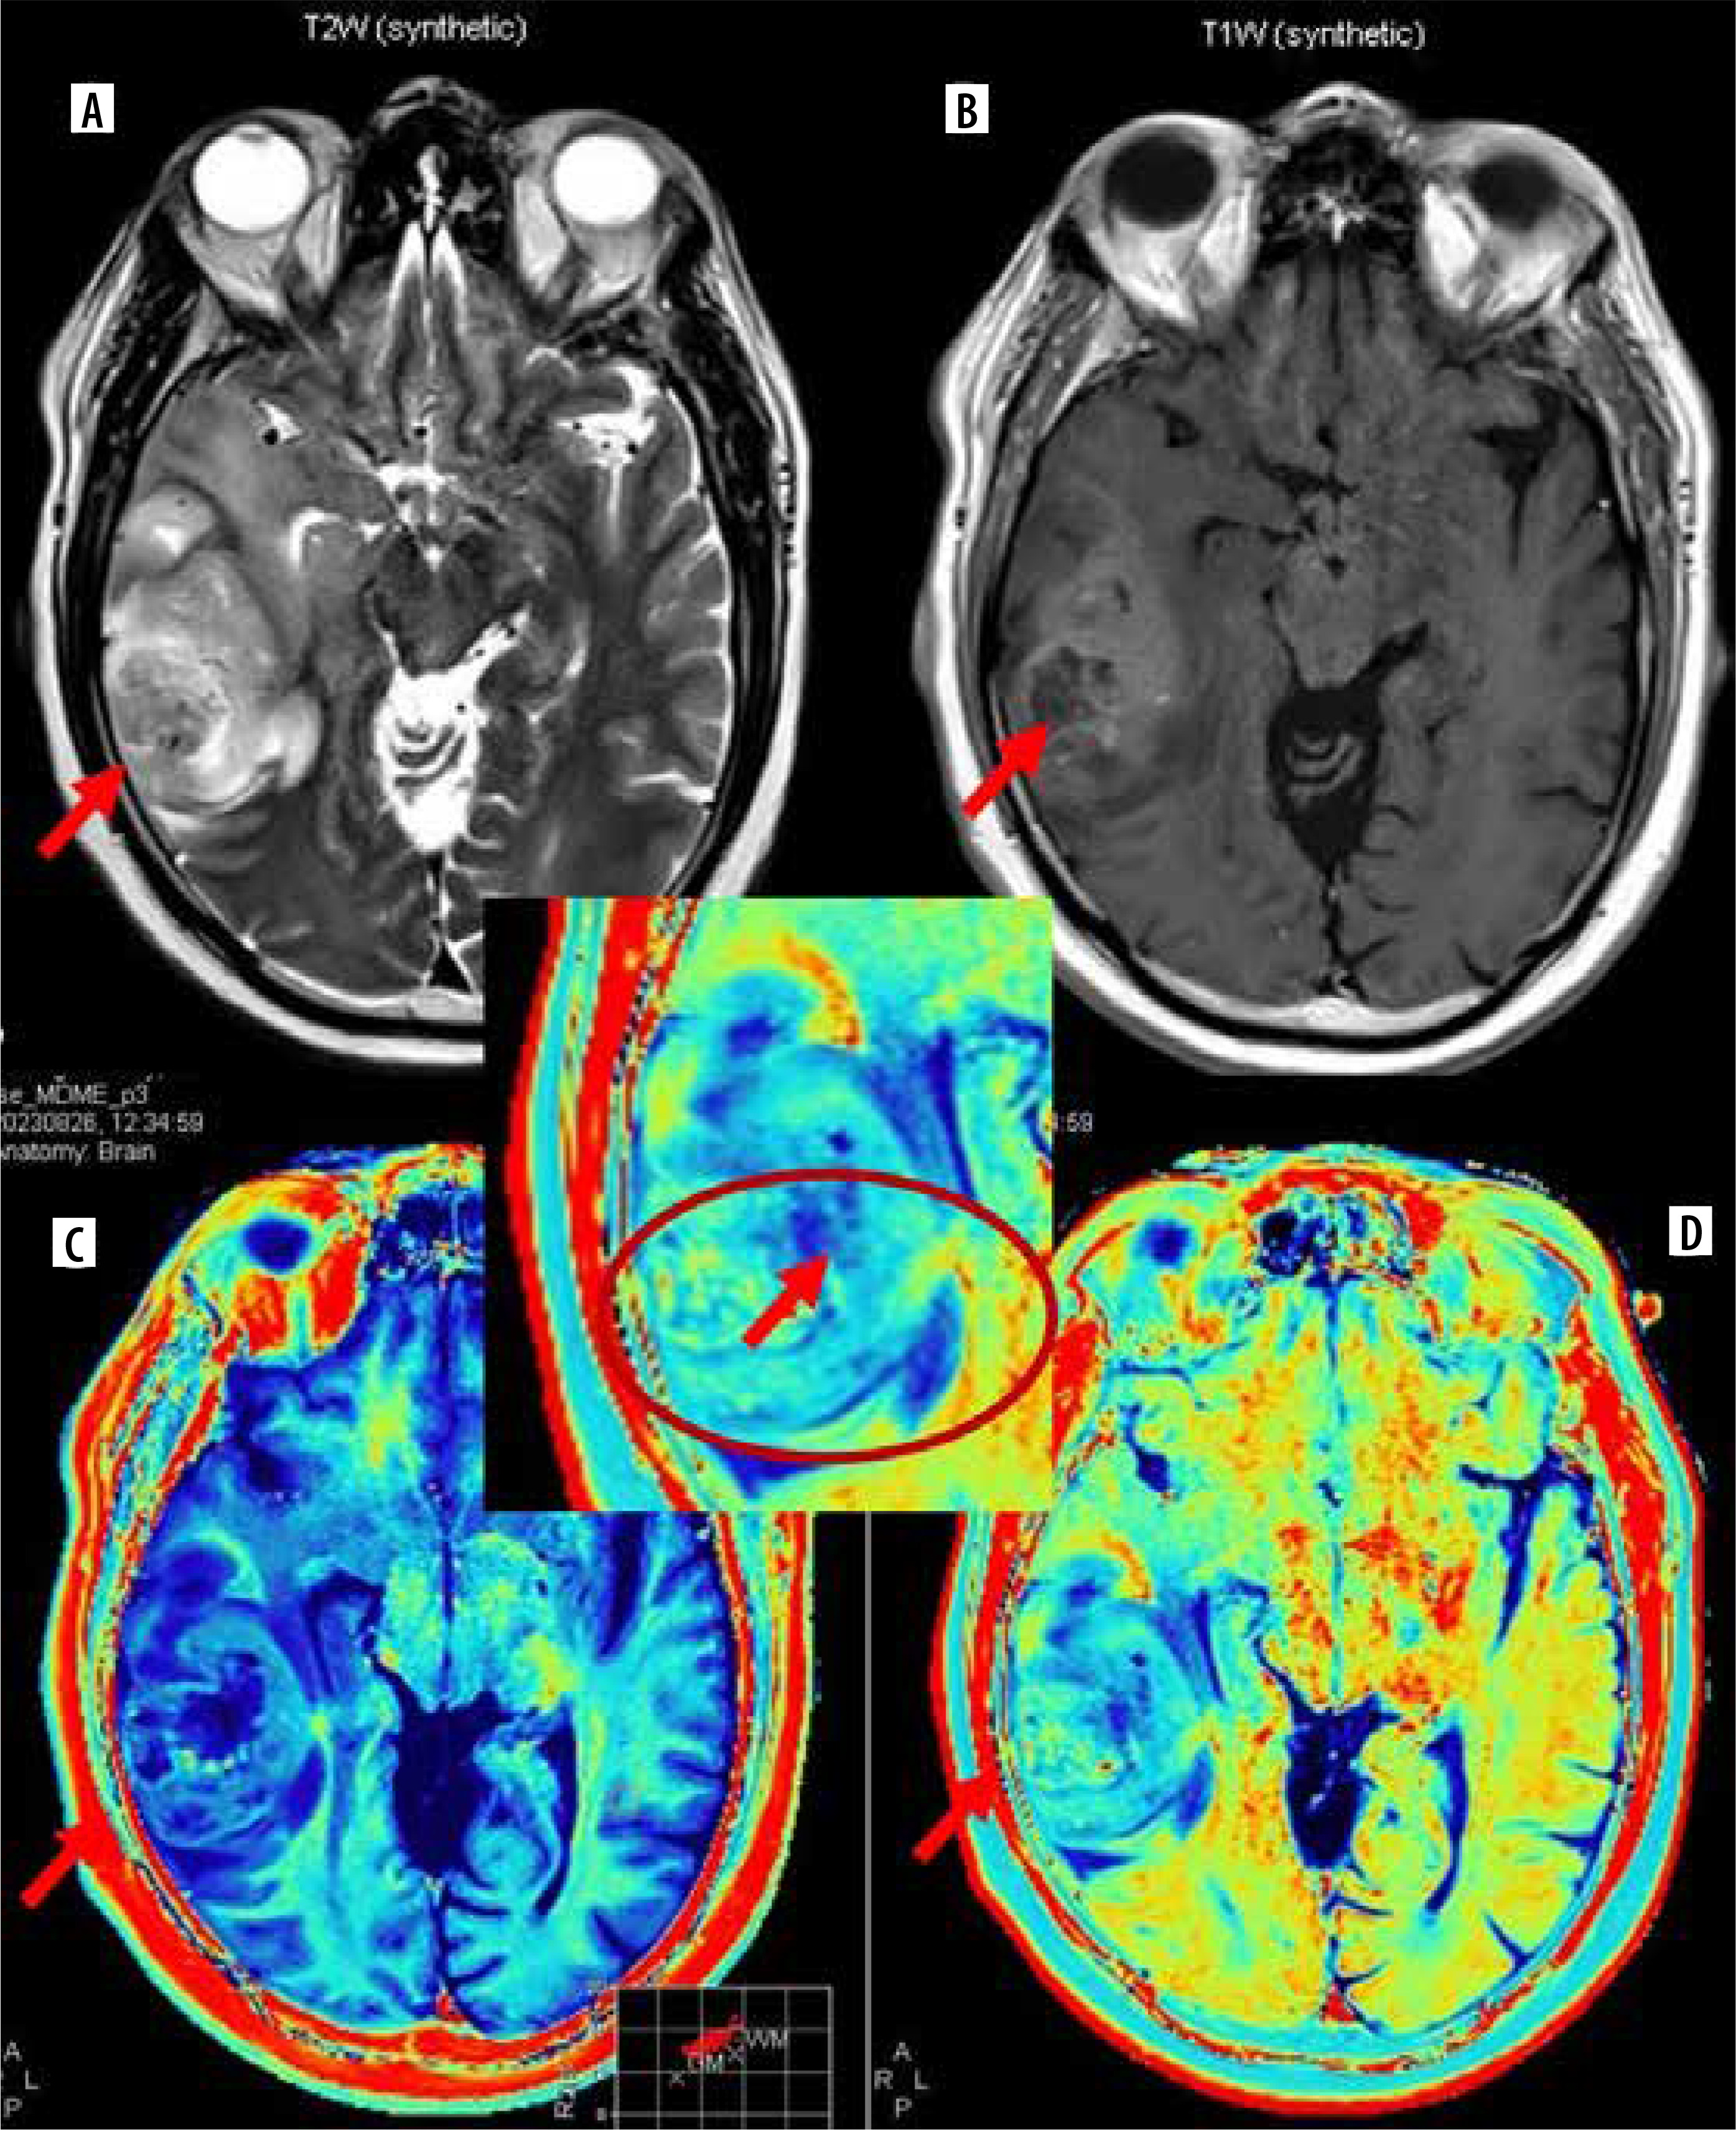
Figure 3
A 56-year-old male presented with headache and sudden loss of consciousness. Synthetic T2W axial image (A), T1 PC axial image (B) and its corresponding post-contrast R1 and R2 relaxometry map (C and D) showing heterogenous lesion with irregular margins in right temporal lobe (red arrows on all images) with perilesional oedema and mass effect s/o high-grade glioma. Postoperative biopsy turned out to be glioblastoma. Magnified inset image of post-contrast R2 relaxometry map clearly demonstrates the infiltrative margins, heterogeneity of wall, and enhancement in perilesional oedema with low R2 values in the core (red arrows in zoomed image)
Analysis of relaxometry parameters from the wall of the lesions (Figure 1, Table 2)
There was no statistically significant difference between the relaxometry parameters from the wall of tuberculoma and glioblastoma in both pre- and post-contrast acquisitions.
Table 2
Comparison of relaxometry parameters across wall of lesions between tuberculoma and glioblastoma
Analysis of relaxometry parameters from the perilesional oedema of the lesions (Figure 1, Table 3)
R1 and R2 relaxation rates were found to be higher in perilesional oedema of glioblastoma compared to tuberculoma, more in the post-contrast R1, R2 values, but the difference was not statistically significant. No significant difference was found in the proton density values from perilesional oedema of the 2 groups.
Table 3
Comparison of relaxometry parameters across perilesional oedema of lesions between tuberculoma and glioblastoma
Table 1, 2, and 3 summarises the findings across core, wall, and perilesional oedema of tuberculoma and glioblastoma.
ROC analysis
ROC analysis was performed to find cut-offs in the relaxometry parameters found to be most significant in differentiating tuberculoma and glioblastoma, i.e. R1 and R2 relaxation rates from the core of the lesions in pre- and post-contrast acquisitions.
These results show perfect discrimination (100% sensitivity and specificity) with the following cutoff values:
R1 Pre-contrast (Core): 0.852,
R2 Pre-contrast (Core): 11.565,
R1 Post-contrast (Core): 0.926,
R2 Post-contrast (Core): 11.890.
Values above these cutoffs indicate tuberculoma, while values below suggest glioblastoma. This indicates that these parameters could be highly reliable diagnostic markers for distinguishing between tuberculoma and glioma.
Discussion
Tuberculomas and primary CNS neoplasms like glioblastoma often present a diagnostic challenge especially when lesions are solitary and in endemic countries like India where tuberculosis is a very common disease entity. Many radiological features have been described in CNS tuberculomas that aid in diagnosis such as conglomeration of rings and T2 low signal intensity in the centre, particularly for caseating tuberculomas. Classical imaging features of the same are T1 iso- to hypointense with hyperintense rim and T2 hypointense centre [4]. However, this is subjective and lacks objective criteria. Relaxometry adds a quantitative value to this and helps in differentiating tuberculomas from other entities with higher diagnostic confidence.
We evaluated the relaxometry parameters such as R1 and R2 relaxation rates and proton density values derived from synthetic MRI in 10 subjects of intracranial tuberculomas and 14 subjects of glioblastoma, which were histopathologically proven. Parameters were analysed from lesion core, wall, and perilesional oedema both pre-and post-contrast administration. A previous study by Kang et al. [5] showed that the relaxation times post-gadolinium administration were time dependent, and they proposed that values increase 10 minutes after injection compared to immediately after injection of the contrast. In our study, we did not perform a time-based measurement; however, all participants in our study followed a fixed scanning protocol in which sequences were acquired in a particular order in all patients; thus, post-contrast MDME sequence was acquired nearly at the same time point after contrast injection in all the patients. A variation across patients due to variable time points of acquisition after contrast injection was thus avoided.
The R1 and R2 relaxation rates were significantly high in the core of tuberculoma compared to glioblastoma. This aligns with the classical description of T2 hypointensity at the centre of caseous tuberculomas. Pathologically, tuberculoma consists of granuloma with epithelioid cells, Langhans giant cells, and peripheral rim of lymphocytes. A combination of factors including fibrosis, gliosis, and macrophage products such as free radicals are responsible for the T2 hypointensity of the caseous part of tuberculomas [6]. A previous study by Jayakumar et al. [7] showed the utility of T2 relaxometry in differentiating cerebral ring enhancing lesions. They suggested a mean T2 relaxation time of 161 ms was seen in tuberculomas, which is significantly low compared to other ring enhancing lesions of the brain. Our results are in agreement with their findings, which suggest a high R2 relaxation rate (inverse of T2 relaxation time) in tuberculomas. Primary neoplasms such as glioblastomas often contain central necrosis, and the core is composed of necrotic tumour cells. The relative difference in the composition of core is reflected in the difference in the relaxation parameters in them between tuberculomas and glioblastomas.
Primary neoplastic lesions like glioblastoma are characterised by their infiltrative nature. The perilesional oedema may not be free of tumour cells and may represent microscopic invasion by the tumour cells [8]. This is reflected by the fact that most gliomas recur at the resection margin [9]. Due to infiltration of peritumoral oedema by the tumour cells, the relaxation parameters behave differently in the peritumoral oedema in glioblastomas compared to tuberculomas where the perilesional oedema is purely composed of vasogenic oedema. This observation supports the many previous studies in glioma literature exploring the peritumoral oedema characters using perfusion or diffusion imaging [10-13].
Relaxometry of the peritumoral area in gliomas showed shorter T2 values compared to non-glial tumours in a study by Oh et al. [14]. Our study shows similar changes with higher R1 and R2 values (and thus a lower T2 relaxation time) in the perilesional oedema of primary neoplasms.
Because of neo angiogenesis in high-grade gliomas the perilesional oedema may show leakage of contrast and thus may show significant changes in relaxation values post-contrast administration. In our study we found a significant increase in R1 and R2 and a decrease in PD after contrast administration in perilesional oedema in glioblastoma compared to tuberculomas. This was keeping with previous study by Blystad et al. [15] who demonstrated using relaxometry maps the peritumoral oedema in malignant gliomas show significant contrast enhancement as detected by post-contrast R1 maps, which they attributed to infiltrative nature of the tumour. Muller et al. [16] also showed similar changes and used the cloudy contrast enhancement in peritumoral oedema of glioblastoma using quantitative T1 mapping for prognostication.
Post-contrast administration, however, was not very useful in the core, where post-pre contrast values did not show significant change between the 2 groups. There was no significant difference in the relaxometry parameters from the wall of the lesions between tuberculoma and glioblastoma.
Thus, the core is the most important to distinguish between these 2 entities followed by perilesional oedema, which showed a difference in relaxometry values between tuberculoma and glioblastoma. A pre-contrast R1 value of > 0.852 and R2 value of > 11.565 in the core strongly suggest tuberculoma over glioblastoma.
In our previous work we established the usefulness of synthetic MRI-derived relaxometry parameters in characterising various cerebral ring-enhancing lesions into infective, primary neoplastic and secondary neoplastic (metastatic) lesions [17]. This research is further deepening and detailing the topic, which suggests the utility of synthetic relaxometry in distinguishing 2 important entities, i.e. tuberculoma and glioblastoma based on pre- and post-contrast R1 and R2 cut-offs. However, relaxometry values should not be considered in isolation for definitive diagnosis of these entities and should always be interpreted in correlation with other morphological and functional inputs from a radiologist. A major limitation of this study is the limited sample size and lack of correlation of relaxometry data with other structural and functional imaging findings.
Conclusions
Synthetic MR-based relaxometry parameters can be useful in distinguishing tuberculomas from primary neoplastic lesions such as glioblastoma. R1 and R2 relaxation rates from the core of the lesions are most important in distinguishing the 2, with an R1 value of > 0.852 and an R2 value of > 11.565 from the core strongly suggesting tuberculoma over glioblastoma. Similarly, high R1 and R2 relaxation rates can be seen in perilesional oedema of glioblastoma due to the infiltrative nature of the lesions. This was a preliminary study with limited sample size. Given the promising results, future work in this regard may be directed with larger sample size and correlation of the relaxometry parameters with other structural and functional neuroimaging findings.