

Introduction
Pneumothorax is the most frequent complication of computed tomography (CT)-guided lung biopsies, with reported incidence rates varying widely between 8% and 69%, depending on patient populations, procedural factors and sensitivity of the detection rate [1-7]. It occurs when air enters the pleural space, often due to alveolar rupture or trauma to the thoracic wall, disrupting the pleural pressure that normally keeps the lung inflated and leading to partial or complete lung collapse [4,7]. While many pneumothoraces are minor, asymptomatic, and resolve spontaneously, larger cases are observed in 5-15% of patients, frequently necessitating chest drainage, additional imaging, or hospital admission. These more severe instances not only elevate patient risk but also increase healthcare costs by up to 300-400%, highlighting the need for preventive strategies and optimized procedural techniques [6,8-11].
Most existing studies on CT-guided lung biopsies have focused on post-biopsy management strategies [e.g. 5,11], with only a few addressing pre-biopsy measures [11-15]. Among these, even fewer have explored methods to indirectly influence pleural pressure to prevent the onset or progression of pneumothorax. Pleural pressure is influenced not only by the gravitational effect of the lung’s own weight but also likely by potential shape mismatches between the lung and rib cage [16] and by surrounding structures such as the abdomen [17]. However, the specific contributions of these factors to overall intrapleural pressure remain inconsistent, with findings largely derived from animal studies [e.g. 18].
Research on primary spontaneous pneumothorax (PSP) has established an association between thoracic morphology and pneumothorax risk. Studies have shown that PSP patients tend to be taller and have a lower body mass index (BMI) compared to the general population [19], with two clinical studies suggesting a higher incidence of pneumothorax in tall, thin individuals [20,21]. Moreover, PSP patients exhibit significantly greater lung heights relative to body height (BH) and chest width (W) [22], as well as flatter thoraxes compared to controls [23].
Despite these insights, the relevance of such factors in the context of CT-guided lung biopsies remains unexplored. Addressing this research gap is of significant clinical importance, as a detailed analysis of pre-interventional imaging could enable more targeted risk stratification and the identification of preventive factors to mitigate the most common complication of these procedures. This study aimed to investigate whether body composition and thoracic morphology parameters could serve as predictors of pneumothorax risk in patients undergoing CT-guided lung biopsies.
Material and methods
Study population
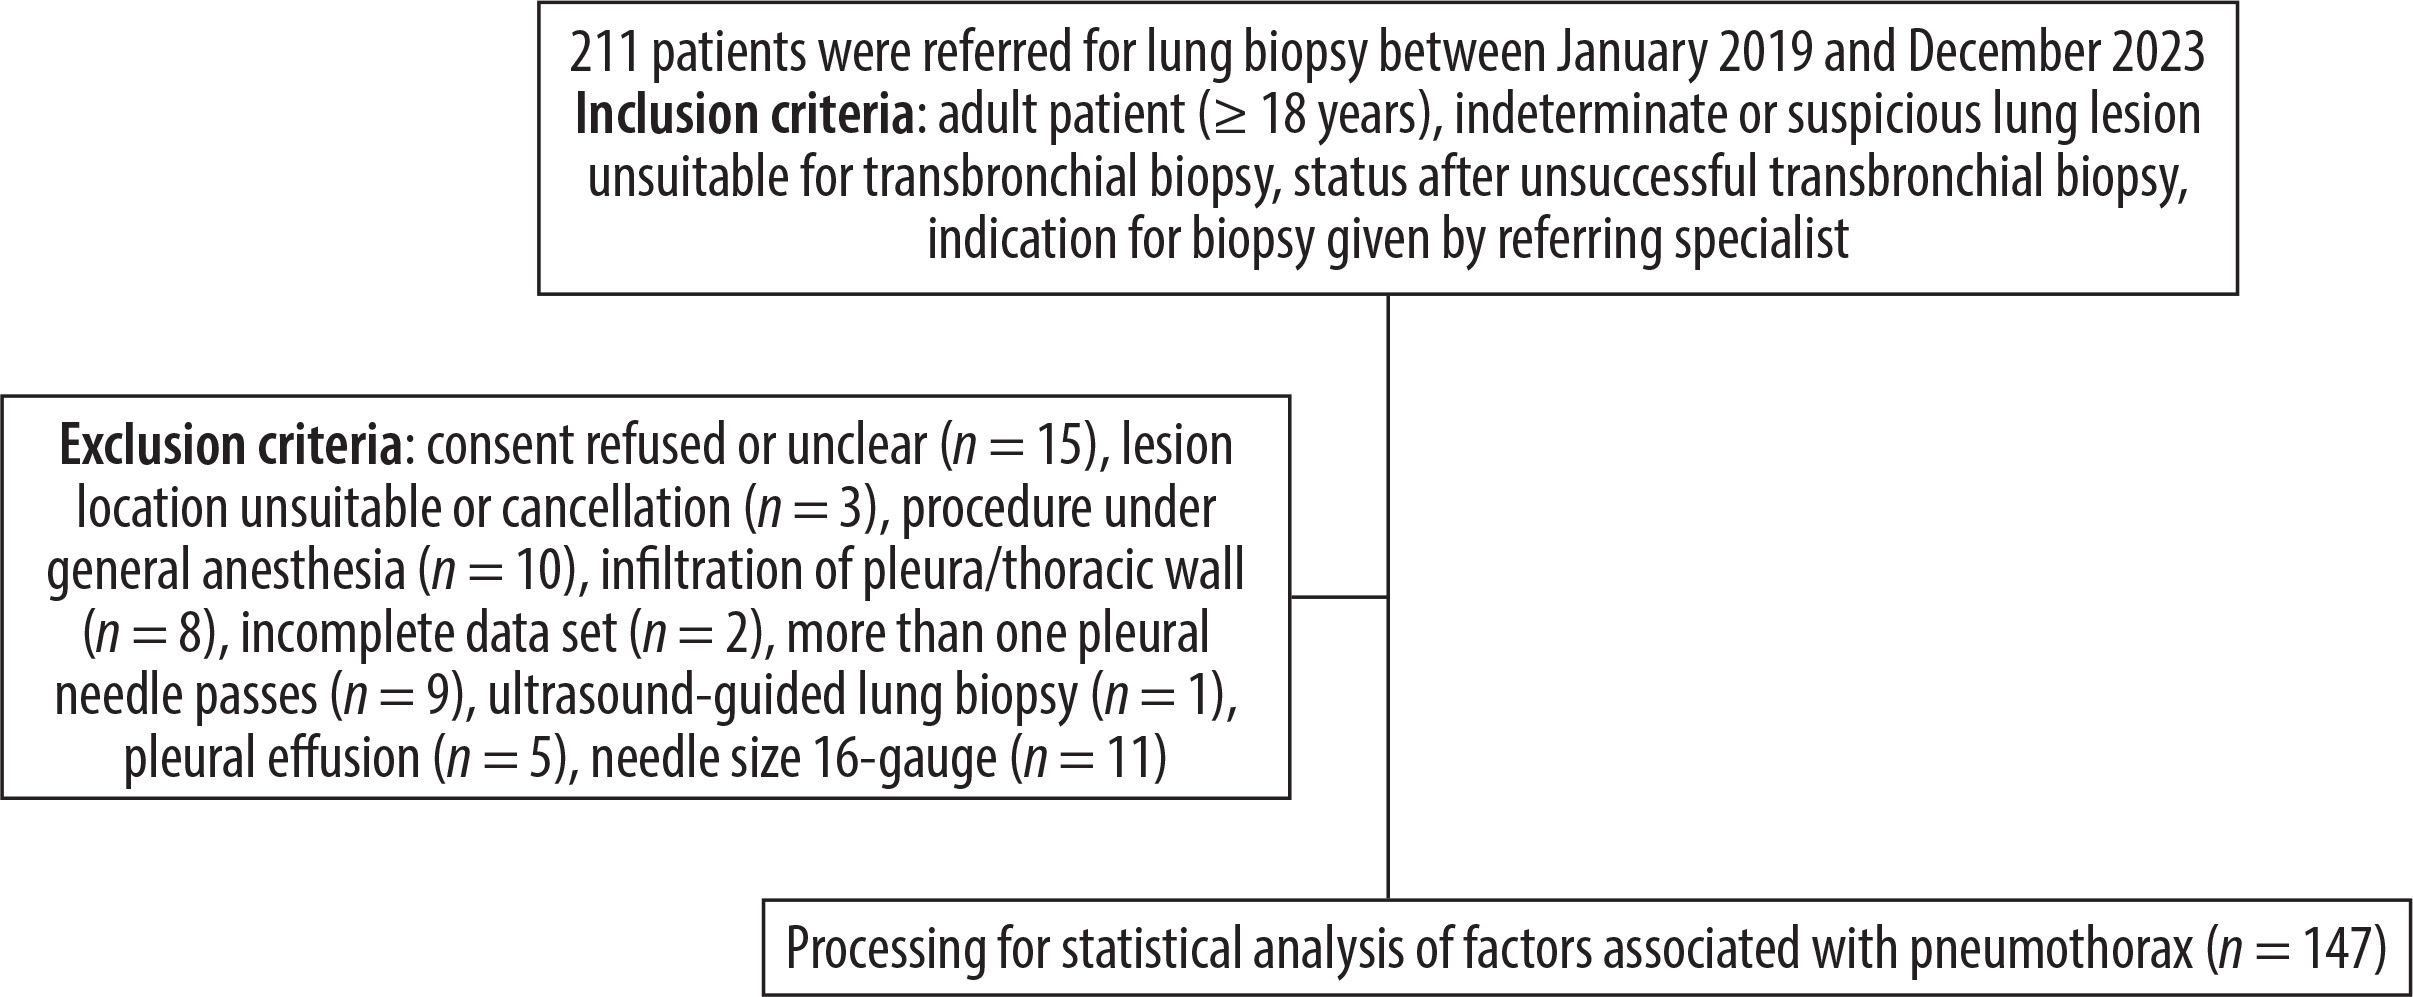
This study retrospectively analyzed 211 percutaneous CT-guided lung biopsies performed at our university hospital between January 2019 and December 2023. Exclusion criteria were implemented to reduce potential bias arising from abnormal pleural cavity physiology, such as infiltration or effusion [13]. Biopsies using a 16-gauge (G) needle were excluded due to the limited sample size, which could compromise result reliability. Cases involving multiple pleural passages were also excluded, given the well-established increased pneumothorax risk associated with this technique [1]. Additionally, procedures conducted under general anesthesia were omitted, as ventilation alters pleural pressure, and the absence of recorded ventilation modes could introduce confounding variables (Figure 1) [24].
Baseline evaluation and biopsy technique
All patients underwent baseline evaluations, including medical history review and blood tests (International Normalized Ratio below 1.5 or a Quick value above 60%, a hemoglobin level above 80 g/l, and a platelet count exceeding 50 × 10⁹/l), with results no older than five days. Antithrombotic medications were adjusted according to established guidelines: non-steroidal anti-inflammatory drugs and clopidogrel were discontinued 5 days before the procedure, heparin 6 hours before, rivaroxaban 1 day prior, and both dabigatran and edoxaban 3 days before. The lung biopsies were performed by four experienced interventional radiologists, each with 7 to over 10 years of expertise, using CT guidance with a Toshiba Asteion 4SL scanner. A 17- or 19-G coaxial needle was utilized in combination with an 18- or 20-G semiautomated biopsy system (SemiCut side-cutting system for 18-G; Medical Devices Lease S.A., Zug, Switzerland, or CorVocet full-core system; Merit Medical Systems, Utah, USA). Biopsy planning relied on a non-contrast chest CT with 1-mm reconstruction increments, adhering to the gold standard for optimal needle path planning. Special attention was paid to avoiding crossing pulmonary vessels and fissures. Patient positioning was based on the interventionalist’s discretion. Local anesthesia (1% lidocaine, max 20 ml) was used. No breathing instructions were given to prevent hyperventilation. Needles were withdrawn without sealing agents post-sampling. Follow-up CT scans were taken immediately and after five minutes. Progressive pneumothoraces were treated with Safe-T-Centesis drains (6 or 8 French). Patients were monitored for four hours and discharged if stable. Non-progressive pneumothoraces underwent a six-hour follow-up chest X-ray, with overnight admission for pneumothoraces > 2 cm.
Differentiation between access route in dependent and non-dependent lung areas and assessment of pneumothorax
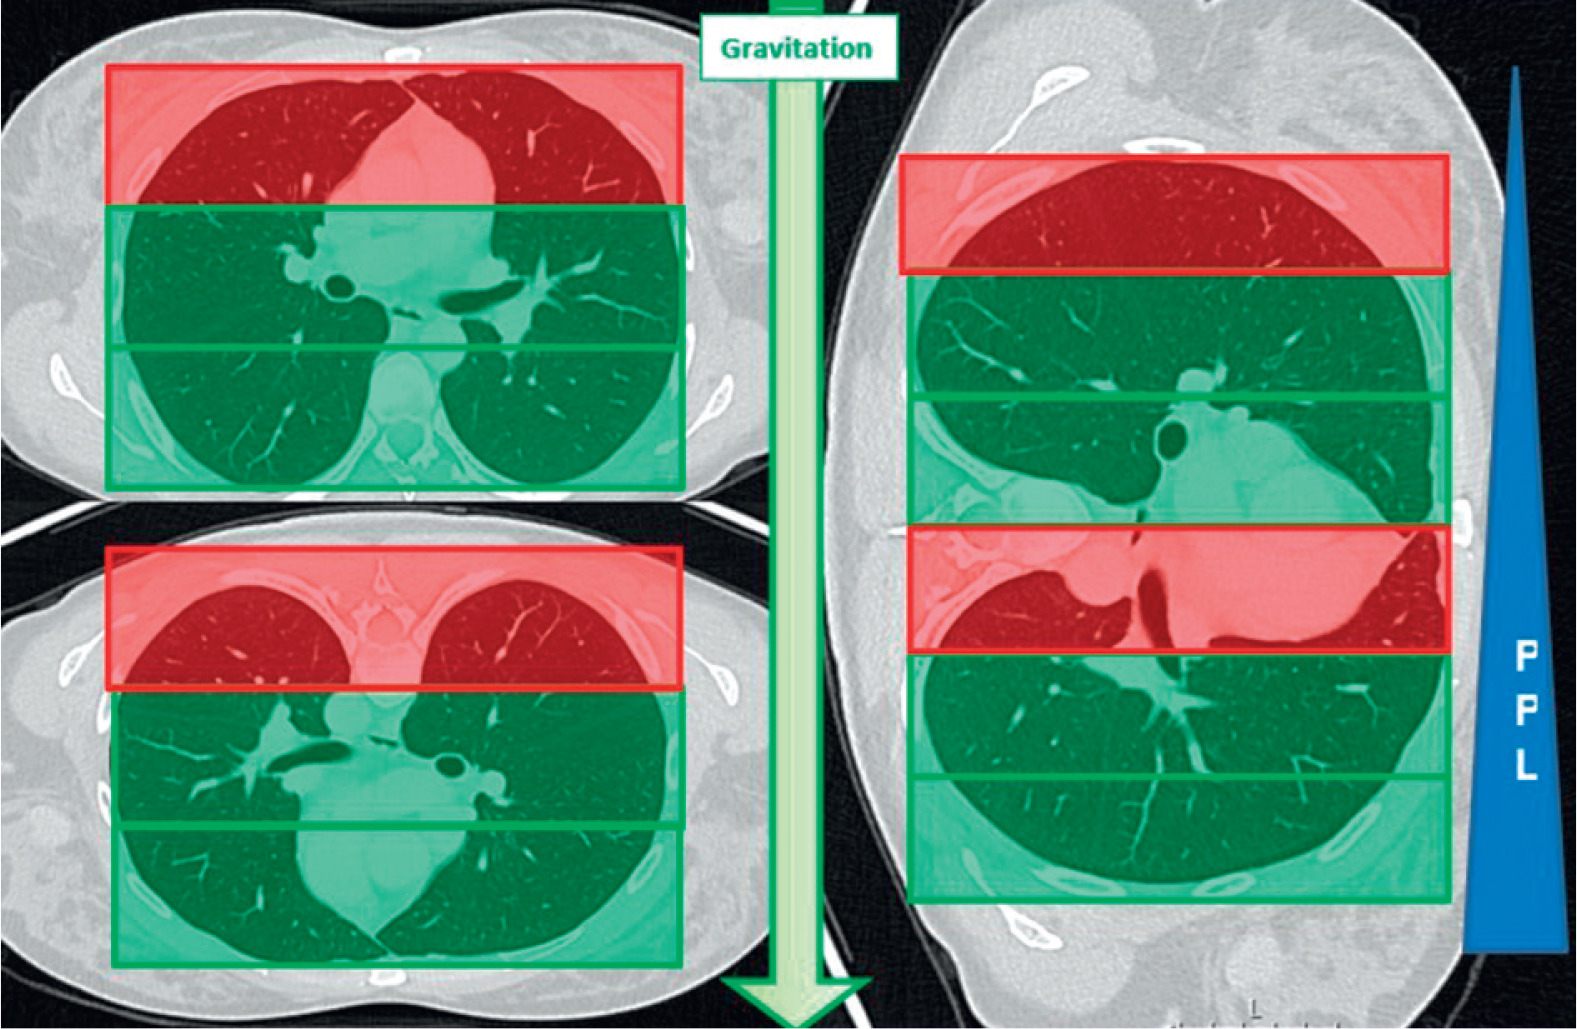
Axial planning CT images were divided into three equal thirds. The upper third represented the non-dependent lung area. The remaining two thirds were defined as dependent areas. Pneumothorax was assessed on immediate post biopsy CT scans as a binary variable (Figure 2).
Assessment of body shape and thoracic morphology measurements
The BMI was used to assess body composition [25]. It was recorded as an absolute value and categorized according to the universally accepted classification: underweight = BMI < 18.5, normal weight = BMI 18.5-24.9, overweight = BMI 25-29.9, obesity grade I = BMI 30-34.9, grade II = BMI 35-39, and grade III = BMI ≥ 40. To give greater significance to height in the overall context, patients’ heights were compared to the average, gender-adjusted height of the Swiss population (men: 177 cm; women: 164.6 cm) [26]. Heights were then categorized into binary variables: above average height (AAH) and under average height (UAH).
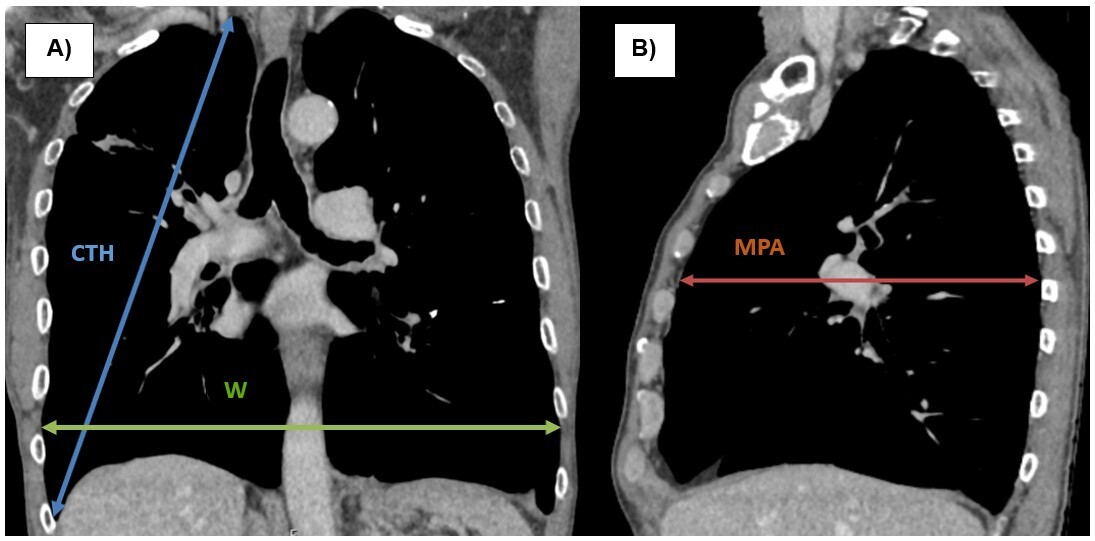
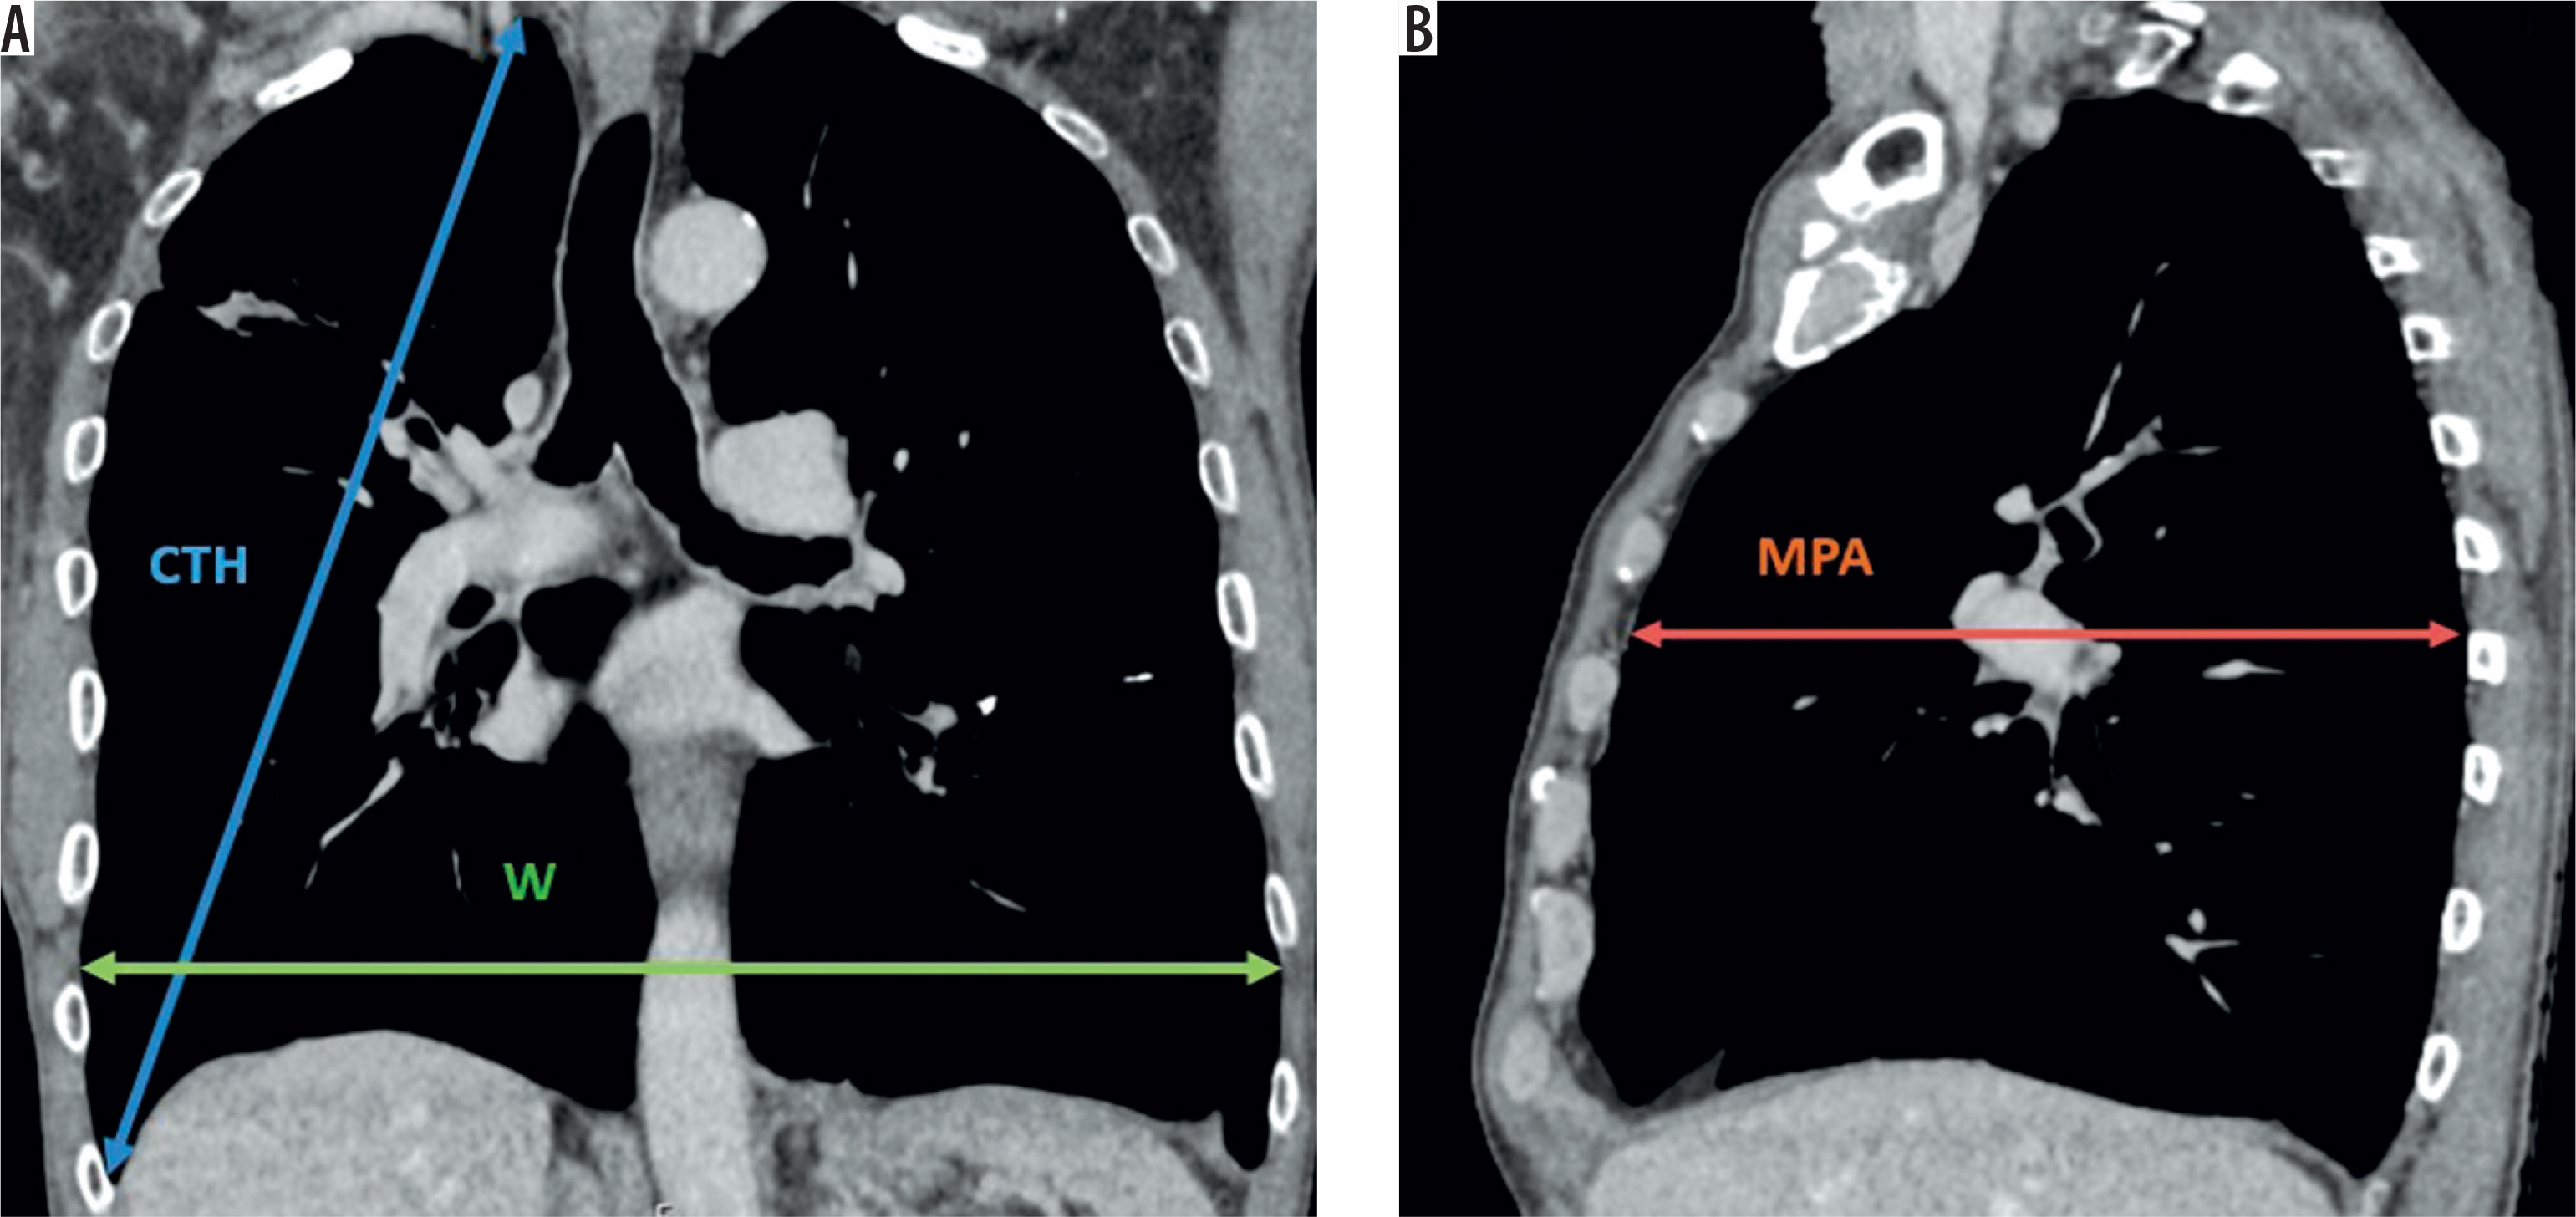
Measurements of the thorax dimensions, including chest height (CTH), W, and the maximum postero-anterior (MPA) distance, were conducted on pre-biopsy diagnostic chest CT scans with 1 mm reconstruction increments using multiplanar reconstruction in the coronal and sagittal planes. Unlike previous studies that relied on topograms or X-ray images [e.g. 20,21], this method aimed to enhance accuracy and validity by minimizing measurement errors caused by overlapping structures. Based on the findings of Kawakami et al. [22], three ratios were calculated: CTH/BH, CTH/MPA, and CTH/W (Figure 3).
Figure 3
Measurement of chest wall dimensions on pre-biopsy thoracic computed tomography. (A) Coronal reconstruction of the thorax: following Chang et al. [21], chest height (CTH) was defined as the distance between the lung apex and the costophrenic angle (indicated by the blue double arrow). Maximum chest width (W) was defined as a strictly horizontal line (green double arrow). (B) Sagittal reconstruction of the thorax: the maximum posteroanterior (MPA) distance was defined according to Peters et al. [20] (red double arrow). All distances are expressed in millimeters
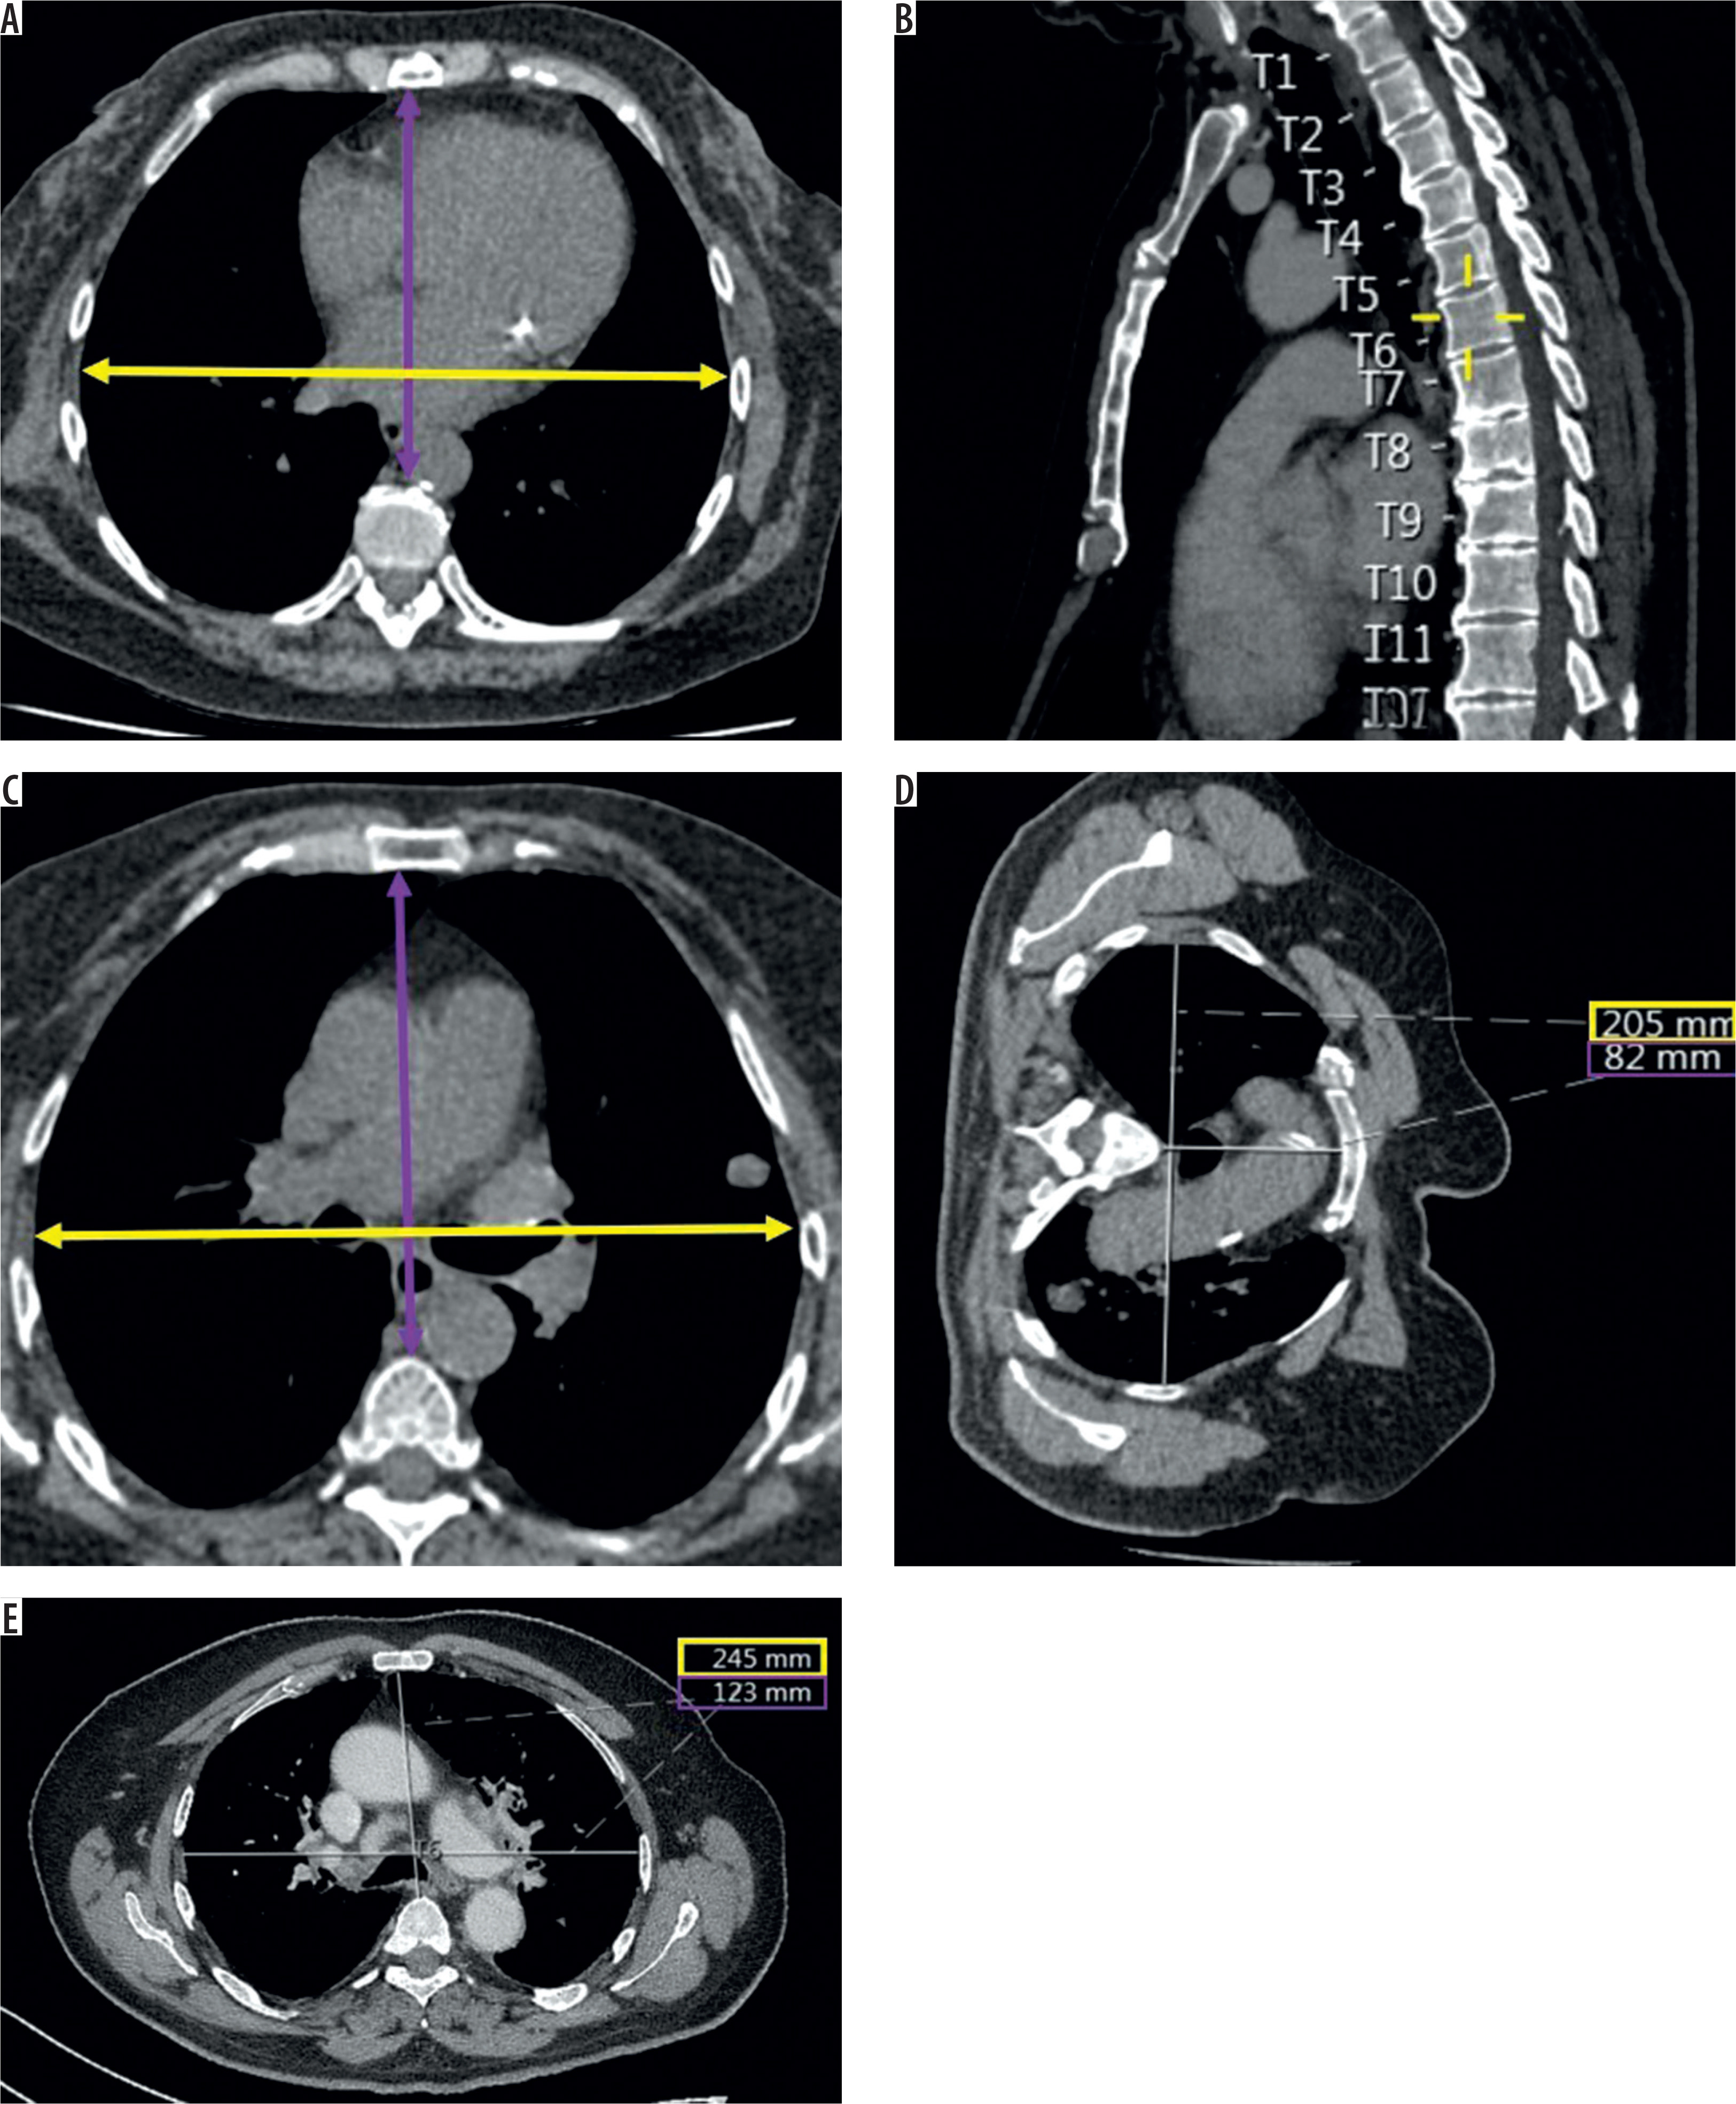
Additionally, the widely accepted CT Haller index (HI), used to assess chest cage deformities, was calculated as the ratio between the maximum transverse (T) diameter and the minimum anteroposterior (AP) distance in millimeters. To ensure consistency and minimize variability, measurements were taken between T6 and T10 [27,28]. A second set of measurements was performed at the lesion level to account for the effects of targeted positioning during lung biopsy, which can alter chest cage dynamics and impact the HI [29]. This also represents the area where the strongest forces act due to pleural penetration. These lesion-specific measurements were obtained from the interventional CT scans (Figure 4). In addition to continuous measurement values, the presence of a pectus excavatum was categorized using a CT HI of ≥ 2 [28].
Figure 4
Measurements of the computed tomography (CT) Haller index (HI). (A) Regular measurement on pre-biopsy thoracic CT. The HI is calculated by dividing the T diameter of the chest by the AP distance on an axial chest CT slice, specifically at the level where the distance between the anterior surface of the vertebral body and the posterior surface of the sternum is smallest [27,28]. (B) The HI was measured between T6 and T10, as measurements at this level show minimal variance [30]. (C, D) Second measurements were taken at the level of the target lesion on the interventional CT images. (D, E) The same patient demonstrated mild pectus excavatum with a HI of 2.5 (≥ 2) in the lateral decubitus position, while in the supine position, no pectus excavatum was observed (HI of 1.79)
Haller index = maximum transverse (T) diameter/minimum anteroposterior (AP)
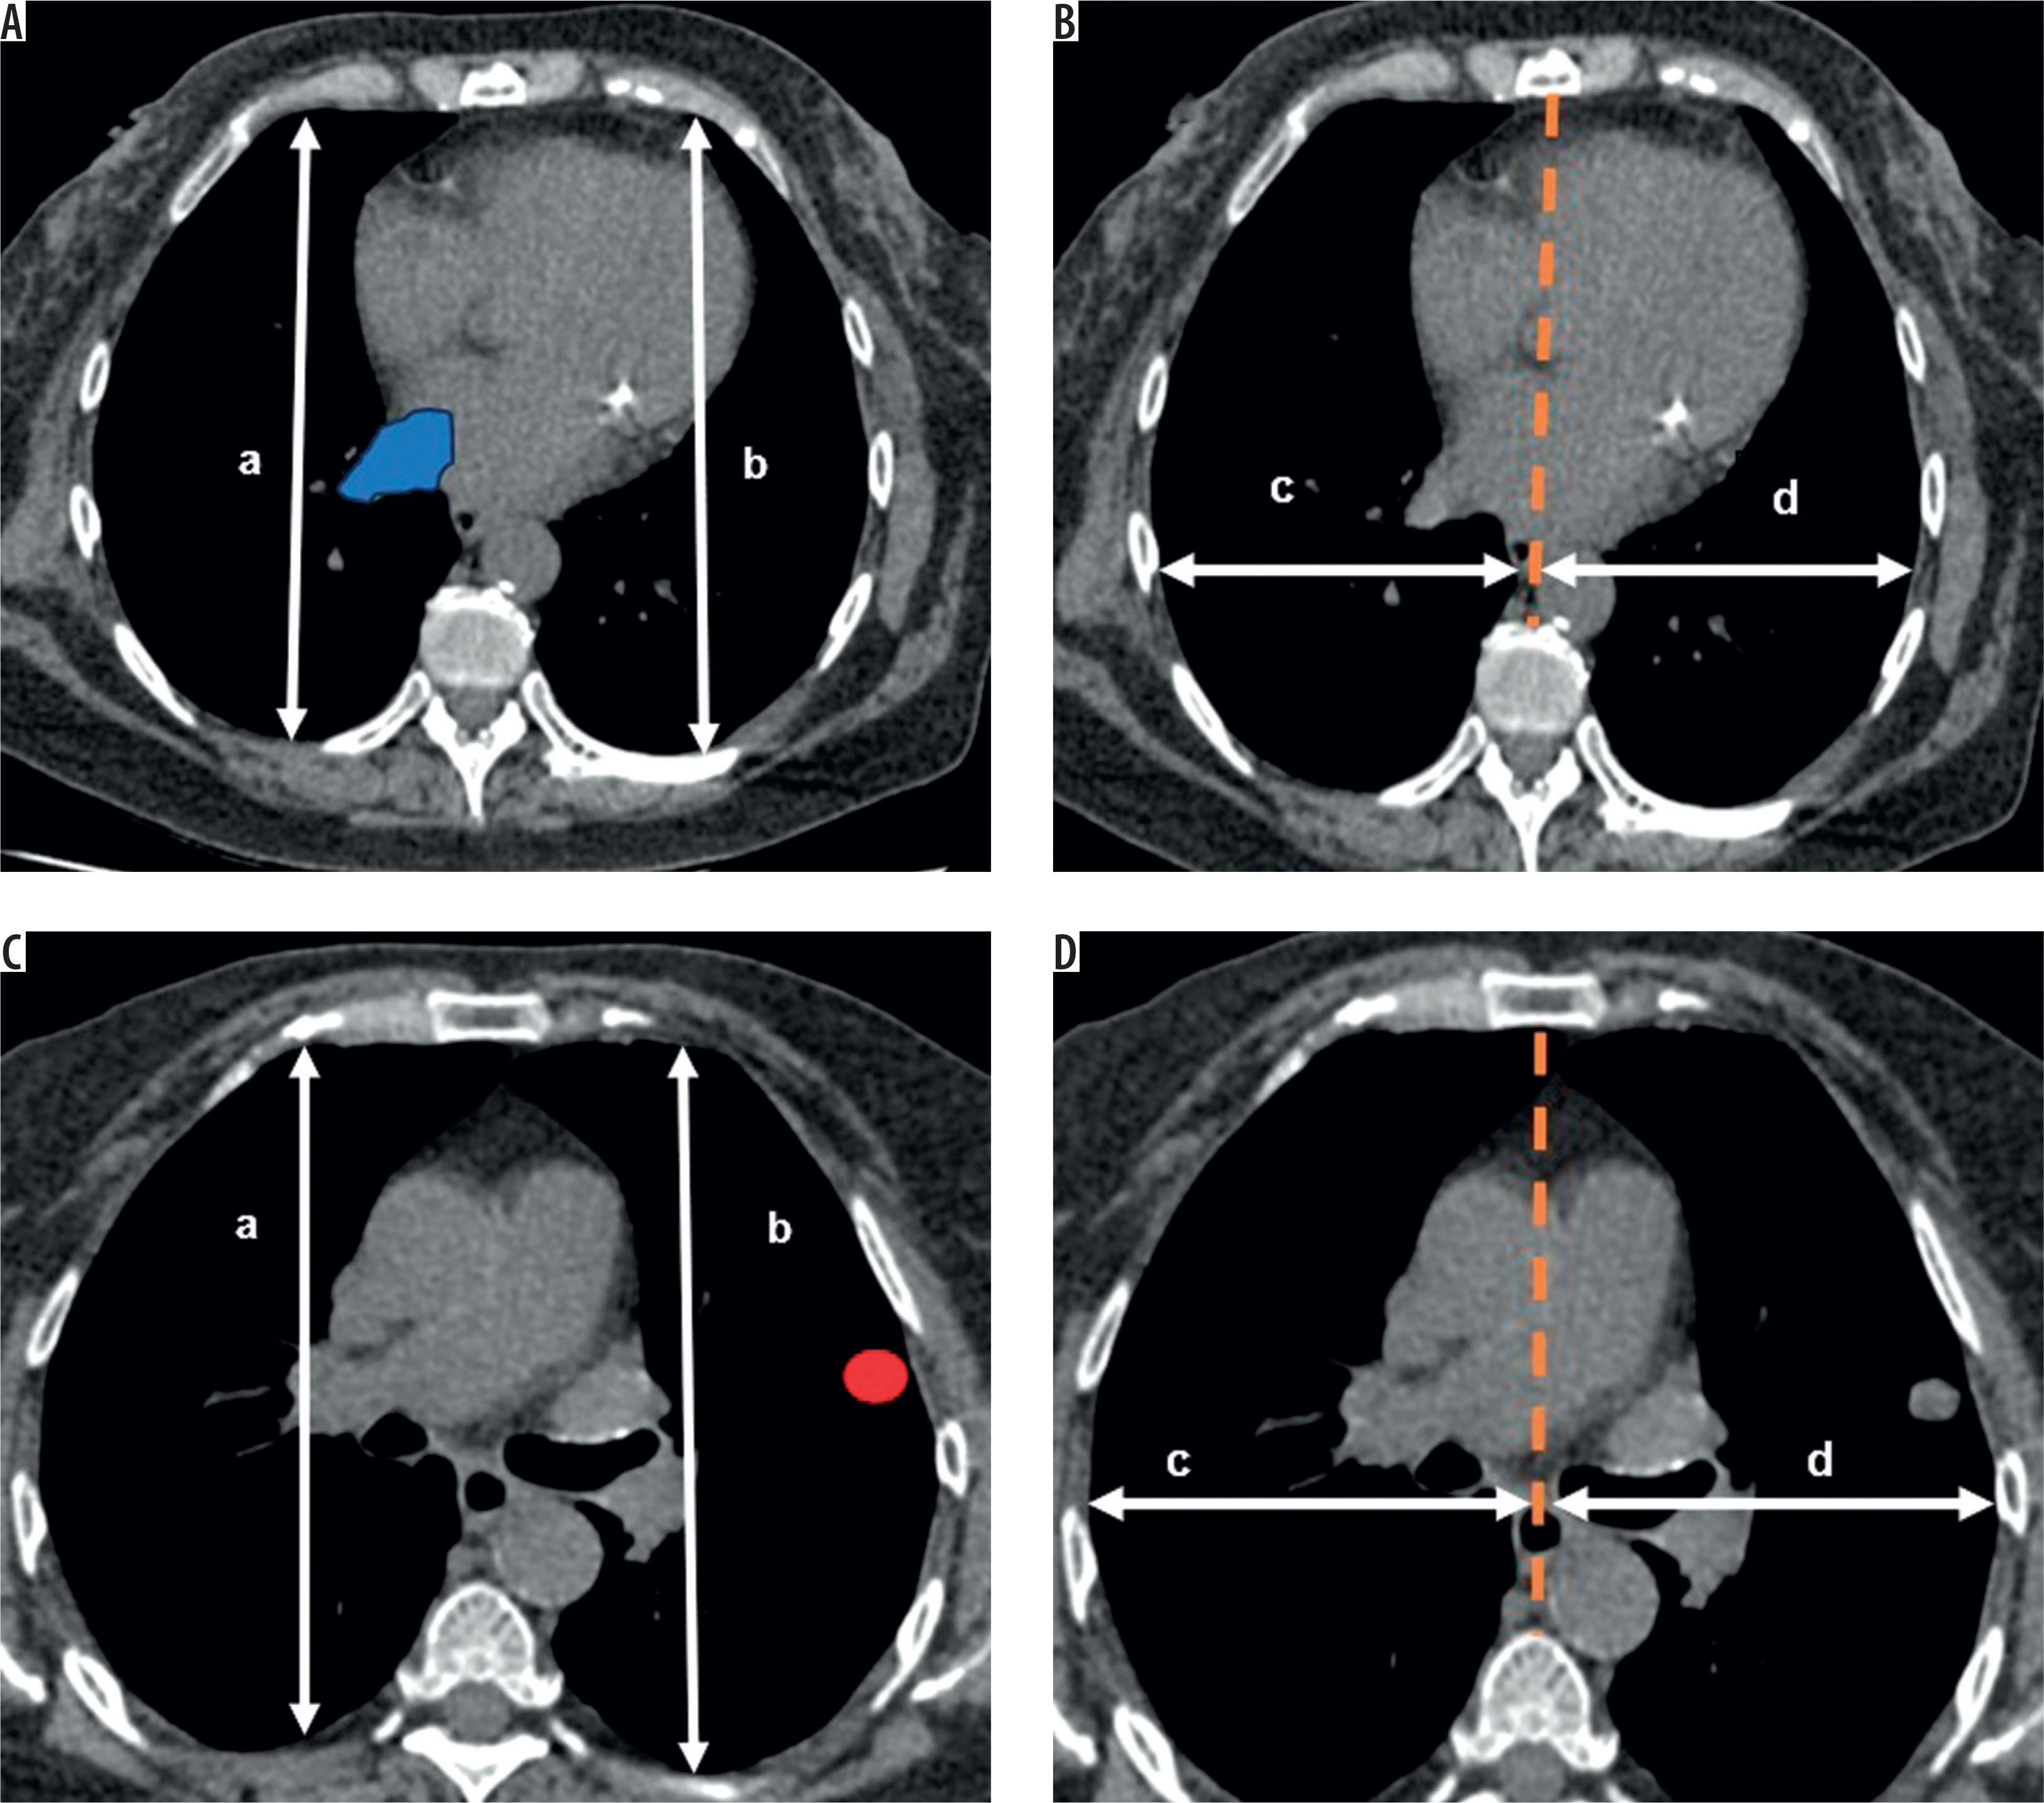
To assess chest wall deformities such as side asymmetry and flatness, bilateral diameters were measured for each patient. These included the AP distances (a and b) and T distances (c and d) at two predetermined levels: the level of the right inferior pulmonary vein and the lesion level. The choice of the former was based on findings by Saita et al. [23], who identified the most significant differences between patients with PSP (control group and those with Marfan syndrome) at this specific level. Asymmetry was assessed using the ratios of right/left AP and right/left T diameters, while flatness was evaluated using the AP/T ratio. For T measurements, the distance from the center of the vertebra to the midline of the posterior surface of the sternum was recorded. The longest AP and the widest T distances of each hemithorax were noted. Asymmetry was calculated using the following formula: asymmetry = (diameter on longer side – diameter on shorter side)/diameter on longer side. Both AP asymmetry and T asymmetry were derived using this method. Flatness for each hemithorax was determined as follows: flatness = AP diameter/T diameter (on the same side) (Figure 5).
Figure 5
Chest wall deformity measurements. Calculations include anteroposterior (AP) and transverse (T) asymmetry, as well as hemithorax flatness (F – only at the target lesion site). A dashed line extending from the midline of the vertebral body to the midline of the posterior surface of the sternum divides the thorax into two halves. (A, B) Measurements taken at the level of the right inferior pulmonary vein (anatomical landmark; blue in A) on pre-biopsy thoracic computed tomography (CT). (C, D) Measurements at the level of the target lesion (red in C) on the interventional CT images
All distances are expressed in millimeters; a and b – maximum AP distances; c and d – maximum T distances.
AP asymmetry = (a – b)/max(a, b)
T asymmetry = (c – d)/max(c, d)
F = b/d (in this example)
Data collection
All procedures were evaluated by a board-certified interventional radiologist with nine years of experience and a radiology resident with three years of experience. Both reviewers were blinded to the patient’s medical history and did not participate in the interventions. The interventional images were analyzed using Sectra Workstation software (Model IDS7, Version 24.2, Patch 4/2022; Sectra AB, Linköping, Sweden). The following variables were recorded: patient demographics; biopsy positioning; lesion size and location; access route (AR) according to our zone classification; BMI classification; height; weight; AAH (gender adjusted, GA); UAH (GA); thoracic morphology parameters, including CTH/BH ratio, CTH/MPA ratio, and CTH/W ratio; HI; pectus excavatum, pectus excavatum at the level of the target lesion (PEL); AP asymmetry at anatomical reference level; transverse asymmetry at the anatomical reference level, defined as the level of the inferior pulmonary vein (TAA); flatness of the hemithorax at the anatomical reference level; AP asymmetry at the level of the lesion; T asymmetry at the level of the lesion; flatness of the hemithorax at the level of the lesion; visual evaluation for the presence of generalized emphysema; distances from skin to the lesion (along needle pathway) and from the pleura to the lesion; biopsy angle; needle size; biopsy system; number of samples; procedure time (time difference in minutes from first CT image to first control CT scan after biopsy); and the name of the interventionalist performing the procedure. Histological results from the target lesion and the patient’s post-intervention history were retrospectively gathered from the electronic medical record. All metric measurements were in millimeters.
Statistical analysis
All statistical analyses were conducted using IBM SPSS Statistics for Windows, version 28 (IBM, Armonk, NY). Univariate analyses were performed using chi-square and Fisher’s exact tests for categorical variables and the Mann-Whitney U test for continuous variables. Statistical significance was determined with a two-sided p-value threshold of < 0.05. Normality of distribution was assessed using the Kolmogorov-Smirnov test. Optimal thresholds from receiver operating characteristic analyses were identified using the Youden index. Correlations between variables were analyzed using Spearman’s correlation for continuous variables and contingency coefficients for categorical variables. The phi coefficient was calculated for categorical data, while Pearson’s correlation coefficient was used for continuous variables to determine effect sizes. For highly correlated variables, only the variable with the largest effect size was included in the logistic regression model to avoid redundancy. Binomial logistic regression was employed to identify potential confounders and risk factors for pneumothorax. The Hosmer-Lemeshow test was used to assess model fit. To minimize overfitting, we adhered to the “rule of ten”, limiting the inclusion to seven independent variables based on their significance, while ensuring a minimum sample size of n ≥ 25 for categorical predictors.
Results
Study population
A total of 147 biopsies met the inclusion criteria, with a mean patient age of 66.24 ±13.13 years (range 18-89 years). The cohort consisted of 87 men (59%) and 60 women (41%). Among the biopsied lung nodules, 66% were malignant, predominantly metastases, while approximately one-third were primary lung tumors. The remaining 31% consisted of benign nodules. Non-diagnostic results were observed in only 3% of cases. There were no significant differences between groups for variables such as age, sex, lesion size, lesion location, number of samples, biopsy angle, procedure time, or distances from skin-to-lesion and pleura-to-lesion (Table 1A).
Table 1A
Univariate analysis of patient demographics and interventional parameters. Unless stated otherwise, data are mean ± standard deviation. Chi-square (χ2), Fisher’s exact test, and the Mann-Whitney U test were used to assess differences between groups for categorical, dichotomous, and continuous variables, respectively. N = 147
| Survey of lung biopsies | |||||||
|---|---|---|---|---|---|---|---|
| Parameter | All | No pneumothorax (n = 72) | Pneumothorax (n = 75) | p-value | φ | CC/SC | PC |
| Female, n (%) | 60 (41) | 35 (49) | 25 (33) | 0.067 | |||
| Age (years), mean ± SD | 66.24 ± 13.126 | 64.90 ± 14.789 | 67.53 ± 11.254 | 0.374 | |||
| Lesion size (mm), mean ± SD | 25.18 ± 14.884 | 26.39 ± 15.644 | 24.03 ± 14.125 | 0.322 | |||
| Patient position, n (%) | 0.021* | 0.231 | < 0.001* | ||||
| Supine | 44 (30) | 14 (19) | 30 (40) | ||||
| LD | 58 (39) | 31 (43) | 27 (36) | ||||
| Prone | 45 (31) | 27 (38) | 18 (24) | 0.012* | 0.211 | < 0.001* | |
| Lesion location, n (%) | |||||||
| UL | 70 (48) | 35 (49) | 35 (47 | 0.286 | |||
| LL/ML/L | 77 (52) | 37 (51) | 40 (53) | ||||
| Access route in dependent area, n (%) | 66 (45) | 47 (65) | 19 (25) | < 0.001* | –0.401 | ||
| BMI classification, n (%) | 0.037* | 0.211 | < 0.001* | ||||
| UW/NW | 90 (61) | 39 (54) | 51 (68) | ||||
| Overweight | 37 (25) | 18 (25) | 19 (25) | ||||
| Obesity I-III | 20 (14) | 15 (21) | 5 (7) | 0.016* | –0.207 | < 0.001* | |
| BMI ≥ 27.5 | 35 (24) | 26 (36) | 9 (12) | < 0.001* | –0.283 | ||
| BMI value, mean ± SD | 24.64 ± 4.639 | 25.54 ± 5.347 | 23.77 ± 3.673 | ||||
| Height (m), mean ± SD | 1.70 ± 0.089 | 1.70 ± 0.091 | 1.71 ± 0.088 | 0.573 | |||
| Weight (kg), mean ± SD | 71.64 ± 14.333 | 73.88 ± 16.130 | 69.49 ± 12.087 | ||||
| AAH (GA), n (%) | 43 (29) | 25 (35) | 18 (24) | 0.204 | |||
| UAH (GA), n (%) | 80 (54) | 40 (56) | 40 (53) | 0.869 | |||
| Thoracic morphology measurements | |||||||
| CTH/BH, mean ± SD | 14.68 ± 0.015 | 14.75 ± 0.016 | 14.59 ± 0.015 | 0.748 | |||
| CTH/MPA, mean ± SD | 135.15 ± 0.180 | 137.86 ± 0.010 | 132.55 ± 0.165 | 0.117 | |||
| CTH/W, mean ± SD | 89.54 ± 11.169 | 90.07 ± 11.520 | 89.04 ± 10.873 | 0.748 | |||
| Haller index, mean ± SD | 2.13 ± 0.388 | 2.17 ± 0.388 | 2.09 ± 0.386 | 0.187 | |||
| PE, n (%) | 104 (71) | 54 (75) | 50 (67) | 0.283 | |||
| Haller index lesion level, mean ± SD | 2.28 ± 0.690 | 2.37 ± 0.796 | 2.20 ± 0.563 | 0.107 | |||
| PEL, n (%) | 106.00 (72) | 58 (81) | 48 (64) | 0.028* | |||
| APAA, mean ± SD | 0.032 ± 0.041 | 0.031 ± 0.030 | 0.032 ± 0.049 | 0.993 | |||
| TAA, mean ± SD | 0.039 ± 0.029 | 0.046 ± 0.031 | 0.032 ± 0.025 | 0.009* | –0.216 | ||
| AFLATNESS, mean ± SD | 1.273 ± 0.192 | 1.262 ± 0.189 | 1.284 ± 0.195 | 0.517 | |||
| APAL, mean ± SD | 0.040 ± 0.041 | 0.043 ± 0.042 | 0.037 ± 0.041 | 0.439 | |||
| TAL, mean ± SD | 0.047 ± 0.055 | 0.047 ± 0.046 | 0.046 ± 0.062 | 0.576 | |||
| LFLATNESS, mean ± SD | 1.376 ± 0.209 | 1.362 ± 0.209 | 1.390 ± 0.209 | 0.289 | |||
* Statistically significant (defined as p < 0.05). Testing correlation for categorical (CC) and continuous (SC) variables, with effect size comparison for categorical variables (phi coefficient, φ) and for continuous variables (PC) AAH – above average height, AFLATNESS – flatness of the hemithorax at anatomical reference level, APAA – anteroposterior asymmetry at anatomical reference level, APAL – anteroposterior asymmetry at the level of the lesion, AR in DA – access route in dependent area, BH – body height, BMI – body mass index, CC – contingency coefficient, CTH – chest height, GA – gender adjusted, L – lingula, LD – lateral decubitus, LFLATNESS – flatness of the hemithorax at the level of the lesion, LL – lower lobe, ML – middle lobe, MPA – maximum posteroanterior distance, NW – normal weight, PC – Pearson correlation coefficient, PE – pectus excavatum, PEL – pectus excavatum at the level of the target lesion, SC – Spearman correlation, TAA – transverse asymmetry at the anatomical reference level, defined as the level of the inferior pulmonary vein, TAL – transverse asymmetry at the level of the lesion, UAH – under average height, UL – upper lobe, UW – underweight, W – maximum chest width.
Pneumothorax after CT-guided lung biopsy
Seventy-five patients (51%) developed a pneumothorax following the biopsy, with the highest incidence observed in the 55-69-year age group. In 7% of these cases, drainage was required, but no patients needed further intervention or surgery. The univariate analysis revealed that the patient’s position during the procedure significantly influenced pneumothorax occurrence (p = 0.021). Patients in the supine position had the highest pneumothorax rate (40%), whereas those in the prone position had the lowest (24%). In this context, biopsies performed with an AR in the dependent lung regions (DA) were strongly protective, with a significantly lower pneumothorax rate (25% vs. 65%, p < 0.001). The prevalence of obesity (classes I-III) was significantly higher in patients without pneumothorax (21%) compared to those with pneumothorax (7%) (p = 0.016). Using the Youden index, the optimal BMI threshold to predict pneumothorax was determined to be 27.5. Consequently, patients with a BMI ≥ 27.5 were less likely to experience pneumothorax (12% vs. 36%, p < 0.001). Among the thoracic morphology measurements analyzed, significant differences were observed in specific parameters. PEL was significantly more prevalent in patients without pneumothorax (81% vs. 64%, p = 0.028) (Table 1A). Similarly, greater TAA was associated with a lower incidence of pneumothorax (p = 0.009). Additionally, generalized emphysema was more prevalent among patients who developed pneumothorax (47%) compared to those who did not (25%, p = 0.010). Needle size significantly influenced outcomes, with a higher proportion of pneumothorax cases associated with 18-G needles (81%) compared to 20-G needles (19%, p < 0.001). Similarly, the biopsy system played a critical role, with side-cut systems being associated with a higher pneumothorax rate (57%) compared to full-core systems (43%, p < 0.001) (Table 1B).
Table 1B
Univariate analysis of patient demographics and interventional parameters. Unless stated otherwise, data are mean ± standard deviation. Chi-square (χ2), Fisher’s exact test, and the Mann-Whitney U test were used to assess differences between groups for categorical, dichotomous, and continuous variables, respectively, N = 147
| Survey of lung biopsies | ||||||
|---|---|---|---|---|---|---|
| Parameter | All | No pneumothorax (n = 72) | Pneumothorax (n = 75) | p-value | φ | CC/SC |
| Generalized emphysema, n (%) | 53 (36) | 18 (25) | 35 (47) | 0.010* | ||
| Needle size, n (%) | ||||||
| 18 G | 101 (69) | 40 (56) | 61 (81) | < 0.001* | 0.278 | |
| 20 G | 46 (31) | 32 (44) | 14 (19) | |||
| Biopsy system, n (%) | ||||||
| Side-cut | 62 (42) | 19 (26) | 43 (57) | < 0.001* | –0.313 | |
| Full-core | 85 (58) | 53 (74) | 32 (43) | |||
| Number of samples, n (%) | ||||||
| 1 and 2 | 30 (20) | 15 (21) | 15 (20) | 0.794 | ||
| 3 | 66 (45) | 33 (46) | 33 (44) | |||
| 4 | 33 (22) | 15 (21) | 18 (24) | |||
| 5 and 6 | 18 (12) | 9 (13) | 9 (12) | |||
| Biopsy angle (degrees), mean ± SD | 63.71 ± 18.344 | 64.69 ± 18.294 | 62.76 ± 18.466 | 0.534 | ||
| Distance SL (mm), mean ± SD | 61.18 ± 21.778 | 64.33 ± 23.301 | 58.15 ± 19.894 | 0.101 | ||
| Distance PL (mm), mean ± SD | 15.51 ± 15.168 | 15.47 ± 14.056 | 15.56 ± 16.250 | 0.617 | ||
| Procedure time (min), mean ± SD | 26.47 ± 8.870 | 25.58 ± 9.626 | 27.32 ± 8.061 | 0.142 | ||
Association of lesion characteristics and technical parameters with the occurrence of pneumothorax
The contingency coefficient demonstrated a strong association between patient positioning and AR in DA, as well as among the various BMI classifications. Consequently, based on their effect sizes, we included only AR in DA and BMI ≥ 27.5 in the pneumothorax logistic regression model. Binomial logistic regression analysis showed that PEL (p = 0.003, odds ratio, OR = 0.208, 95% confidence interval, CI: 0.074-0.586), AR in DA (p < 0.001, OR = 0.166, 95% CI: 0.069-0.399), BMI ≥ 27.5 (p < 0.001, OR = 0.14, 95% CI: 0.045-0.431) and TAA (p = 0.023, OR = 0.00, 95% CI: 0.00-0.088) were independently associated with a lower incidence of pneumothorax (Table 2). The model exhibited a strong fit, with an R² value of 0.497 (p < 0.01). Cohen’s f² was calculated at 0.99, indicating a strong effect size [31]. To ensure comprehensive analysis, binomial logistic regression was also performed for other highly correlated variables. However, these alternative models showed significantly inferior fit compared to the primary model.
Table 2
Binomial logistic regression predicting likelihood of pneumothorax. The total number of cases in the cohort was N = 147
[i] AR – access route, B – regression coefficient, BMI – body mass index, CI – confidence interval, DA – dependent area, df – degree of freedom, PEL – pectus excavatum at the level of the target lesion, S.E. – standard error, TAA – transverse asymmetry at the anatomical reference level, defined as the level of the inferior pulmonary vein.
Discussion
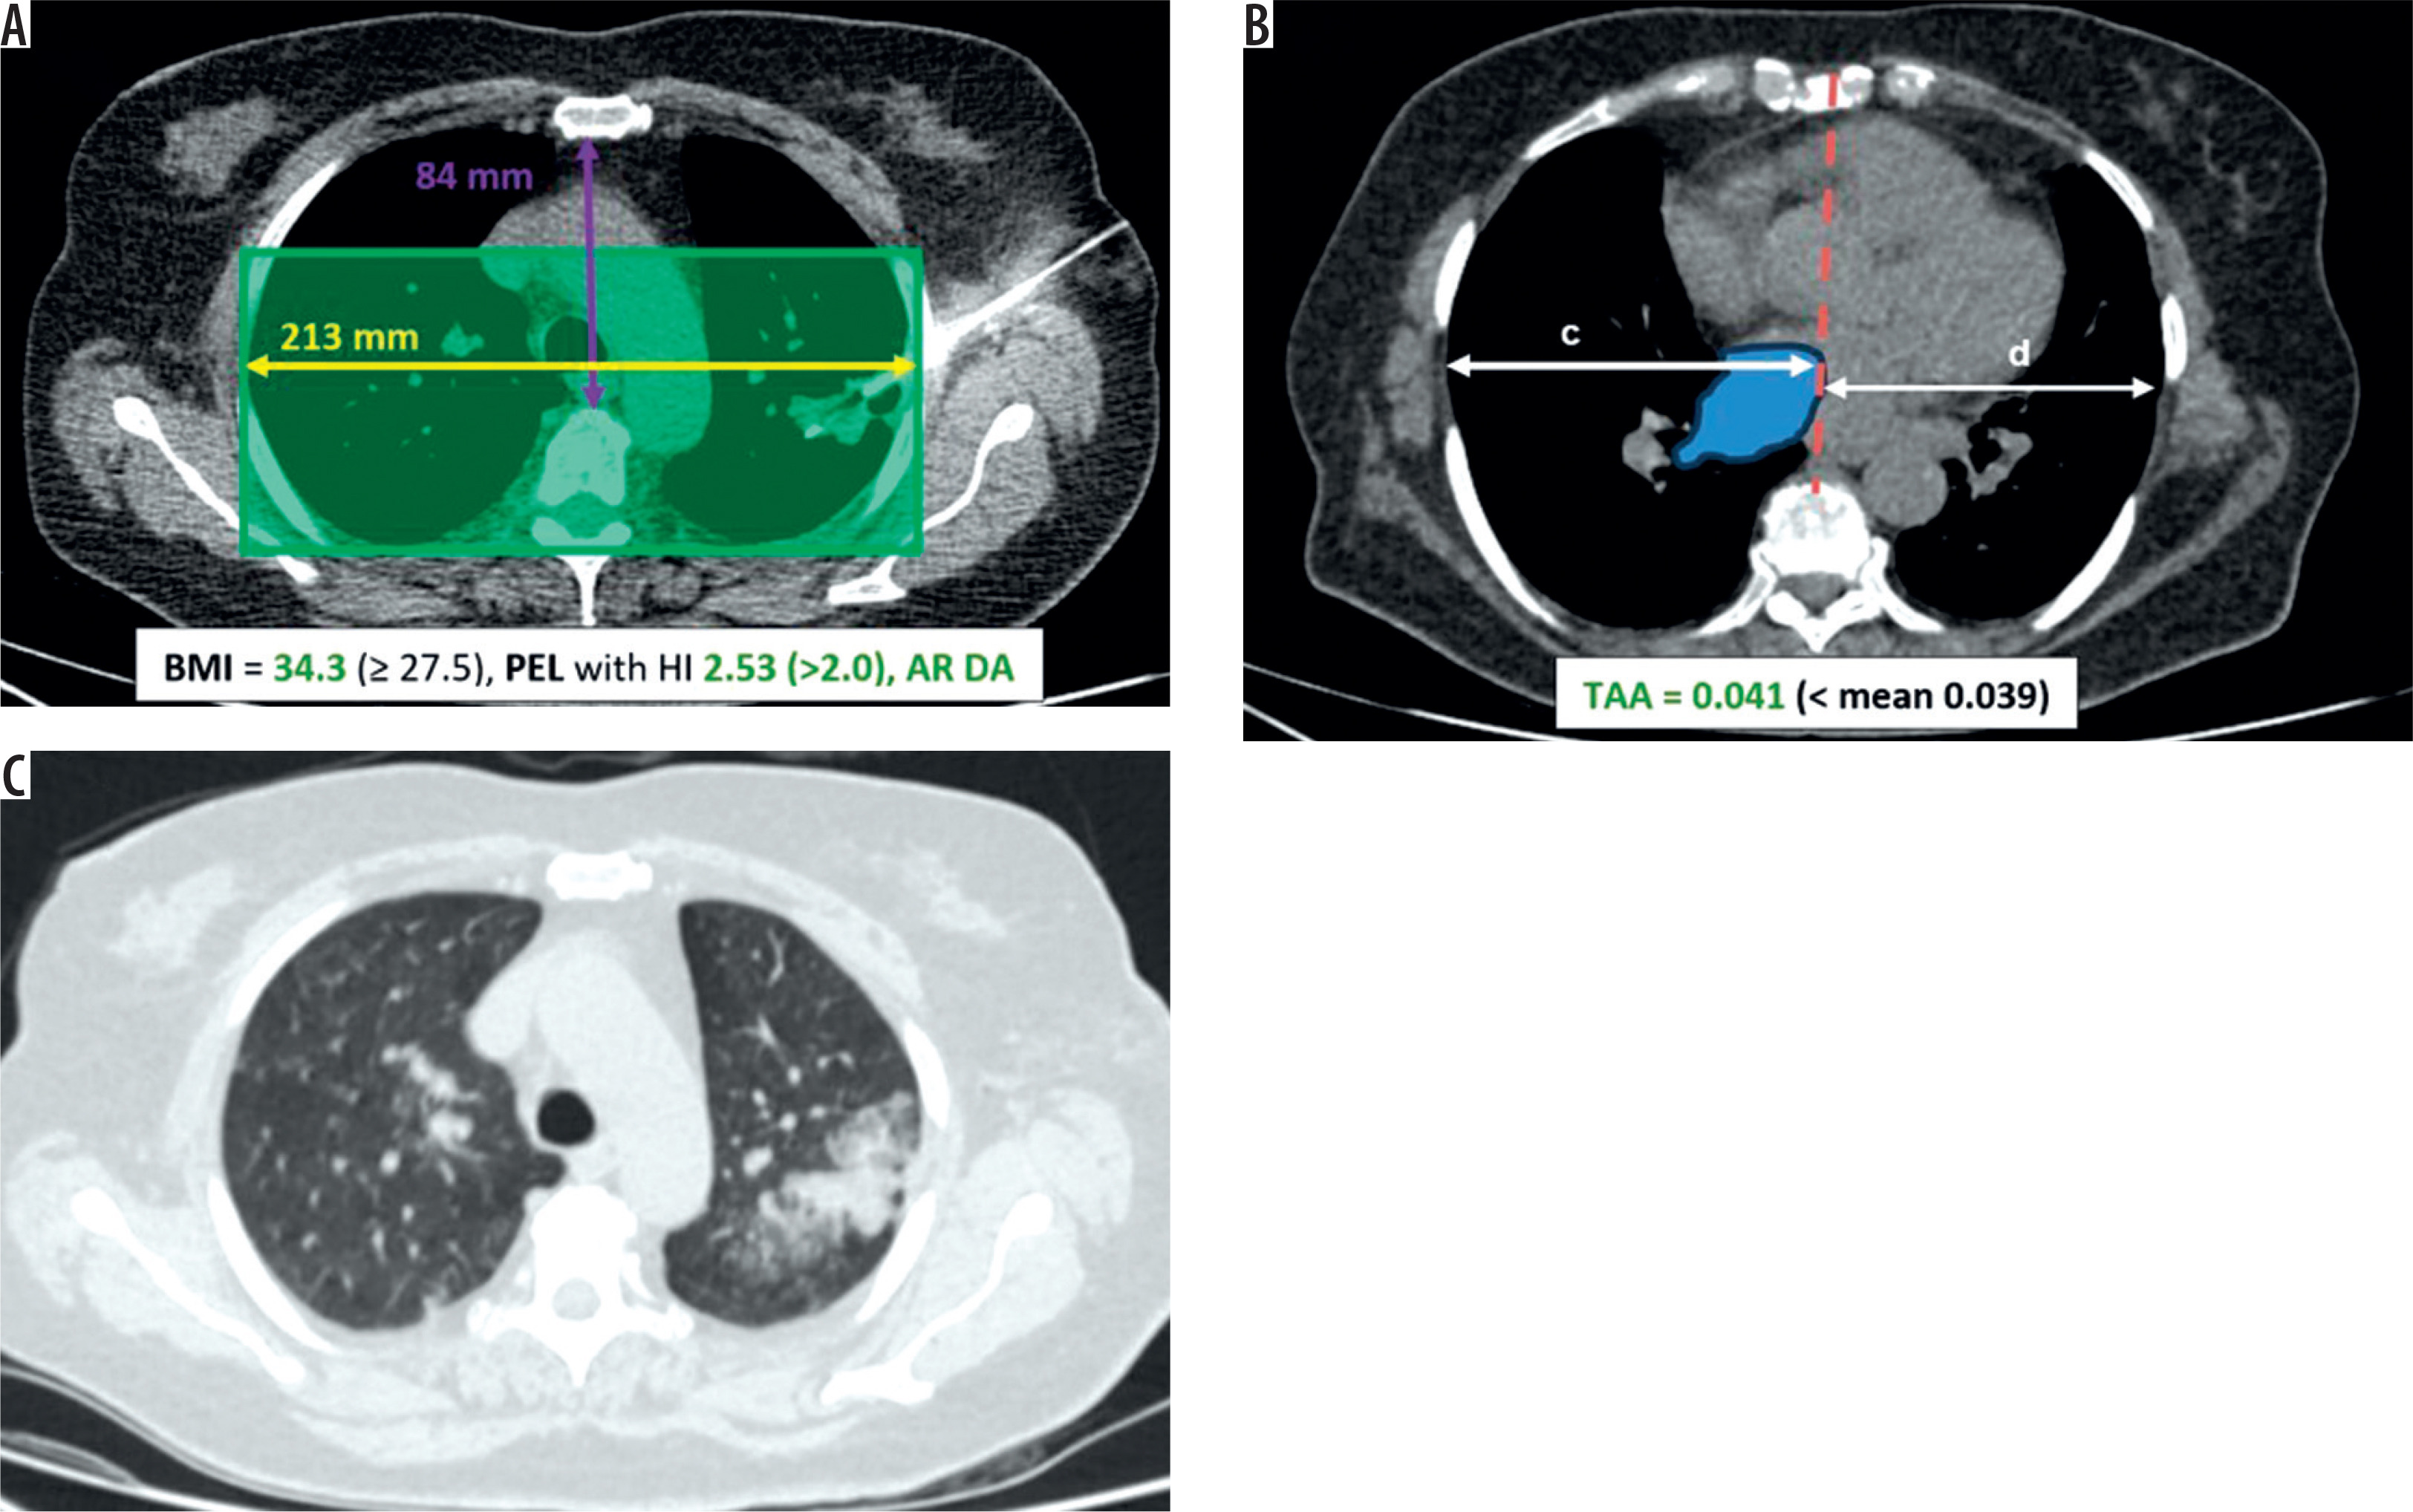
Our study identified several clinically significant factors associated with a reduced risk of pneumothorax during CT-guided lung biopsies. Patients with PEL had an approximately 80% lower likelihood of developing pneumothorax compared to those without this condition (p < 0.01). Similarly, TAA was linked to a significant reduction in pneumothorax risk (p = 0.023). A higher BMI (≥ 27.5) was a strong protective factor, reducing the risk by 86% compared to individuals with a BMI < 27.5 (p < 0.01). Furthermore, using an AR through DA emerged as a key procedural strategy to significantly minimize pneumothorax risk during CT-guided lung biopsies (p < 0.01). This is crucial, as the needle path can be strategically optimized through targeted preprocedural analysis of anatomical and body conditions, significantly reducing the risk of the most common complications associated with CT-guided lung biopsies (Figure 6).
Figure 6
Optimal anatomical and positional conditions to minimize the risk of pneumothorax in CT-guided lung biopsies based on our findings. A) The target lesion in the apicoposterior segment of the left upper lobe is biopsied using a coaxial needle, with the access route positioned in the dependent area (highlighted in green according to our rule of thirds). Prerequisites: patient with grade I obesity and mild pectus excavatum at this level. B) At the level of the right inferior pulmonary vein, the thoracic shape exhibits an above-average T asymmetry. C) Post-biopsy, no pneumothorax is visible on the left side
AR – access route, BMI – body mass index, CT – computed tomography, DA – dependent area, HI – Haller index, PEL – pectus excavatum at the level of the target lesion, T – transverse, TAA – transverse asymmetry at the anatomical reference level, defined as the level of the inferior pulmonary vein.
Our findings confirm and extend previous research. Studies have consistently shown that lower BMI is a risk factor for spontaneous pneumothorax [19]. Chung et al. [19] suggested that thinner patients experience higher transpulmonary pressure, a finding that aligns with the results of this study. We propose that individuals with lower body mass may have less structural support for their lungs. In contrast, increased thoracic fat and tissue density in individuals with higher body mass might influence the forces exerted on the pleura, offering additional structural stability and potentially reducing the risk. In this context, it must also be postulated that, due to the reduced thoracic excursion, the puncture hole in the pleura, with the needle in place, may be comparatively smaller. Specifically, mechanical compression leads to a reduced overall compliance of the respiratory system, narrowing of the small airways, and decreased tidal volume, which is compensated for by an increased breathing rate [32]. This aligns both with our experience of shallower breathing and reduced thoracic excursion in overweight patients during lung biopsies, and with our results regarding the choice of access route in dependent areas. It is possible that additional lung weight, along with the extra-thoracic mechanical compression of the lung, contributes to a larger proportion of dependent areas in comparison to lighter individuals.
Our results demonstrate that selecting an access route through the dependent lung areas reduces the risk of pneumothorax during CT-guided lung biopsies by approximately 6-fold and aligns with existing literature. A canine study found that positioning dogs in the biopsy-side-down decubitus position halted the progression of pneumothorax [33]. Drumm et al. [15] and later Najafi et al. [12] showed through prospective data that adopting the biopsy-down position reduced pneumothorax incidence. It is suggested that preprocedurally placing patients in a dependent position could reduce pressure differences between the alveoli and pleura, potentially decreasing the risk of pneumothorax [13,33]. This theory is supported by the physiological dynamics of the pleural cavity, where gravitational forces in DA help maintain lung expansion, thereby reducing the formation of subatmospheric pressure gradients that contribute to pneumothorax during needle insertion. Furthermore, it is believed that the weight of the lung influences this gradient, creating a linear vertical gravitational gradient [18,34,35], which in turn causes pleural pressure to vary depending on body position [36].
Our findings suggest that thoracic morphology may also play a significant role. The presence of TAA and PEL appears to drastically reduce pneumothorax risk during CT-guided lung biopsies. This finding appears to contradict current literature on PSP. Studies have suggested that a longer and flatter chest shape may alter the distribution of stress across the lungs, potentially contributing to the development of PSP, as reported by Peters et al. [20]. Additionally, Casha et al. [37,38] provided a biomechanical explanation for spontaneous pneumothorax. By analyzing rib cage measurements in PSP patients and age-matched chest trauma patients, they found that the PSP group exhibited a taller, wider, and flatter chest compared to the control group, potentially leading to increased apical stress. This increased apical stress has been proposed to contribute to pleural buckling and bulla formation. However, it is important to note that pneumothorax in PSP patients typically occurs when they are in a standing position. In this case, the vertical strain resulting from chronic damage to the apical lung regions plays a more significant role in disease development, compared to the relatively minimal effect of such strain during lung biopsies performed in the supine position. We support the view that chest wall deformities cause heterogeneity in alveolar pressure [23]. Based on our findings, we hypothesize that TAA at the level of the right inferior pulmonary vein may influence overall lung mechanics by altering both horizontal and cranio-caudal stress [23] distributions on the pleura. Furthermore, the rounder lung configuration observed in patients with PEL likely promotes a more uniform distribution of strain and enhanced elastic recoil, thereby reducing the overall susceptibility to needle-induced injury at the entry site. The odds ratio of TAA may be influenced by the small sample size or the rarity of TAA, potentially resulting in exaggerated estimates. Future studies with larger cohorts are warranted to confirm these findings and to elucidate the underlying mechanisms.
The higher pneumothorax rate (51%) observed in our study likely reflects our greater sensitivity in detecting pneumothoraces. Unlike other studies that relied on posteroanterior chest radiographs or defined pneumothorax only as cases with complete circumferential detachment of the visceral pleura, we classified any air accumulation in the pleural cavity detected on post-biopsy CT as pneumothorax [e.g. 39]. Furthermore, it is important to note that cases with potentially protective factors for pneumothorax, such as tumor infiltration of the pleura, were excluded from our analysis. Our findings indicate that the presence of generalized emphysema showed a non-significantly higher risk of pneumothorax during CT-guided lung biopsies (p = 0.067). The lack of statistical significance may be partially attributed to the reliance on visual assessment, which could limit the precision of emphysema evaluation [40,41]. Additionally, the literature highlights a stronger association between perilesional emphysema and pneumothorax risk, rather than presence of generalized emphysema [42].
Our study has several limitations. First, the study’s retrospective nature and its single-center design may limit the generalizability of the findings. A patient population across multiple centers would help confirm the applicability of the results to broader clinical settings. Second, despite the analysis of 211 biopsies, the relatively small sample size in certain subgroups (e.g., patients with pectus excavatum or T asymmetry) may have limited statistical power, potentially leading to overestimated effect sizes. To strengthen the validity and applicability of these results, future studies involving larger cohorts are essential. Third, we used a simplified model to estimate the gravitational effects on pleural pressure in specific patient positions, as direct pleural manometry during the procedure was not feasible due to ethical considerations.
Conclusions
Constitutional factors such as obesity or the identification of subclinical chest deformities on pre-procedural imaging may facilitate stratification into lower-risk categories, facilitating more precise and confident procedural planning. Especially in the absence of these protective factors, ensuring that the biopsy access route traverses dependent lung areas becomes particularly important for minimizing the risk of pneumothorax during CT-guided lung biopsies.