Introduction
In men, prostate cancer (PCa) is the most common cancer after skin cancer; it is also the second most common cause of cancer-related death after lung cancer [1]. PCa is clinically evaluated by prostate specific antigen (PSA) and digital rectal examination (DRE). Systematic transrectal ultrasonography (TRUS)-guided biopsy is performed in patients with suspected cancer according to the results of PSA and DRE. However, these current scans have certain restrictions, including their limited diagnostic efficacy [1,2]. TRUS-guided biopsy does not provide sufficient information about the volume, extension, and aggressiveness of the tumour, and it may lead to overestimation or underestimation of the pathologically assessed Gleason score (GS). It is known that the GS obtained from TRUS-guided biopsy and the final GS do not always match. However, the GS has an important place in the management of PCa [3]. Some patients with a GS of 6 are unlikely to have clinically significant cancer (CSC), and in this patient group, active surveillance is the treatment option that has come to the forefront in recent years [4]. In patients with a GS of 6 in TRUS-guided biopsy but a different final GS, there is the possibility of CSC and under-treatment. Therefore, alternative diagnostic methods are required for this patient group. For the diagnosis of PCa, imaging methods were not sufficient in the past, but today, in parallel with technological developments, magnetic resonance imaging (MRI) is increasingly used for this purpose. It has been reported that multiparametric MRI (mpMRI) can be used in the detection of lesions with a high probability of CSC in patients with a GS of 6 [5,6].
In this study, we aimed to evaluate the prostate mpMRI findings in patients with a GS of 6 in TRUS-guided biopsy and to evaluate the efficacy of mpMRI examination in patients who underwent RP with pathology results.
Material and methods
This investigation was a retrospective study and was approved by our institutional review board (date: 07.05.2019, no: 25403353-050.99-E.56882). Of the patients that had clinically suspected PCa based on the DRE results and/or high PSA values, those that had a GS of 6 according to TRUS-guided systematic or saturation prostate biopsy and underwent prostate mpMRI between January 2015 and January 2019 were included in the study. Ninety patients who met these criteria were retrospectively re-evaluated. Eight patients with technically inadequate scans (motion artifact, poor quality examination, and inappropriate b-values) and 2 patients with T1AW haemorrhagic signalling that would have prevented the evaluation of the prostate parenchyma were excluded. The remaining 80 patients comprised the study group.
Multiparametric magnetic resonance imaging protocol
All mpMRI examinations were performed using a 3 Tesla (General Electric, Milwaukee, WI) MRI device with a 48-channel body coil. Because all patients had undergone TRUS-guided biopsy before MRI, the MRI was performed at least 8 weeks after the biopsy. No enema or antispasmolytic was used before the examination. The routine prostate mpMRI protocol consisted of T2-weighted (T2W) non-fat-saturated imaging in 3 planes, diffusion-weighted imaging (DWI) in the axial plane, fat-suppressed T2W and pre/post-contrast fat-suppressed T1-weighted imaging (T1W) in the axial plane, and dynamic contrast-enhanced MRI (DCE-MRI). The duration of the DCE-MRI scan was 5 minutes. 0.1 mmol/kg gadoterate meglumine (Dotarem, Guerbet-France) was intravenously administered at a rate of 2.0 ml/s. The temporal resolution was 7 s. The imaging parameters are summarized in Table 1.
Table 1
Prostate multiparametric magnetic resonance imaging scan protocol
[i] T2WI – T2-weighted image, T1WI – T1-weighted image, FST2WI – fat-suppressed T2WI, DWI – diffusion-weighted imaging, DCE-MRI – dynamic contrast-enhanced magnetic resonance imaging, TR – repetition time, TE – echo time, FOV – field of view, NEX – number of excitations, FSE – fast spin echo, EPI – echo-planar imaging
Radiological evaluation and study design
The mpMRI images were evaluated according to the PI-RADS v2.1 guidelines by 2 radiologists with experience in urogenital imaging. The evaluators knew that the patients had a GS of 6 but were blinded to their PSA values and clinical information. The tumours originating from the transitional zone and central zone were evaluated as central gland tumours while those originating from the peripheral zone were recorded as peripheral gland tumours. The localization of the lesions was determined according to the sectoral map indicated in PI-RAD v2.1. The localization of the lesions, their largest diameter, PI-RAD v2.1 score, presence of extraprostatic extension (EPE), and the volume of the prostate were recorded.
According to the results of the mpMRI examination, the patients were divided into 2 groups: those with a high CSC probability (PI-RADS score 4 and 5) and those with a low CSC probability (PI-RADS score 2 and 3). The 2 groups were compared for age, PSA, PSA density, tumour percentage on biopsy, and prostate volume. The pathology results of the prostatectomy specimens of the group that underwent radical prostatectomy (RP) were accepted as the gold standard, and these patients were divided into 2 groups: those with CSC (GS of ≥ 7, GS of 3 + 3 accompanied by EPE, and a GS of 3 + 3 but tumour volume of > 0.5 cc ) and those without CSC. These 2 groups were evaluated in terms of mpMRI findings and the efficacy of mpMRI examination through comparison with the RP pathology results.
Statistical analysis
SPSS software v. 22.0 (Chicago, IL) was used for the statistical analysis. Normality analysis was conducted by the Shapiro-Wilk test. The mean, standard deviation, median, minimum, and maximum values were obtained as descriptive statistics of continuous data and as percentage values for discrete data. In the comparison of 2 groups, Student’s t-test was used for parametric variables and the Mann-Whitney U test for non-parametric variables. A p value less than 0.05 was considered statistically significant. In comparison with the gold standard test, the sensitivity, specificity, positive and negative predictive values, and accuracy rate of the diagnostic indices were calculated at the 95% confidence interval.
Results
Eighty patients with a GS of 6 in TRUS-guided biopsy, who underwent mpMRI between January 2015 and January 2019 were evaluated in terms of their MRI findings. The age range of the patients was 49-78 (mean 64 ± 7.09) years, the PSA ranged from 0.73 to 55.27 ng/ml (8.86 ± 7.75), and the PSA density from 0.016 to 0.934 ng/ml/cc (0.158 ± 0.133). The prostate volumes varied between 20.27 and 190.79 cm3 (64.26 ± 32.42).
In 20 of the 80 patients, the final PI-RADS score was 2. The remaining 60 patients had 77 lesions (a single lesion in 46 patients, 2 lesions in 12, 3 lesions in 1, and 4 lesions in 1). Seven of these lesions were PI-RADS 3, 50 were PI-RADS 4, and 20 were PI-RADS 5. Of the lesions in the PI-RADS 4 and 5 categories, 13 (18.6%) were localized in the central gland, 3 (4.2%) in the anterior fibromuscular stroma, and 54 (77.2%) in the peripheral gland. Thirty-seven (52.9%) of the lesions in these categories were in the right gland and 33 (47.1%) in the left gland.
The patients were divided into 2 groups according to the mpMRI findings and PI-RADS results: those with a high probability of having CSC (PI-RADS 4-5) and those with a low probability of having CSC (PI-RADS 2-3). In the differentiation of patients with multifocal lesions, the lesion with a higher PI-RADS score was taken into consideration. In these 2 groups, PI-RADS 2 and 3 lesions were detected in 27 (33.8%) patients and PI-RADS 4 and 5 lesions in 53 (66.2%) patients. The mean age, PSA value, PSA density, and TRUS-guided biopsy percentages of the patients with a high and low probability of CSC were compared, and the results are summarized in Table 2. There was a significant difference between the 2 groups in all parameters except prostate volume. In the group with a high probability of having CSC, the PSA value and density was higher, the patients were older, and the percentage of tumours was higher than in the group with a low probability of having CSC.
Table 2
Comparison of the patients with a high and low probability of clinically significant cancer (CSC) in terms of age, prostate specific antigen (PSA), PSA density, and prostate volume
RP was performed in 28 patients, and the pathology results of 27 patients were reached. According to their RP results, the patients were divided into 2 groups: those with CSC and those with clinically non-significant cancer (CNSC). The CSC group consisted of patients with a final GS of ≥ 7 (n = 9), GS of 3 + 3 accompanied by EPE (n = 6), and a GS of 3 + 3 but tumour volume of > 0.5 cc (n = 4). The patients who did not meet any of these criteria (n = 8) were classified as the CNSC group. In the CSC group (n = 19) 1 patient was evaluated as PI-RADS 3, 11 as PI-RADS 4, and 7 as PI-RADS 5. Of the patients who were not included in the CSC group (n = 8), 6 were found to have a PI-RADS 2 score and 2 had a PI-RADS 3 score. Accordingly, when the RP results were taken as the gold standard, the sensitivity, specificity, and accuracy of mpMRI were calculated as 94.74%, 100%, and 96.3%, respectively. The findings are summarized in Table 3. An increase in the final GS was found in 9 (33.3%) of 27 patients. Ten of the remaining 18 patients, despite the absence of an increase in the GSs, had CSC according to the final pathology results (EPE [n = 6], tumour volume of > 0.5 cc [n = 4]). The specificity of mpMRI in the diagnosis of CSC in the RP group with PI-RADS 4-5 was calculated as 100%. According to the final pathology results, the predictive values of mpMRI for CSC were determined as 0% for PI-RADS 2, 33.3% for PI-RADS 3, and 100% for PI-RADS 4 and 5.
Table 3
Sensitivity, specificity, positive predictive value (PPV), negative predictive value (NPV), and accuracy of multiparametric magnetic resonance imaging in detecting clinically significant cancer (CSC) according to the pathology results of patients who underwent radical prostatectomy
| Parameter | Result |
|---|---|
| Sensitivity | 94.74% |
| Specificity | 100% |
| PPV | 100% |
| NPV | 88.89% |
| Accuracy | 96.30% |
Discussion
The treatment options of PCa include active surveillance, watchful waiting, RP, radiotherapy, and brachytherapy, while adjuvant hormone therapy is indicated for high-risk patients. The aim of treatment is to avoid unnecessary surgery or radiotherapy, and their side effects, in patients with slow progression of the disease and low risk of mortality, and to prevent under-treatment of cases in which PCa is likely to progress in an aggressive manner. This increases the importance of non-invasive imaging methods [7,8]. Imaging methods are helpful in guiding the clinician in decision-making in patients with a GS of 6 according to TRUS-guided biopsy.
Patients with a GS of 6 can be evaluated together with other clinical findings and can be enrolled AS. MpMRI may be useful in 2 stages of AS: the baseline examination at patient enrolment and as an alternative to follow-up TRUS-biopsy during AS. The classification of AS patients is mostly not due to progression of tumour, but instead undersampling at first biopsy [9]. The inadequate sampling of PCa on serial biopsy is the reason for incorrect grading in 23-25% of patients [10]. Patients who are considered to be candidates for AS would benefit from mpMRI because it enables better initial diagnosis and reduces the need for repeat biopsies.
According to the ESUR and EUS guidelines, mpMRI is recommended in the patient’s AS enrolment due to its sensitivity in showing clinically important cancers. According to the guidelines, MRI before confirmatory biopsy results in fewer failures of surveillance and in fewer patients progressing to CSC. In addition, it is likely that mpMRI and targeted biopsies will detect small focuses of cancer that might be missed with systematic biopsy [11,12].
Patient age, PSA value, PSA density, and tumour percentage on biopsy were higher in the group with a high probability of having CSC than in the second group. Regarding prostate volume, there was no difference between the 2 groups. CSC detection rates increase with patient’s age, PSA value, PSA density, and tumour percentage on biopsy. Our results obtained from MRI also support these findings. MRI findings can estimate risk similarly to traditional risk factors. In patients with positive traditional risk factors, MRI can be used to confirm and support risk estimation. In patients with small prostate volumes, the rate of CSC incidence is higher than in those with large volumes. In our study group, although the difference was not statistically significant, prostate volumes were higher in the group with a high probability of having CSC.
In our study PI-RADS scores were 2 in 25%, 3 in 8.75%, 4 in 43.75%, and 5 in 22.5%, according to the mpMRI findings, while in a study including 56 patients performed by Zhai et al. [13] these rates were 17.9%, 19.6%, 25.0%, and 37.5%, respectively. This shows that we had a higher number of patients with PI-RADS scores of 2 and 4 and a lower number of patients evaluated as PI-RADS 3 or 5. However, when the patients were evaluated in 2 groups as those with a high probability of CSC and those with a low probability of CSC, the former constituted 62.5% and the latter constituted 37.5% of the sample in the study by Zhai et al., which is in agreement with our percentages of 66.2% and 33.8%, respectively.
In our study group, 20 (25%) of 80 patients were included in the PI-RADS 2 group according to mpMRI. Six of these patients had undergone RP, and all had a final GS of 6. In addition, none of the patients in this group had a CSC finding (EPE, > 0.5 cc tumour volume) other than the GS. Similarly to reports in the literature, low-volume Gleason 6 lesions could not be visualized in our study. This may initially seem like a deficiency or failure to detect the tumour focus, but it is reported to be an advantage because a negative mpMRI can prevent unnecessary anxiety and over-treatment in CNSC [14]. In the current study, none of the patients with PI-RADS 2 according to mpMRI was found to have CSC.
In this study, PI-RADS 3 lesions were detected in 7 patients (8.75%). PI-RADS 3 represents the group in which the maximum probability of CSC is 50% [15,16]. In our study, RP was performed in 4 of 7 patients in this group. The pathology results of 1 patient could not be found. Among the remaining 3 patients, the final GS was 3 + 3 in 2 and 3 + 4 in 1. Our results are consistent with the PI-RADS prediction. One (33.3%) of the 3 patients who we identified as PI-RADS 3 according to the RP GS was found to have CSC (Gleason 3 + 4).
In our sample, a total of 70 PI-RADS 4-5 lesions were observed in 53 (66.2%) patients. The patients with PI-RADS scores of 4-5 comprised the group with a high probability of CSC. At the same time, they were evaluated as the group with the potential to have increased RP final pathology results compared to the TRUS-guided biopsy results. Eighteen of these patients underwent RP. All the 18 patients who underwent RP in the group with a high probability of CSC were confirmed to have CSC by the final pathology results. Thus, the specificity of mpMRI in the diagnosis of CSC was calculated as 100%. In a previous study of 182 patients with a GS of 6, who underwent RP, the specificity of 3 different observers in detecting patients with CSC according to the final pathologies was found to be 80.5%, 81.1%, and 89.9% [17]. Our accuracy rate is higher than in the literature. This may be because MRI examinations were evaluated by radiologists experienced in prostate MRI.
According to their RP results, the final GS was reported as 3 + 3 for 18 patients, 3 + 4 for 8 patients, and 4 + 3 for 1 patient. There was an increase in the final GS in 9 patients (33.33%). In a study showing the consistency between the biopsy and RP GSs of 7643 patients, Epstein et al. [18] reported an increased GS in 36.3% of the patients compared to the biopsy GS of 5 and 6, which confirms the results of our study. In our study, 70.35% of patients were identified as having CSC (GS of ≥ 7, GS of 3 + 3 accompanied by EPE, and a GS of 3 + 3 but tumour volume of > 0.5 cc), and 29.7% of cases were found to have CNSC according to the RP result. When MRI results were evaluated, only 1 of these patients diagnosed with CSC was evaluated as having PI-RADS 3 lesions that could not be diagnosed with MRI. When the RP pathology results were taken as the gold standard, the sensitivity, specificity, positive predictive value, and negative predictive value of mpMRI were found to be 94.74%, 100%, 100%, and 88.89%, respectively. In a meta-analysis, Fütterer et al. [19] found the ranges of sensitivity, specificity, positive predictive value, and negative predictive value of mpMRI in detecting CSC as 58-96%, 23-67%, 34-68%, and 63-98%, respectively. Most of our results were higher than in the literature. This may be because many studies in the literature were performed with a 1.5 Tesla MRI.
In our study, prostate biopsies were performed using TRUS-guided systematic or saturation biopsy. In a study comparing TRUS-guided biopsy, MRI-guided fusion biopsy, and cognitive biopsies in the literature, it was reported that the rate of detection of PCa and CSC was higher with MRI-guided fusion biopsy compared to cognitive and TRUS systematic biopsy [20]. In another study, it was reported that CSC was detected at a higher rate in MR-guided biopsies (missed 10% CSC) compared to TRUS-guided biopsies (missed 21% CSC) [21]. In our study, an increase in the final RP GS was found in 33.3% of patients. If an MRI-fusion biopsy had been used, it would have been more likely that GS would have been found to be higher at baseline. This can be considered as a limitation of our study.
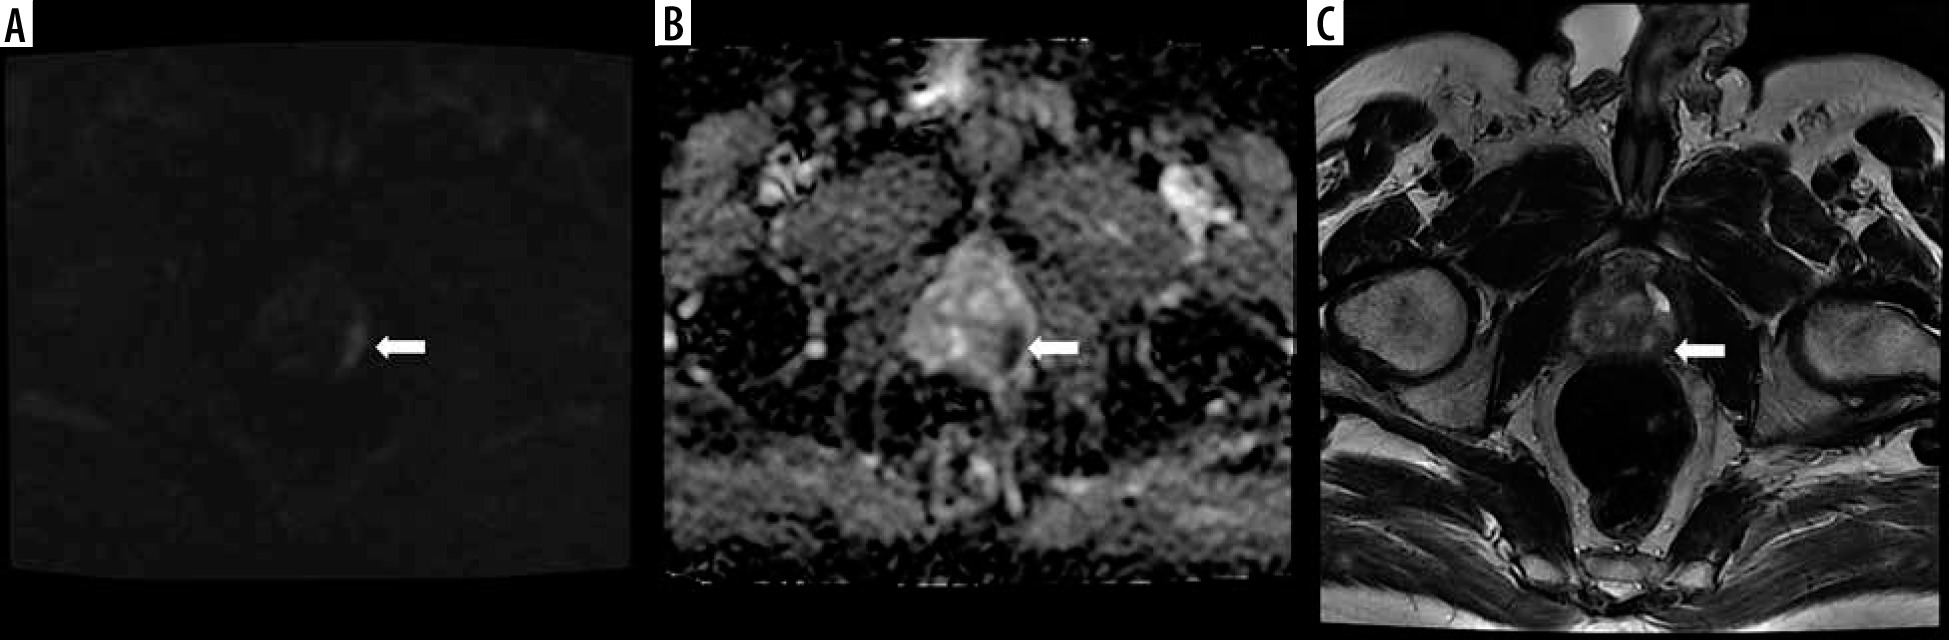
It is known that mpMRI is a strong predictor of CSC, and patients with a high PI-RADS score are more likely to have CSC (Figure 1). NiMhurchu et al. [16], who evaluated the correlation between PI-RADS v2 scores and CSC according to the pathology results, calculated the positive predictive value as 10.6% for PI-RADS 3, 44% for PI-RADS 4, and 100% for PI-RADS 5. In another study, the relationship between the PI-RADS score and cancer detection rate was 33.1% for PI-RADS 3, 70.5% for PI-RADS 4, and 90.7% for PI-RADS 5 [22]. In our study, this rate was 33.3% in patients with a PI-RADS 3 score and 100% in those with PI-RADS 4 and 5 scores. Our results are compatible with the literature. The limitations of this study include the relatively small sample size and the low number of patients who underwent RP.
Figure 1
A lesion located in the left peripheral gland at the level of the apex in the posterior-posterolateral section, with A) restricted diffusion apparent on DWI, B) low ADC values on the ADC map, and C) hypointense character and 12 mm diameter in the widest point (arrows). Because the length of the tumour capsule was greater than 1 cm, it was evaluated as PI-RADS 5. The patient underwent repeat biopsy using cognitive fusion, and his Gleason score was reported as 4 + 5
Conclusions
In addition to TRUS-guided biopsy, there is a need for further reliable non-invasive diagnostic methods that can guide clinicians in decision-making in patients with a Gleason score of 6. mpMRI is a promising candidate to fill this gap. Although it has not yet been included in routine practice, mpMRI, with its high sensitivity and negative predictive values in the diagnosis of PCa, may help to prevent under-staging. In addition, the current methods for determining the best treatment option for PCa do not fully meet the therapeutic objectives, resulting in the under- or over-treatment of some patients. mpMRI is an effective, reliable, and non-invasive imaging method to help determine the optimal treatment and guide clinicians in the surveillance decision and follow-up period.