Introduction
Prostate cancer (PCa) stands as a leading health issue for men globally, ranking as the most common cancer among males and the second leading cause of cancer-related deaths [1-4]. While traditional screening methods like prostate-specific antigen (PSA) testing, digital rectal examinations, and transrectal ultrasound-guided biopsies are widely used, they come with significant drawbacks, such as being invasive or having limited accuracy [5]. To address these limitations, multiparametric magnetic resonance imaging (mp-MRI) has emerged as a powerful diagnostic tool, providing a non-invasive means to detect and evaluate PCa with a high degree of accuracy [6]. However, interpreting mp-MRI to determine the aggressiveness of PCa can be challenging and often relies heavily on the expertise of skilled radiologists.
Recent innovations in artificial intelligence (AI) and machine learning have begun transforming PCa diagnostics by enhancing the capabilities of mp-MRI. These technologies aim to reduce human error, expedite the diagnostic process, and improve overall accuracy by using advanced algorithms to analyze MRI images. Computer-aided diagnostic (CAD) systems [7-9], particularly those utilizing texture analysis and convolutional neural networks (CNNs), have shown promise in distinguishing between clinically significant and insignificant PCas [10]. This technology not only aids radiologists in making more precise diagnoses but also helps in standardizing interpretations, which could lead to better patient outcomes and more tailored treatment plans.
The growing field of radiomics – extracting vast amounts of quantitative data from medical images – represents a frontier in personalized medicine. By analyzing these data, radiomics can provide detailed insights into tumor characteristics that go beyond what is visible to the naked eye, potentially predicting disease progression and treatment response more accurately [11-13]. However, the adoption of radiomics in clinical practice faces several hurdles, including variations in imaging techniques and inconsistencies in how data are processed, which can lead to unreliable results [14-16]. Addressing these technical challenges is crucial for integrating radiomics into routine clinical workflows.
Ensuring the reliability of radiomics is where statistical tools like the intraclass correlation coefficient (ICC) come into play [17-19]. The ICC is used to measure the consistency and agreement of radiomic features across different imaging datasets, accounting for variations in equipment, patient demographics, and imaging protocols. Its application is essential for validating the robustness of radiomic features and ensuring that they can be reliably used in clinical setting [19-21].
This study aims to enhance the reliability and clinical utility of radiomics in PCa diagnosis by identifying robust radiomic features using the ICC. By focusing on features with high ICC values, we can ensure more consistent and accurate extraction of data from MRI images, which can then be applied to advanced AI classifiers. This approach not only promises to improve the accuracy of PCa diagnosis but also supports the broader goal of developing more personalized and effective treatment strategies for patients.
Material and methods
Research methodology steps
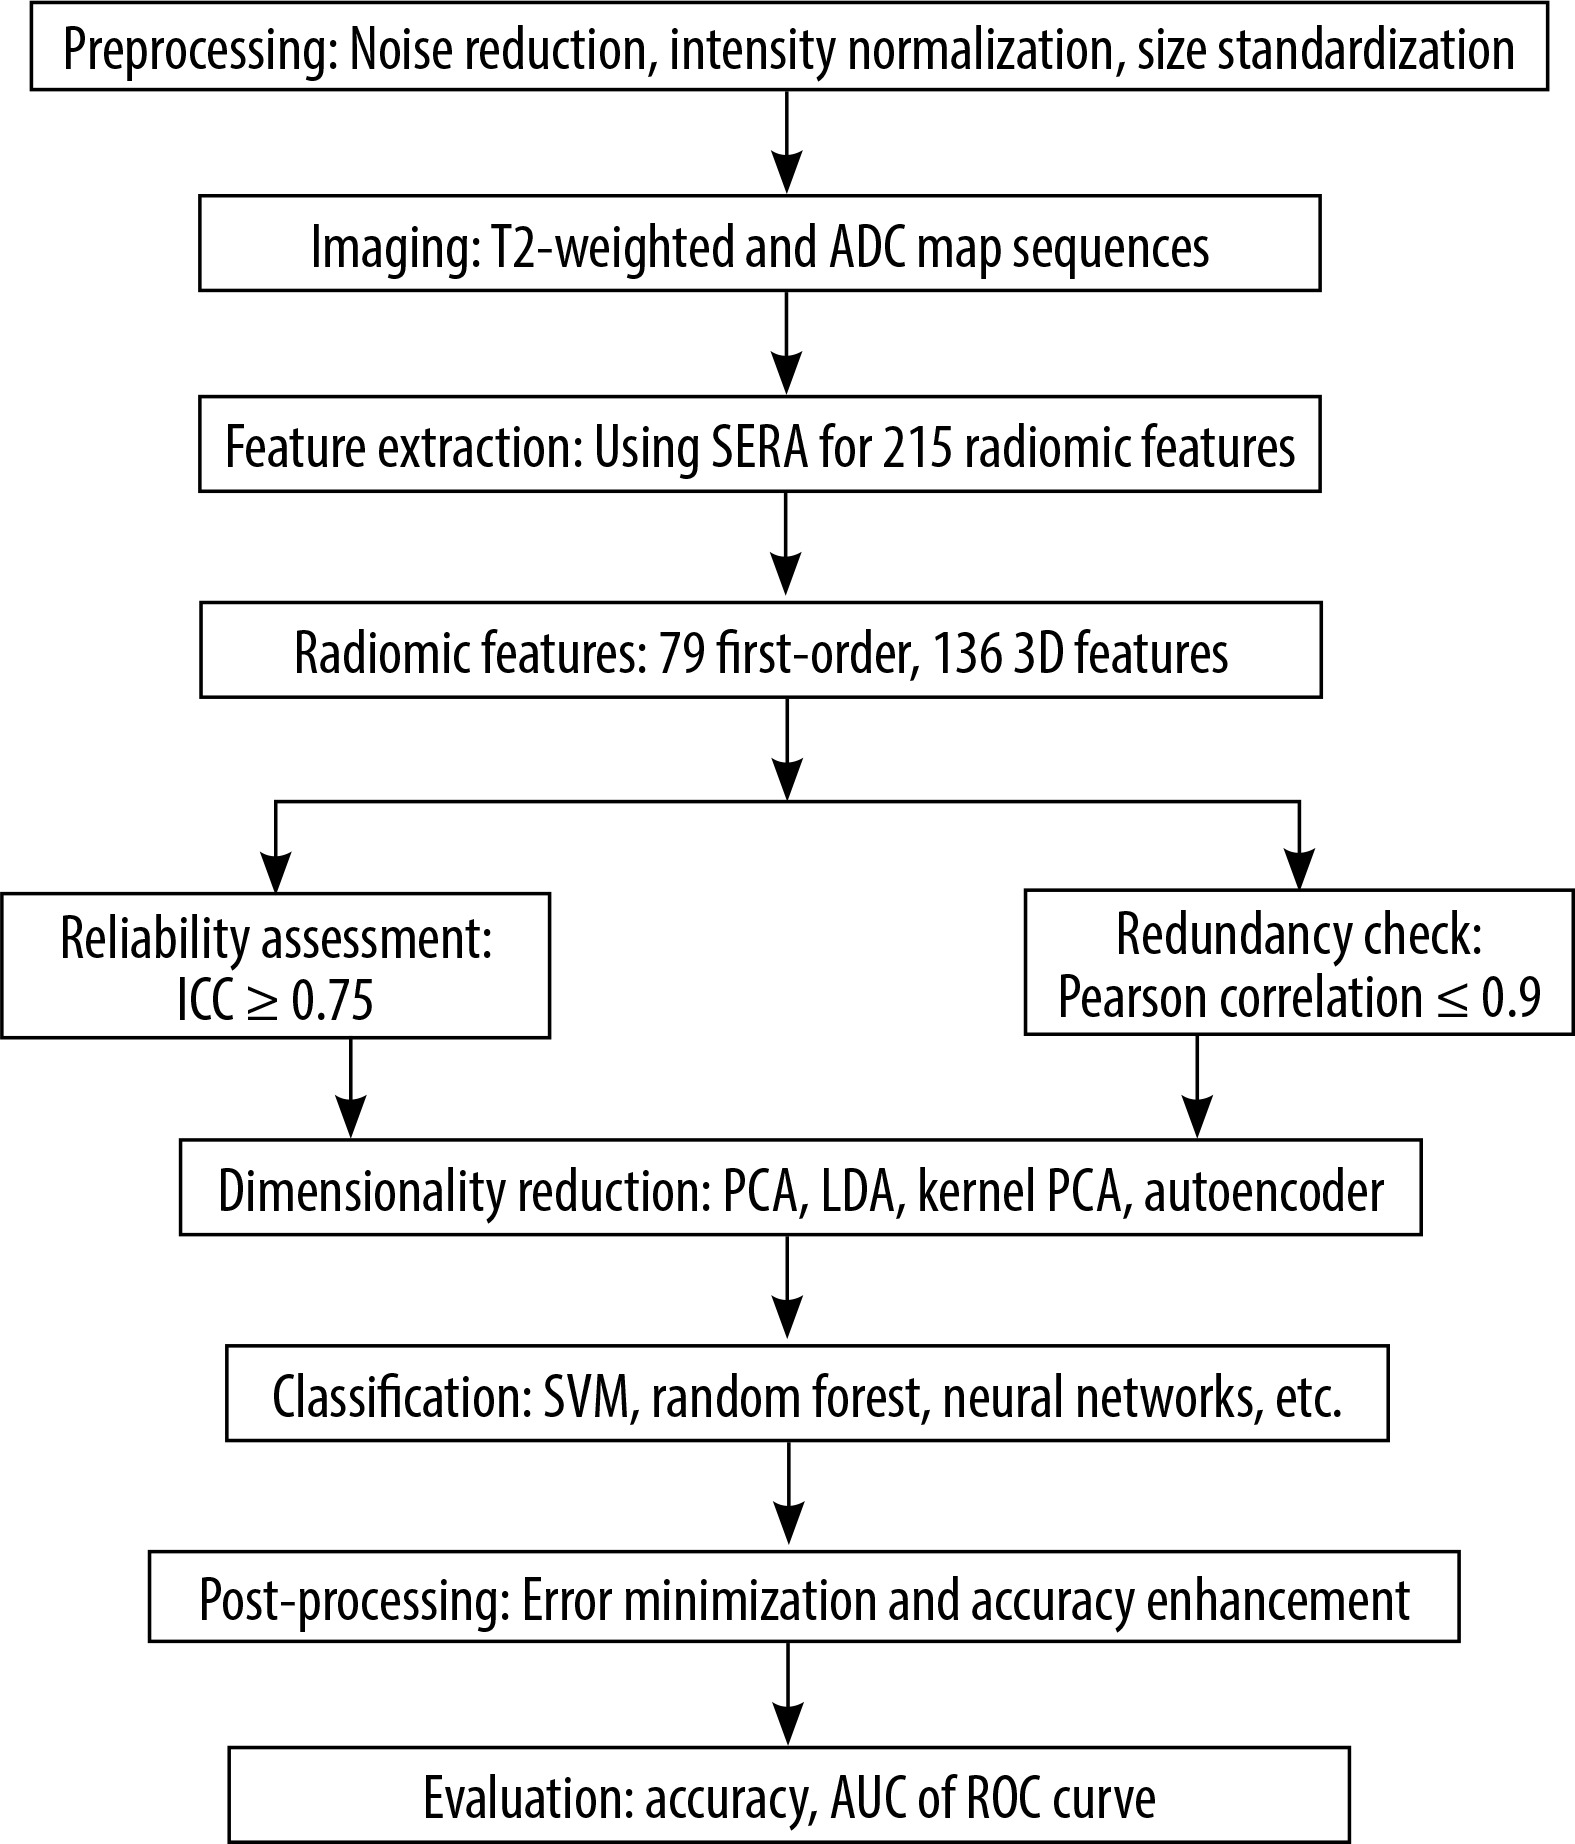
The methodology for developing a Prostate Tumor Classification System involves several key stages. The process begins with pre-processing, where prostate imaging data is prepared through noise reduction, intensity normalization, and standardization of MRI image sizes to ensure consistency across all images. Next, feature extraction is performed to generate feature vectors that represent unique aspects of the prostate tissue. Due to the high dimensionality of these extracted features, dimensionality reduction techniques are applied to decrease computational complexity while preserving essential information. The reduced feature vectors are then used to train a classifier to distinguish between tumor types, with regions identified as tumorous or benign based on imaging data. Following classification, post-processing steps are implemented to minimize errors and enhance accuracy. Finally, the system’s performance is evaluated using metrics such as accuracy, sensitivity, and specificity, ensuring its reliability and effectiveness for clinical application. In Figure 1, the study flowchart is shown.
Study cohort and imaging techniques
This study analyzed prostate MRI images from a total of 82 individuals, consisting of 41 patients diagnosed with PCa and 41 healthy controls. The images were randomly selected and acquired using two distinct imaging sequences: T2-weighted and apparent diffusion coefficient (ADC) map sequences. The T2-weighted images, known for their high contrast, were utilized to enhance the visualization of soft tissue structures, while the ADC maps were employed to provide insights into the diffusion characteristics of water molecules within the tissue. All imaging was performed using an MRI system, which is well-regarded for its high precision and resolution, thereby ensuring high-quality medical images suitable for detailed analysis. The MRI images used in this study were sourced from a publicly available dataset [https://prostate158.grand-challenge.org].
Radiomics feature extraction methodology
The radiomics feature extraction process yielded a total of 215 features distributed across various categories, including first-order statistics, 3D texture features, and morphological characteristics, among others. Table 1 provides a detailed summary of the extracted radiomics features, highlighting their number and functional relevance in analyzing MRI data. These features were generated using the Software Environment for Radiomic Analysis (SERA) to capture comprehensive intensity, shape, and texture information.
Table 1
Overview of radiomics features extracted from magnetic resonance images
The MRI images were acquired with a 1.5 Tesla system using the following parameters: a field of view (FOV) of 240 mm, a slice thickness of 3 mm, and an in-plane resolution of 0.5 × 0.5 mm. Pre-processing steps included noise reduction using Gaussian filtering, intensity normalization to standardize the dynamic range across images, and resizing all images to a consistent matrix size of 256 × 256 pixels for uniform analysis. These steps ensured consistency and minimized variability due to acquisition artifacts or patient-specific differences.
Assessment of reproducibility
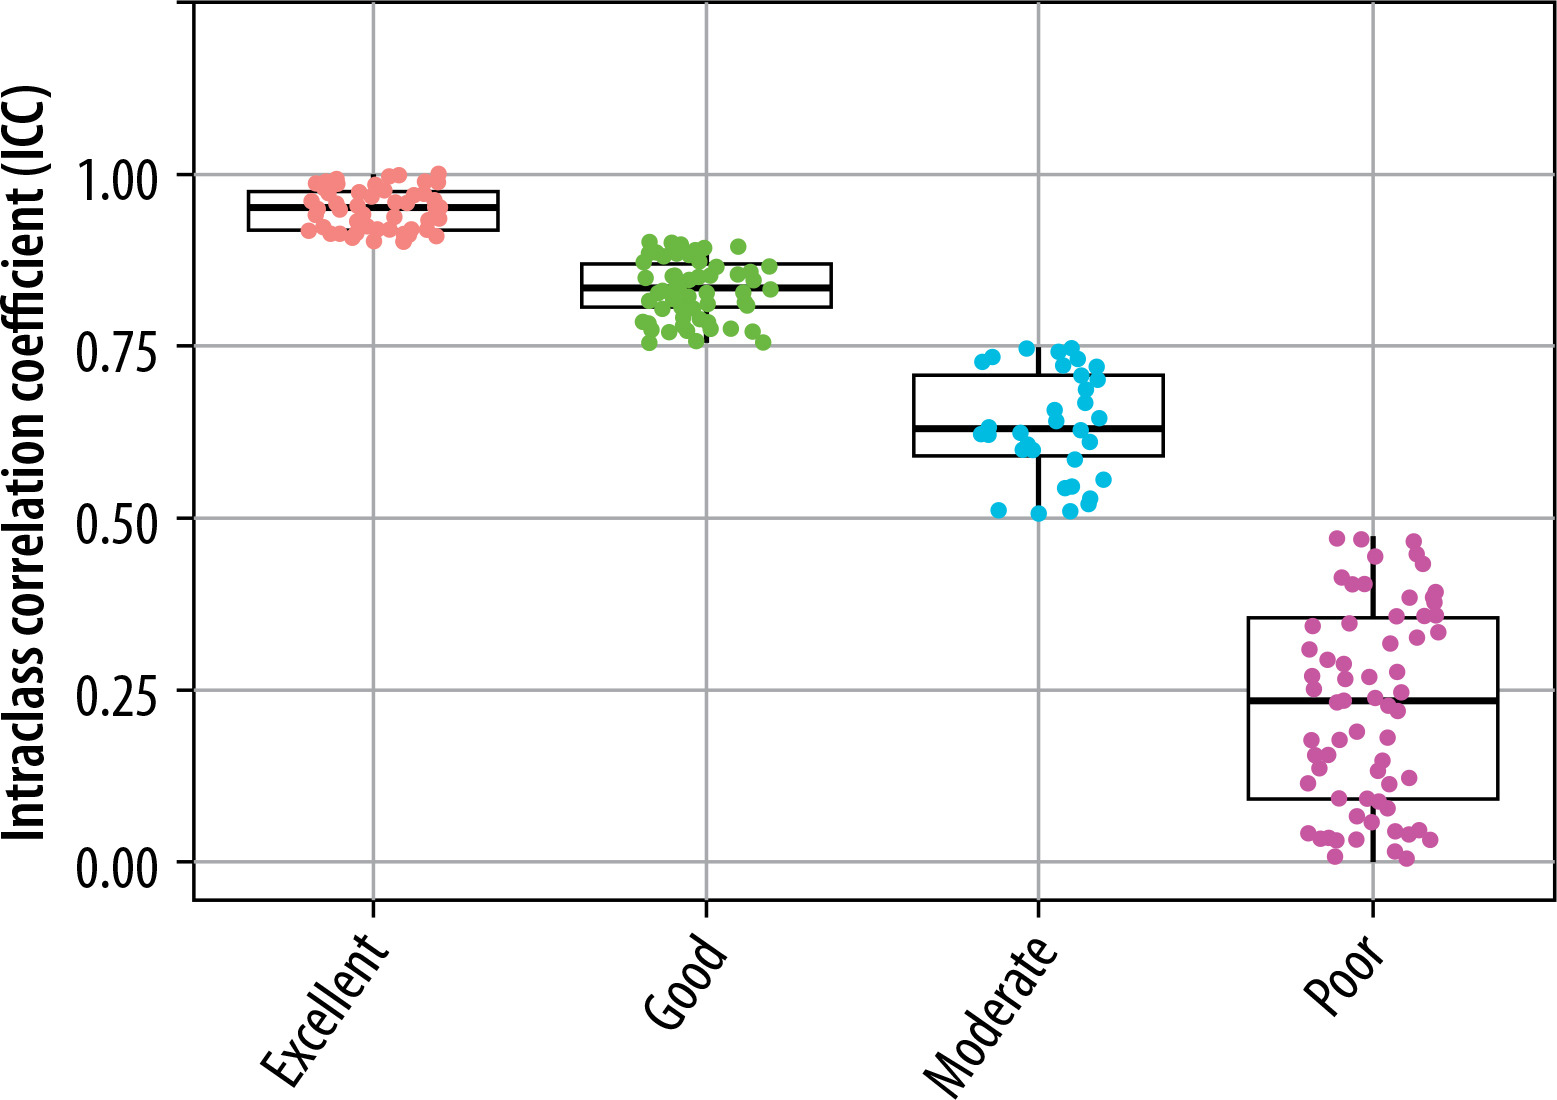
The reproducibility of the RFs was assessed using the ICC with specific parameters, including two-way random effects, absolute agreement, and multiple raters or measurements. The ICC is a commonly used metric for evaluating the reliability and agreement between continuous variables in reproducibility studies, providing a ratio between 0 and 1. Based on the ICC value, reliability is classified as poor (ICC < 0.5), moderate (0.5 ≤ ICC < 0.75), good (0.75 ≤ ICC < 0.9), or excellent (ICC ≥ 0.9). Features with an ICC of 0.75 or higher were deemed reliable and included in further analyses. The ICC was calculated using custom Python code developed in-house. Additionally, Pearson’s correlation coefficient was applied to detect redundant features, with those showing a correlation coefficient greater than 0.9 considered redundant. Consequently, features exhibiting both high reliability (ICC ≥ 0.75) and low redundancy (correlation coefficient ≤ 0.9) were averaged and selected for subsequent analysis.
Machine learning algorithms
The machine learning algorithms utilized in this study include support vector machine (SVM), random forest, neural networks, logistic regression, LightGBM, k-nearest neighbors (k-NN), decision trees, CatBoost, and AdaBoost. These models were selected to represent a broad range of classification techniques, encompassing both linear and nonlinear approaches, as well as ensemble-based methods. SVM and logistic regression were chosen for their effectiveness in linear decision-making, while ensemble methods such as random forest, CatBoost, and AdaBoost were included to evaluate their ability to capture complex patterns. Neural networks were employed to explore the performance of deep learning approaches on feature-extracted data, while k-NN and decision trees were selected for their simplicity and interpretability. LightGBM, as a gradient-boosting algorithm, was chosen for its speed and adaptability to complex datasets.
For dimensionality reduction, the study employed autoencoder, isomap, kernel principal component analysis (kernel PCA), laplacian eigenmaps, linear discriminant analysis (LDA), locally linear embedding (LLE), and principal component analysis (PCA). These techniques were selected to explore both linear and nonlinear transformations of the data. Linear methods, such as PCA and LDA, were used for their ability to preserve global variance and maximize class separability, respectively. Nonlinear methods, including kernel PCA, isomap, laplacian eigenmaps, and LLE, were included to assess their capability in capturing complex, manifold-based structures in highdimensional data. Autoencoder, as a neural network-based approach, was employed to learn compact and representative feature spaces. This combination of models and dimensionality reduction techniques provides a comprehensive framework for evaluating the interplay between algorithms and feature transformations.
Each machine learning algorithm was fine-tuned using the following hyperparameters: SVM with a radial basis function kernel (C = 1, gamma = 0.1), random forest with 100 estimators and a maximum depth of 10, neural networks with two hidden layers (64 and 32 neurons, respectively) and a learning rate of 0.001, logistic regression with L2 regularization (C = 1), and LightGBM with 200 estimators and a learning rate of 0.05. The CatBoost and AdaBoost ensemble methods were configured with default parameters, with 200 estimators each. For validation, we employed 10-fold cross-validation to ensure the robustness of the models. This approach splits the dataset into ten parts, using nine for training and one for testing, iteratively rotating the test set. Model performance was averaged across folds to mitigate biases due to data partitioning.
Evaluation of models applied
To assess the performance of the classification models applied to prostate data, accuracy and the area under the curve (AUC) of the receiver operating characteristic (ROC) curve were used as primary evaluation metrics. Accuracy measures the proportion of correctly classified instances, providing an overall indication of model performance. AUC, on the other hand, evaluates the discriminatory ability of the models by quantifying the trade-off between the true positive rate (sensitivity) and the false positive rate across different classification thresholds. A higher AUC value indicates better performance in distinguishing between positive and negative classes. These metrics were selected to offer both a straightforward evaluation of overall correctness (accuracy) and a more detailed understanding of the models’ ability to differentiate between classes (AUC). This dual approach ensures a robust evaluation of model effectiveness across various dimensionality reduction techniques and classification algorithms. The for-mula for accuracy is:
where TP, TN, FP, and FN represent true positives, true negatives, false positives, and false negatives, respectively.
Results
This study focused on the automatic diagnosis and classification of PCa using tissue characteristics extracted from MRI images, leveraging machine learning algorithms and feature reduction techniques. A cohort of 82 patients was analyzed, divided into two groups: those with prostate tumors (Class I) and those without (Class II). MRI scans, specifically T2-weighted images (T2W) and ADC maps, were used to extract quantitative features. The ViSERA software facilitated the extraction of 215 quantitative radiomic features from each image sequence. These features were processed to differentiate between healthy and cancerous tissues using machine learning algorithms. To ensure the reliability of the extracted features, ICCs were computed to evaluate their reproducibility across different MRI sequences. Features were classified based on their ICC values into four categories: poor, moderate, good, and excellent. Features with ICC values greater than 0.75 were deemed good or excellent and were used in subsequent analyses.
Reproducibility of T2W and ADC map features
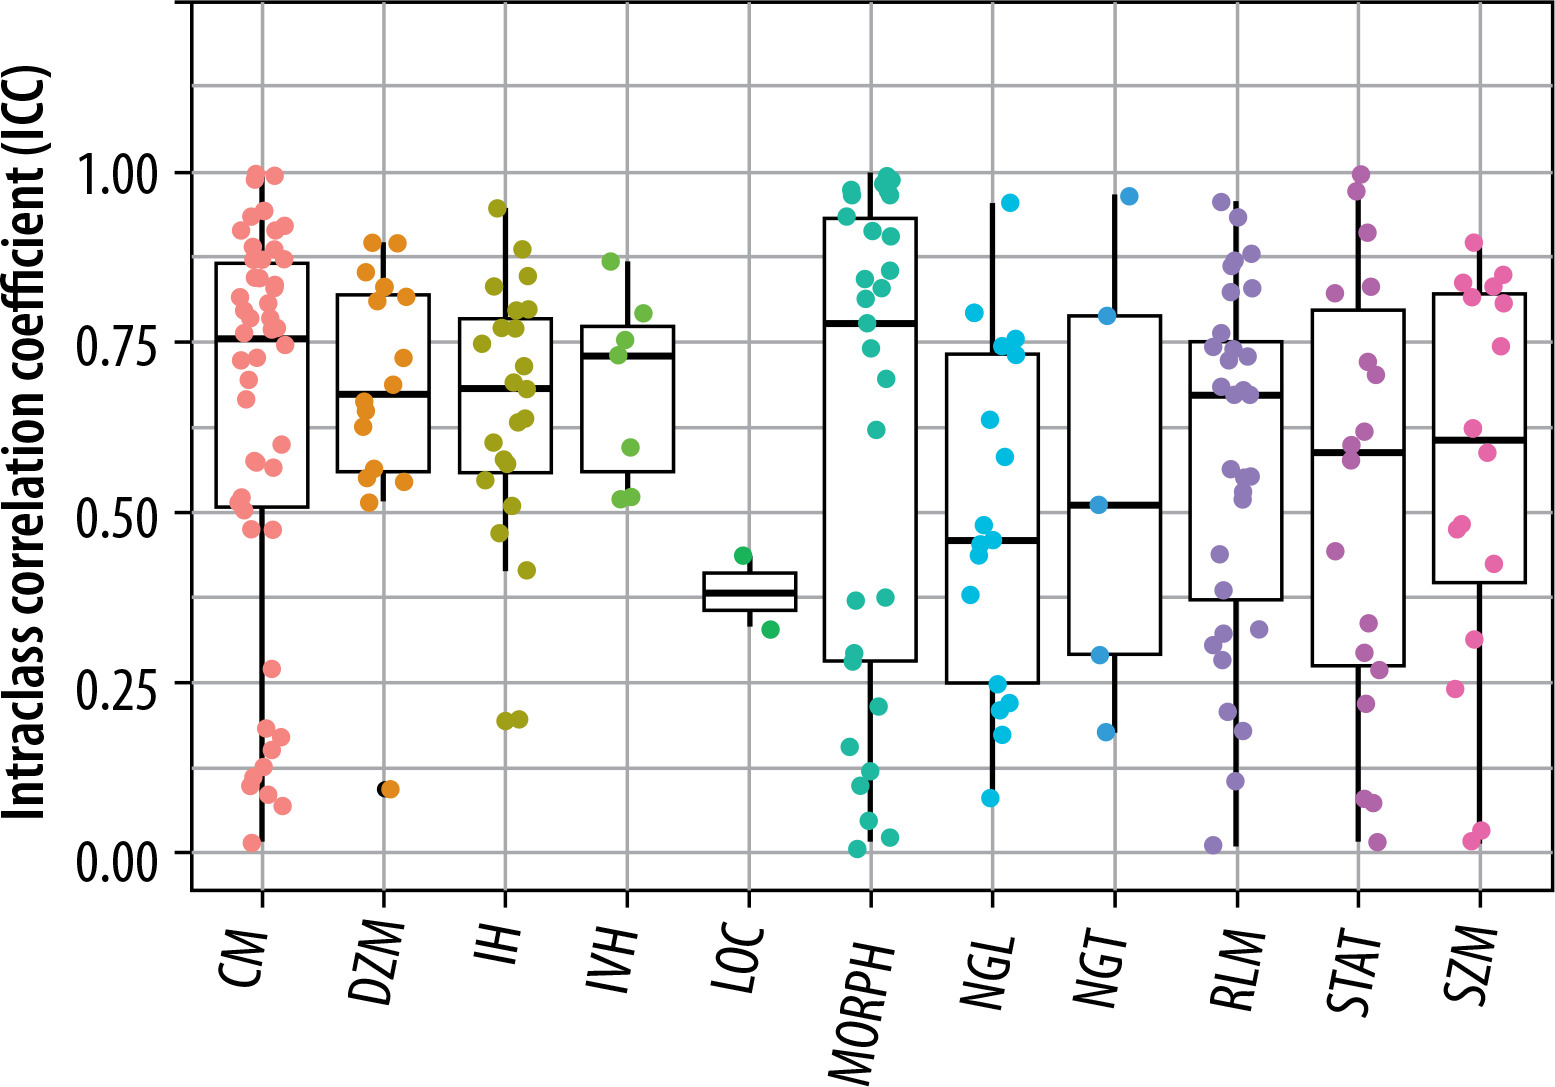
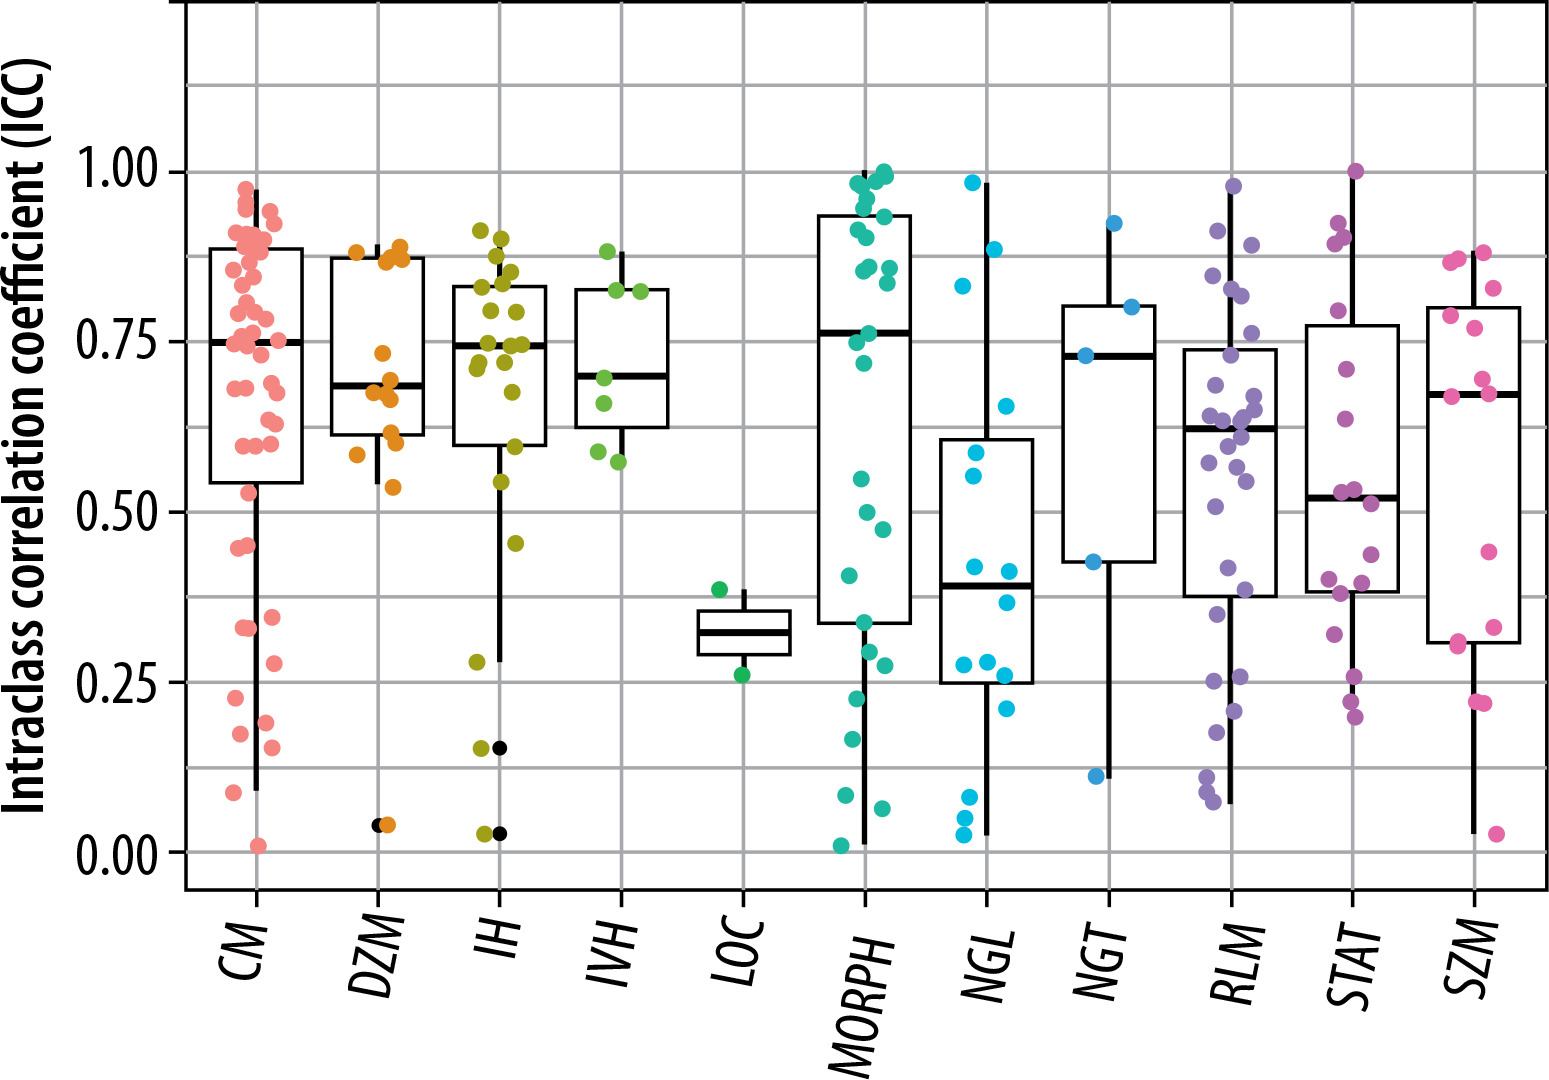
The extracted features were grouped into 11 categories: NGL, NGT, DZM, SZM, RLM, CM, IVH, IH, STAT, LOC, and MORPH. As shown in Figure 2, the distribution of selected features across these groups varied between the T2W and ADC map sequences. For the T2W sequence, the number of selected features in each group was 17, 0, 8, 10, 6, 35, 16, 7, 8, 3, and 7, respectively. In comparison, for the ADC map sequence, the numbers were 15, 0, 5, 8, 3, 25, 8, 6, 6, 2, and 3, respectively. Figures 3 and 4 illustrate the reproducibility of these features, with the horizontal axis representing the radiomic groups and the vertical axis showing the ICC values and their respective quartiles.

Selection of features based on ICC values for T2W sequences and ADC maps
Based on ICC values, four categories of feature reproducibility were established: poor, moderate, good, and excellent. Out of the 215 extracted features for both T2W sequences and ADC maps, those categorized as good and excellent were selected for further analysis. As depicted in Figures 4 and 5, for T2W sequences, 66, 34, 63, and 52 features were identified in the categories of poor, moderate, good, and excellent, respectively. Features in the good and excellent categories (groups 63 and 52) were prioritized for the next phase of analysis (Figure 4). Similarly, for ADC maps, 67, 67, 55, and 26 features were identified in the respective categories, with groups 55 and 26 being optimal for subsequent analysis (Figure 5). In these figures, the horizontal axis represents the four reproducibility categories, while the vertical axis corresponds to the number of features.
Combining selected radiomic features and machine learning classification
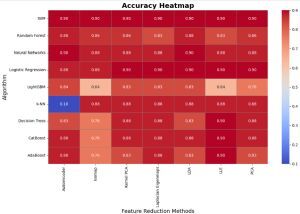
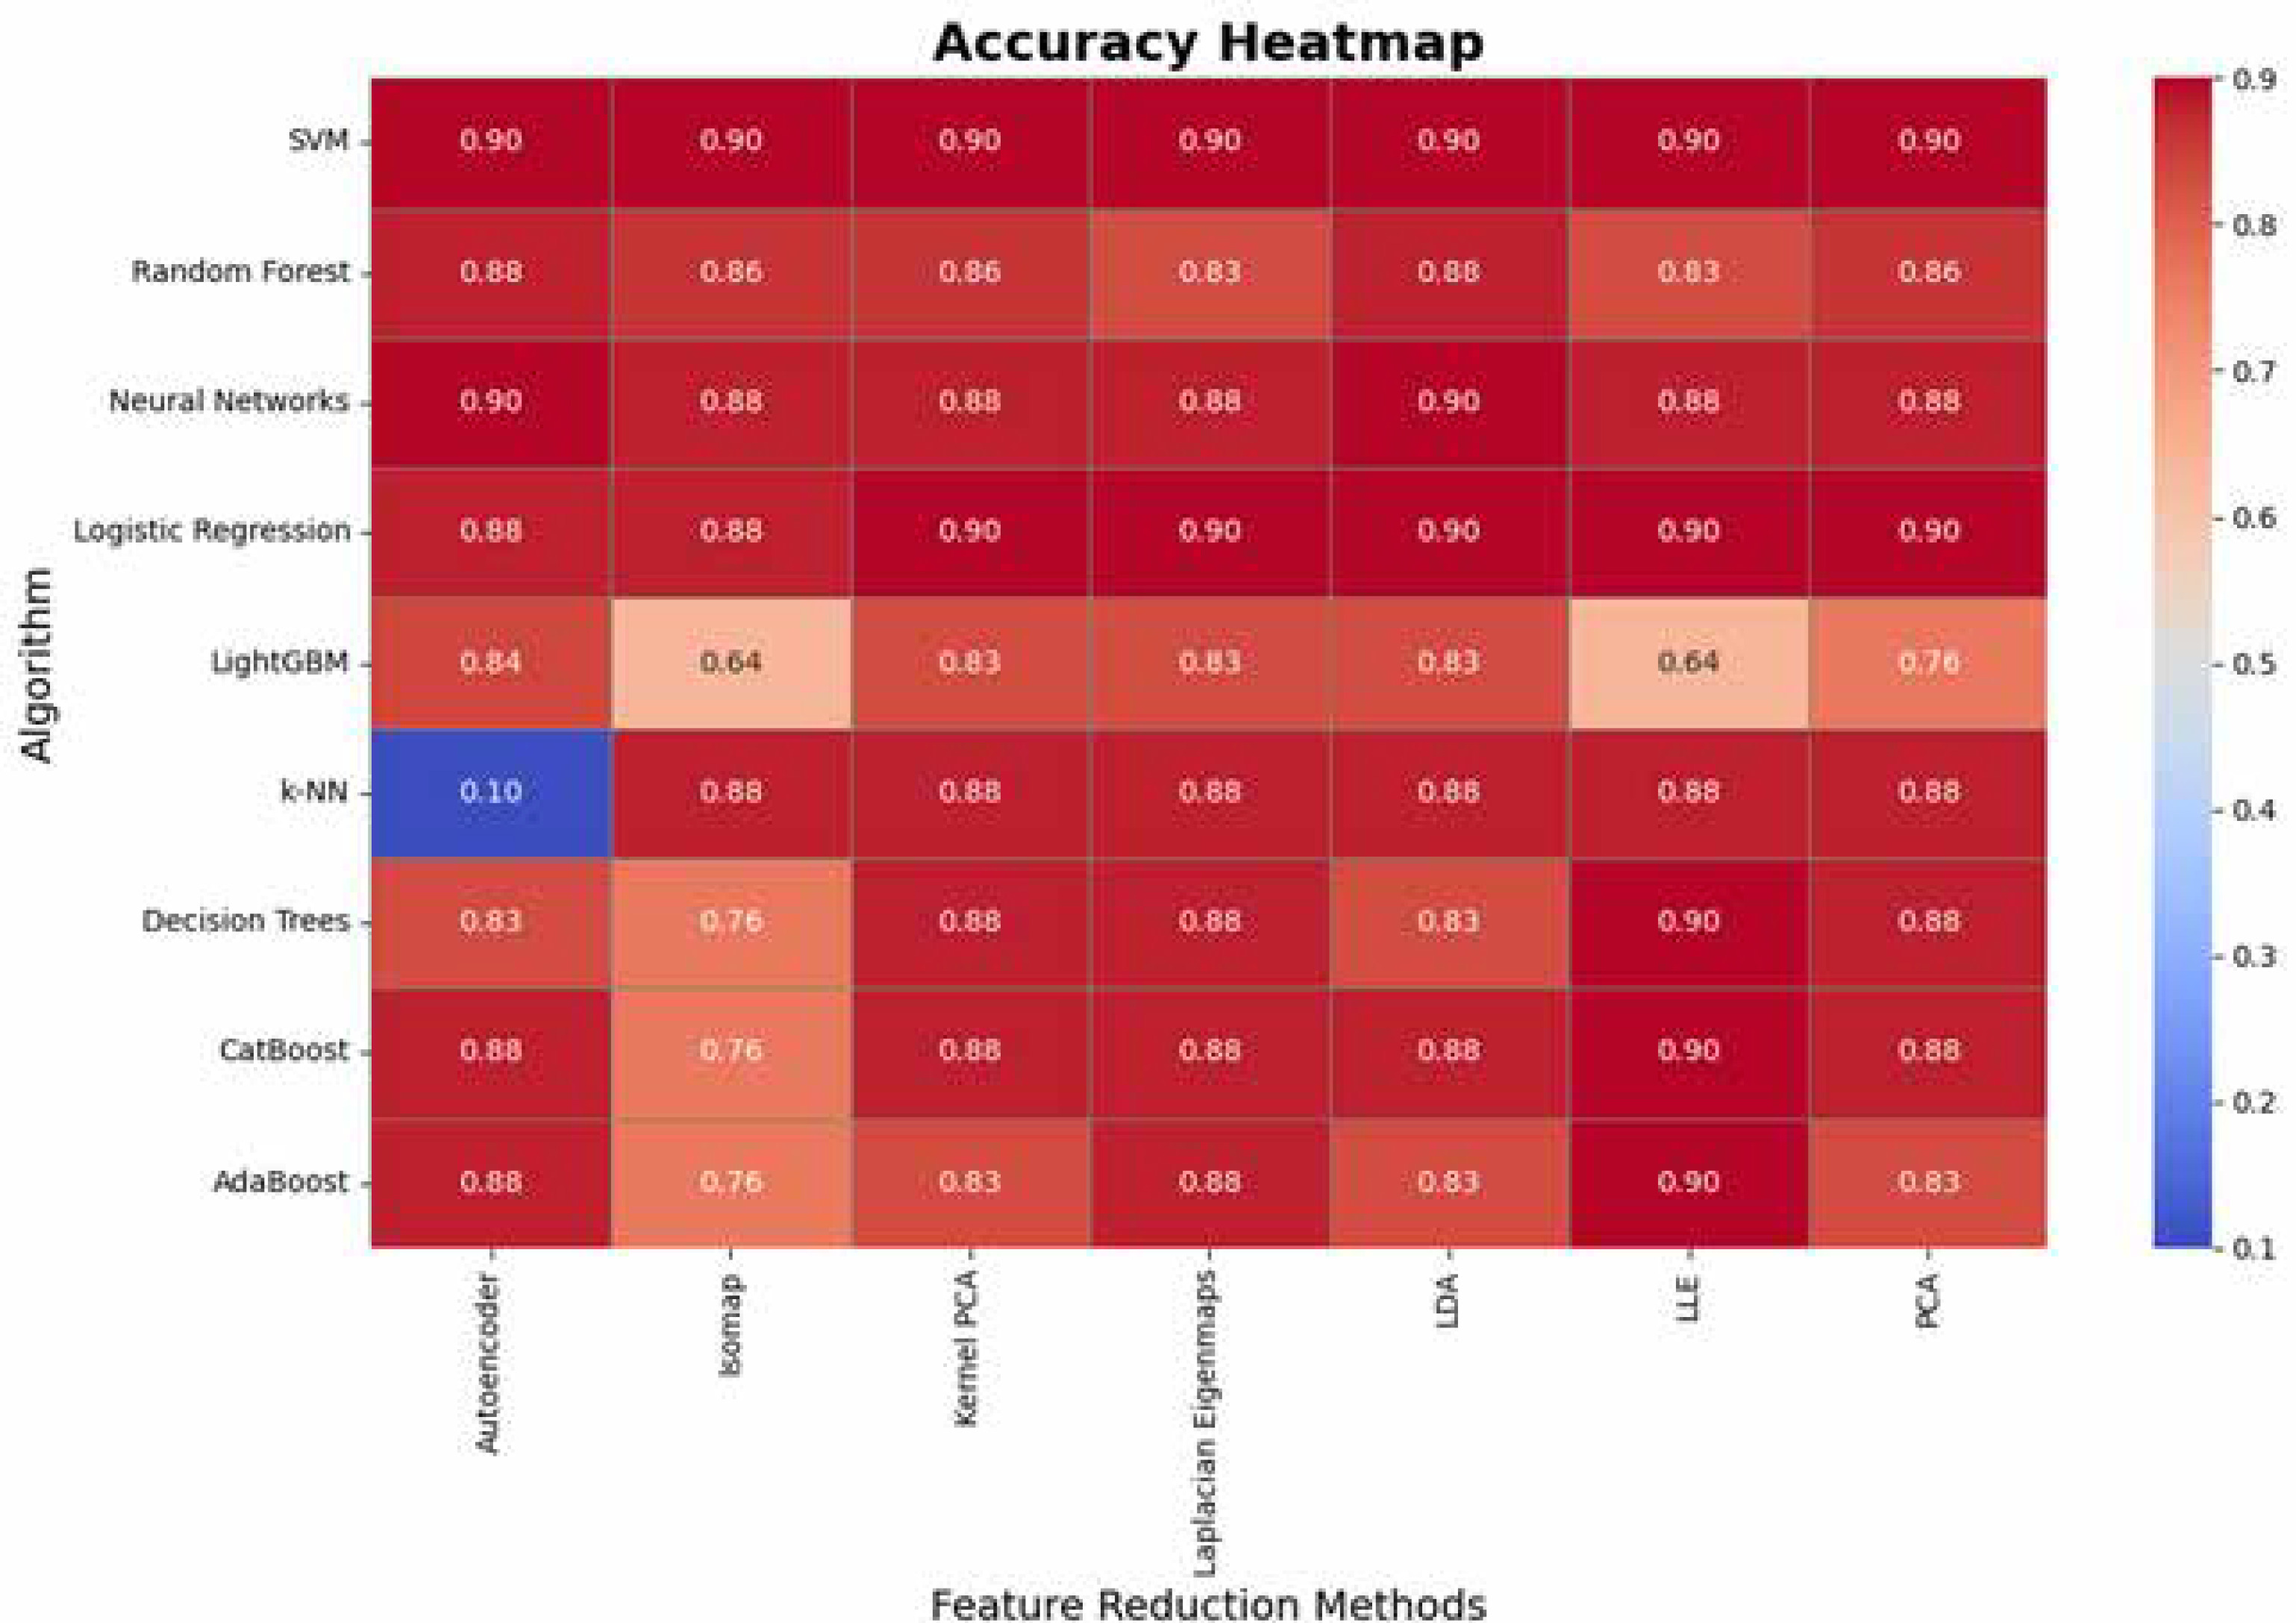
The analysis of accuracy values highlights the robustness of certain algorithms across various dimensionality reduction techniques. SVM, Neural Networks, and Logistic Regression consistently achieve high accuracy (0.88-0.9), demonstrating their adaptability and reliability regardless of feature transformation (Figure 6). PCA emerges as the most effective dimensionality reduction technique, providing high accuracy across all algorithms, while Kernel PCA and Laplacian Eigenmaps also perform well in maintaining accuracy. In contrast, methods like Isomap and LLE introduce significant variability, particularly for algorithms such as LightGBM and AdaBoost, which exhibit lower accuracy (as low as 0.64 and 0.76, respectively). k-NN shows unusual behavior with extremely low accuracy (0.10) for Autoencoder, suggesting sensitivity to specific feature transformations. Overall, the results underscore the importance of aligning algorithm selection with dimensionality reduction methods to optimize accuracy.
Figure 6
Comparison of accuracy across machine learning algorithms and dimensionality reduction techniques
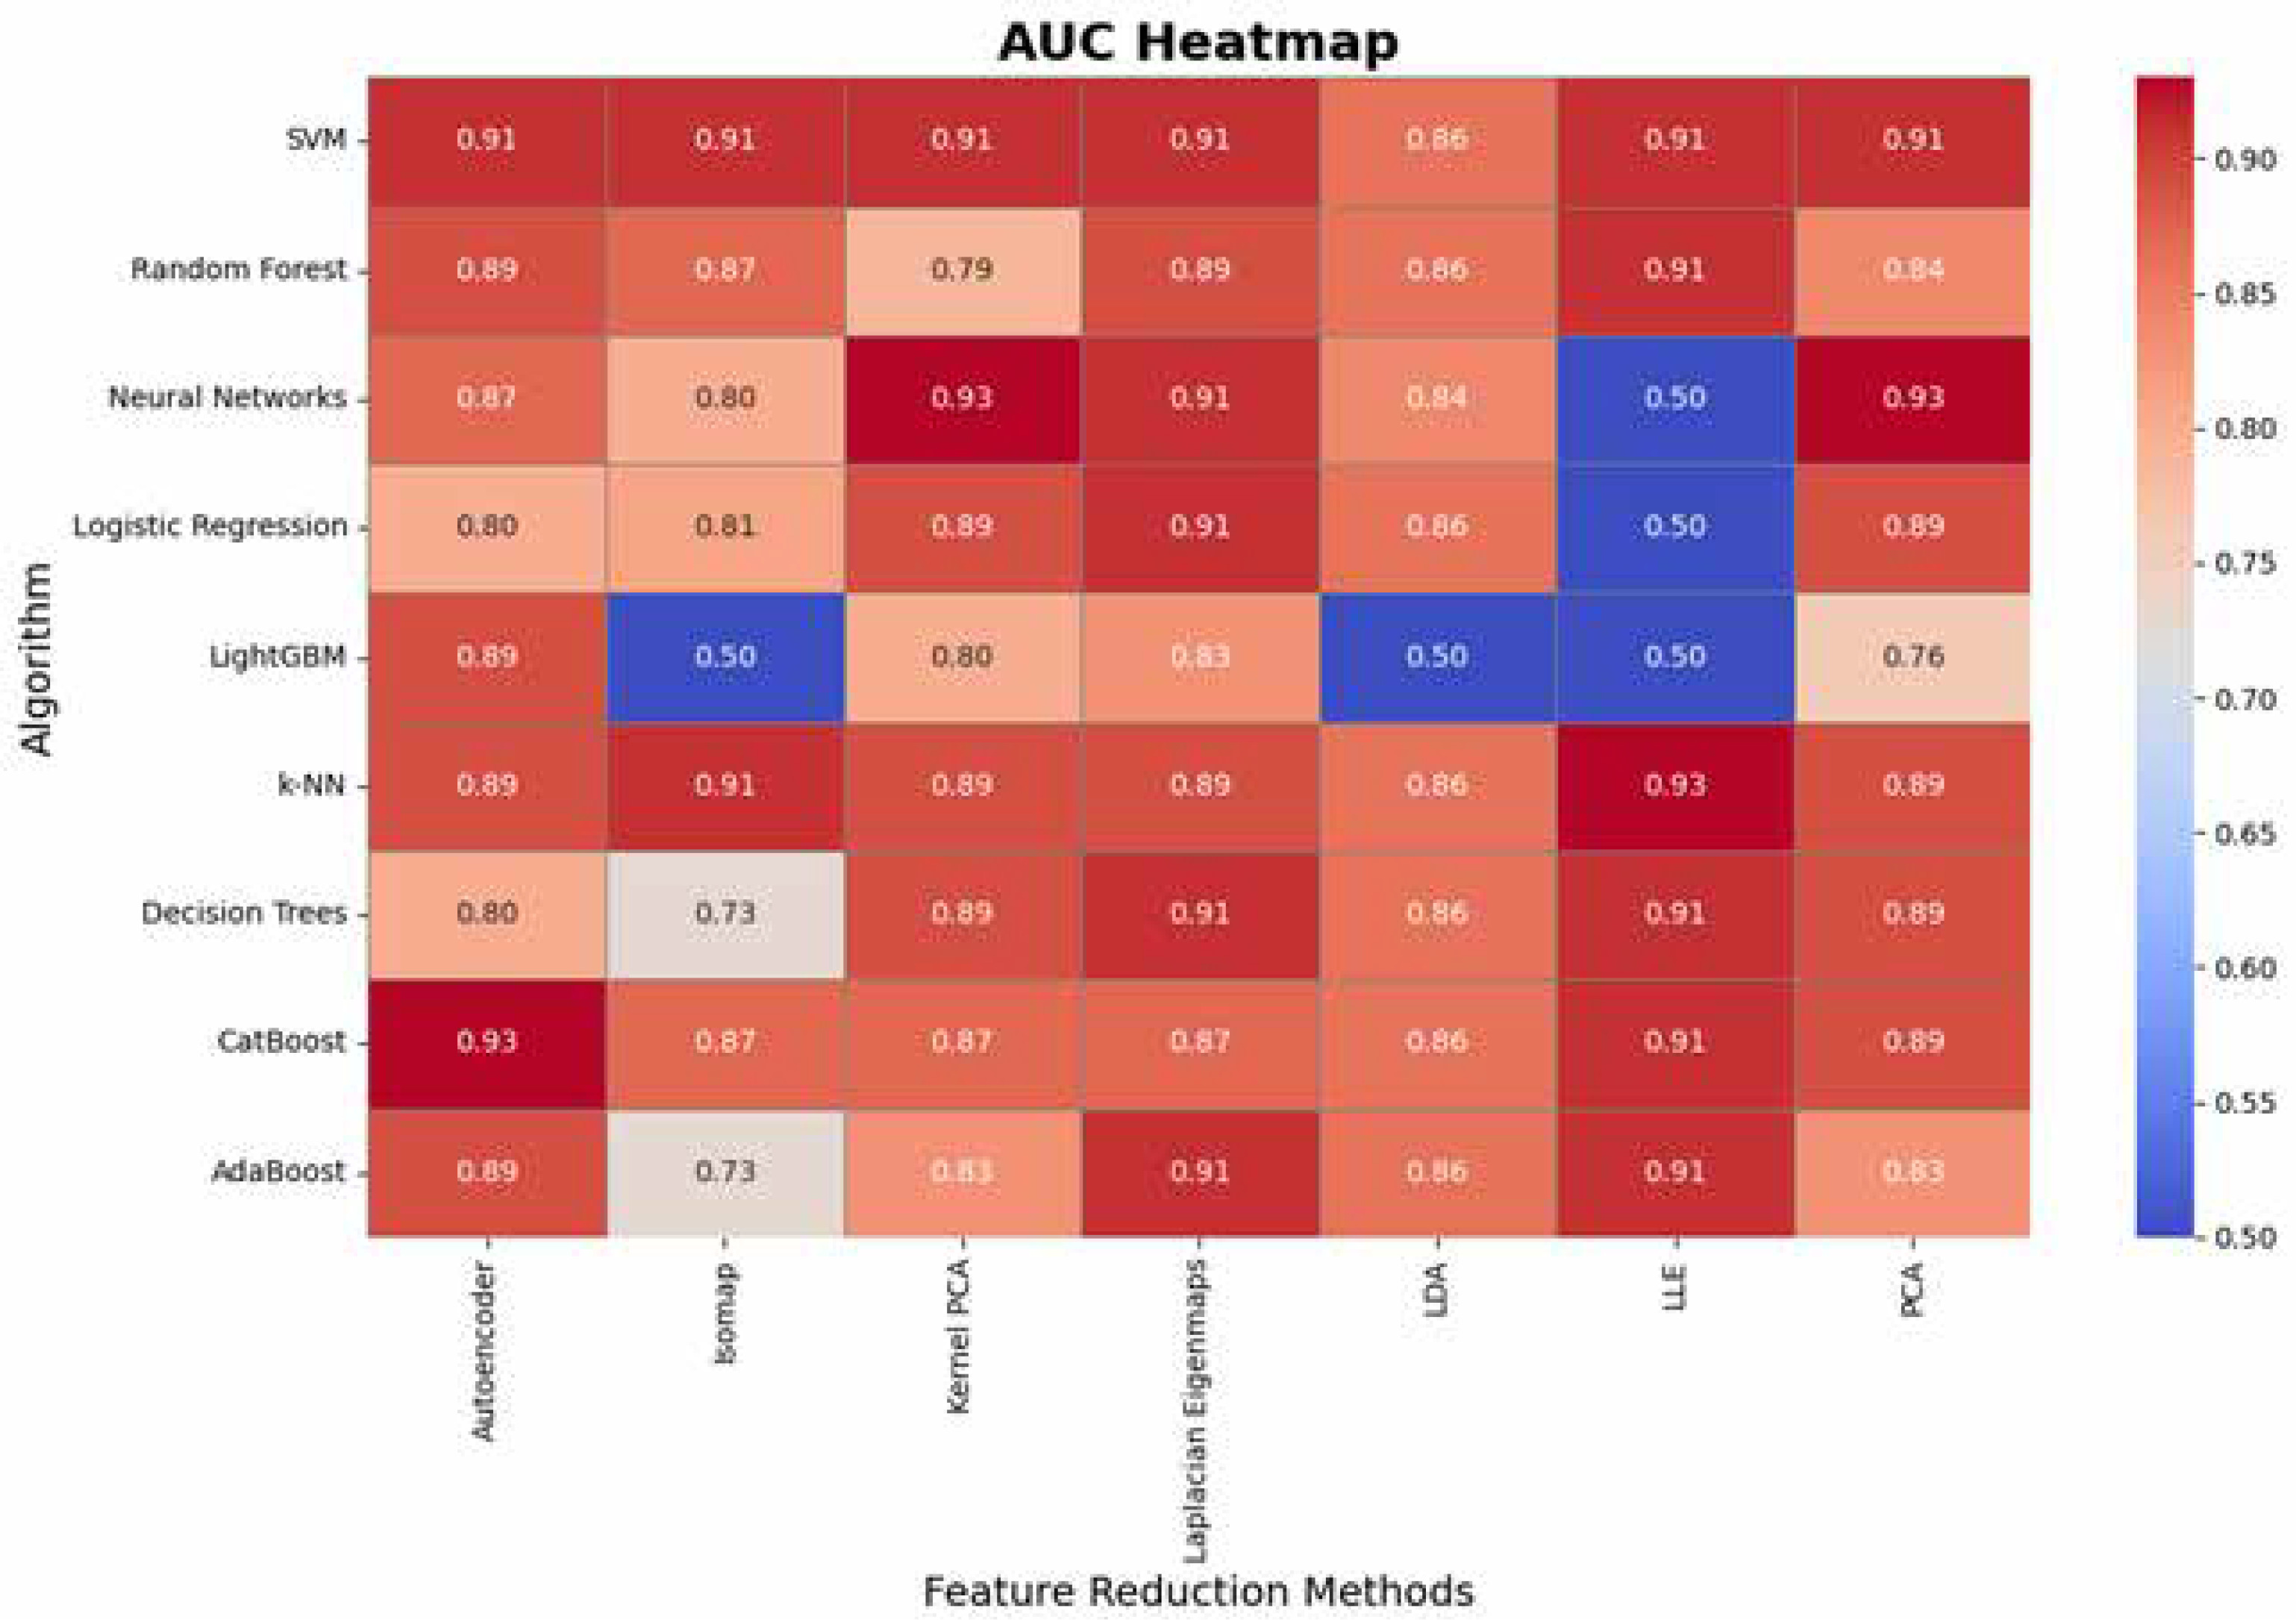
The AUC analysis further reveals important patterns regarding the algorithms’ performance in distinguishing between classes (Figure 7). SVM demonstrates exceptional consistency with AUC values of 0.91 across most methods, while Logistic Regression and CatBoost also deliver strong performance (up to 0.91 and 0.93, respectively). Neural Networks achieve the highest AUC (0.93) with PCA and Kernel PCA but show significant drops (e.g., LLE: 0.5), indicating potential instability under certain transformations. k-NN and decision trees exhibit comparable AUC performance (up to 0.93 and 0.91, respectively) but show variability with LLE and isomap, likely due to challenges in adapting to transformed feature spaces. LightGBM performs poorly in AUC for several methods (as low as 0.50), suggesting sensitivity to the quality of feature representation. These findings reinforce PCA as a reliable preprocessing technique for maintaining strong AUC, while highlighting the need for caution with methods like isomap and LLE, which may compromise the discriminatory power of certain algorithms.
Discussion
PCa is the most common cancer among men and the second leading cause of cancer-related deaths. Traditional diagnostic methods like PSA testing and biopsies have limitations in accuracy and invasiveness. mp-MRI offers a non-invasive alternative with high accuracy, but its interpretation requires significant expertise. To improve diagnostic precision, this study explores the use of AI and machine learning techniques, such as CNNs and texture analysis, to enhance mp-MRI capabilities. The methodology includes preprocessing MRI images, extracting radiomic features, and applying dimensionality reduction techniques like PCA to manage data complexity. Machine learning algorithms, including SVM and random forest etc., are used to classify tumor types. To ensure the reliability of radiomic features, the study employs the ICC to select robust features. This approach aims to improve the accuracy and consistency of PCa diagnostics, enabling more personalized treatment strategies.
Our study and the work by Li et al. [22] both emphasize the potential of radiomics in improving PCa diagnosis. While our study focuses on a balanced cohort of 82 individuals with 215 radiomic features extracted from T2-weighted and ADC map sequences, Li et al. [22] analyzed a larger cohort of 381 patients and used biparametric MRI. Both studies employed machine learning for prediction, but we utilized a broader range of algorithms and dimensionality reduction techniques. In contrast, Li et al. [22] focused on logistic regression models and combined clinical data with radiomics for better prediction accuracy. Both works highlight the diagnostic value of radiomics, but our study further explores feature reproducibility and dimensionality reduction methods. Zhang et al. [23] developed and validated a multiparametric MRI-based radiomics signature to distinguish between indolent and aggressive PCa, extracting 1576 features from T2WI and diffusion-weighted imaging. In comparison, our study focused on a smaller dataset of 82 individuals and extracted 215 features from T2-weighted and ADC map sequences. Both studies utilized machine learning techniques; however, Zhang et al. [23] employed Select K Best and LASSO regression to build their predictive model, while we implemented a broader set of algorithms and dimensionality reduction methods. While Zhang et al. [23] concentrated on classifying PCa aggressiveness, our study aimed at overall diagnostic classification, with a greater focus on feature reproducibility.
Rodrigues et al. [24] explored the development of robust classifiers for predicting PCa aggressiveness by combining handcrafted and deep radiomic features. They tested several training strategies, including removing unstable features based on ICC, averaging features between radiologists, and using heterogeneous datasets from radiologist-segmented masks. In contrast, our study focused on feature reproducibility and dimensionality reduction in a balanced dataset of 82 patients. While Rodrigues et al. [24] integrated deep learning features alongside handcrafted ones, we exclusively used radiomic features extracted from MRI sequences. Both studies highlight the challenges of overfitting and variability, but our approach emphasizes radiomic feature stability, whereas Rodrigues et al. [24] found that heterogeneous data training improved classifier robustness.
Khanfari et al. [25] introduced a novel multi-flavored feature extraction approach, combining radiomics and deep features from four mpMRI images using eight fusion techniques, creating 52 datasets per patient. In contrast, our study focused on a smaller dataset of 82 individuals, with radiomic features extracted from T2-weighted and ADC sequences. While Khanfari et al. [25] leveraged a wide range of fusion techniques and feature sets, including deep learning, to grade PCa, our study emphasized feature reproducibility and dimensionality reduction in diagnostic classification. Both studies highlight the strength of integrating multiple feature extraction techniques, but Khanfari et al. [25]. observed stronger performance from deep features, while our study remained focused on handcrafted radiomic features.
Limitations, challenges, and areas for further investigation in future research
While our study successfully demonstrated the potential of radiomic features and machine learning algorithms for the classification and diagnosis of PCa, several limitations should be acknowledged. First, the relatively small sample size of 82 patients may limit the generalizability of the results to larger and more diverse populations. Additionally, our analysis was confined to two MRI sequences (T2-weighted and ADC maps), and incorporating additional imaging modalities such as DWI or contrast-enhanced MRI could further enhance diagnostic accuracy. Another limitation is the exclusion of clinical data such as patient age, PSA levels, or prostate volume, which could provide valuable complementary information when combined with radiomic features. Future work should focus on expanding the dataset, integrating multi-modal imaging, and incorporating clinical data to improve model robustness. Additionally, exploring more advanced deep learning methods alongside traditional radiomic features could provide further insights into cancer classification and prognosis. Finally, longitudinal studies could assess the effectiveness of these models in monitoring disease progression and treatment response over time.
Conclusions
Our study demonstrates the significant potential of radiomic features extracted from prostate MRI scans combined with machine learning algorithms in enhancing the non-invasive diagnosis of PCa. By focusing on feature reproducibility and employing a diverse range of machine learning models and dimensionality reduction techniques, we have provided a robust framework for distinguishing between healthy and cancerous tissues. While challenges such as small sample size and limited imaging modalities remain, the results underscore the promise of radiomics as a valuable tool in precision medicine. The ability to leverage quantitative imaging biomarkers offers a pathway toward more accurate, personalized treatment strategies for PCa patients. As advancements in AI and imaging technologies continue, integrating radiomic features with clinical data and deep learning models holds great promise for future improvements in cancer diagnosis, prognosis, and treatment planning.