Introduction
Breast cancer is the most frequently diagnosed cancer among women [1,2]. Mammography is widely used for the early detection and diagnosis of breast cancer [3,4]. A significant concern associated with mammographic examination is the potential risk posed by exposure to ionizing radiation [5]. Unlike general diagnostic X-ray machines, which typically are used to scan multiple areas of the patient’s body, mammography targets a single organ, allowing the dose received to be described specifically as an organ dose. Mean glandular dose (MGD) represents the average absorbed dose in the breast glandular tissue [6,7]. MGD is routinely used to quantify the radiation exposure of individuals undergoing mammography [8] and to establish diagnostic reference dose levels for mammographic procedures [9,10]. Additionally, the assessment of MGD for breasts simulated using polymethyl methacrylate phantoms of different thicknesses serves as one of the tests for mammographic devices [11].
The MGD is not a directly measurable quantity. In practice, MGD is determined by multiplying the air kerma (measurable quantity) by the conversion factors. These conversion factors are typically tabulated and depend on the radiation quality (including anode material, filtration, and HVL) and the characteristics of the breast (such as breast thickness and tissue composition). The representation of these conversion factors varies across different studies [6,7,12,13]. In Poland, the formula proposed by Dance et al. [13] is commonly used. The MGD is calculated as the product of air kerma and the coefficients g, c, and s [13]. The factor g is the conversion factor for a typical breast (50% glandularity) and the classic combination of anode and filter material (molybdenum/molybdenum) used in mammography. The factor c corrects for any difference in breast composition, and the factor s corrects for use of a different X-ray spectrum. In models developed in the USA by Wu and Boone, the MGD is calculated by multiplying the incident air kerma by a “normalized average glandular dose”, denoted as DgN [7]. In the recent report of the joint American Association of Physicists in Medicine (AAPM) and the European Federation of Organizations for Medical Physics (EFOMP) working groups, a new spectral conversion coefficient was introduced, denoted as Γ [12]. In this work, to avoid reference to a specific methodology, the conversion factors will be referred to as NMGD,K factors. The NMGD,K factors are derived from Monte Carlo (MC) simulations, and their values are influenced by several factors, including the breast model adopted by the authors of the simulations [7,12,14].
Breast augmentation procedures are commonly performed for both aesthetic and medical reasons (e.g. after breast cancer treatment) [15,16]. These procedures typically involve the use of saline or silicone implants, as well as autologous fat transplantation [17,18]. The NMGD,K factors derived from a standardized model of a typical breast are often applied in cases involving breasts with atypical anatomical structures, including those with neoplastic lesions, cysts, or implants. For example, Fuentes et al. [19] demonstrated that the doses delivered during mammography were higher for women with implants compared with those without implants [19]. However, the MGD values used in their study were taken simply from the radiologist’s viewing screen. These values were probably calculated automatically by the mammography acquisition station software, using NMGD,K factors determined for the standard breast model. This raises concerns that the MGD values calculated in this manner may not accurately reflect the actual dose received by the glandular tissue in the breast with implants. Furthermore, it is well documented that the presence of cysts, which are relatively small compared to implants, induces a variation in NMGD,K factors ranging from –7 to +14 percent [20].
This study aimed to investigate, using MC simulations, whether the presence and type of the breast implant affect the values of the factors used to calculate the MGD. Understanding these effects is crucial for accurately estimating radiation exposure in women with implants, as the standard NMGD,K factors may not fully account for breast augmentation. This could ultimately lead to improved safety protocols and more individualized mammographic dosing strategies for patients.
Material and Methods
Simulation and layout description
The simulations of MGD for different breast implants were performed using the Geant4 Application for Tomographic Emission (GATE) framework [21-23]. Geant4 is a universal package for simulating the passage of particles through matter, and is used, among other applications, in mammography. In particular, Geant4 was used in the recent AAPM/EFOMP report on breast dosimetry [12]. GATE is a Geant4-based tool, originally developed to facilitate tomographic emission simulations. It has since been extended for other medical applications of ionizing radiation, including radiotherapy and computed tomography [21,22], and has been successfully used for mammography [23,24]. The geometry of the simulation is shown in Figure 1, where an X-ray source, aluminum filter, breast model, and ion chamber (used as a radiation detector) were placed in a world of the size of 24 × 18 × 114 cm3.
Figure 1
Illustration of simulation geometry for 60 mm thick breast and 40 mm thick implant. Some elements are only present to model a certain dosimetric variable (see Table 1)
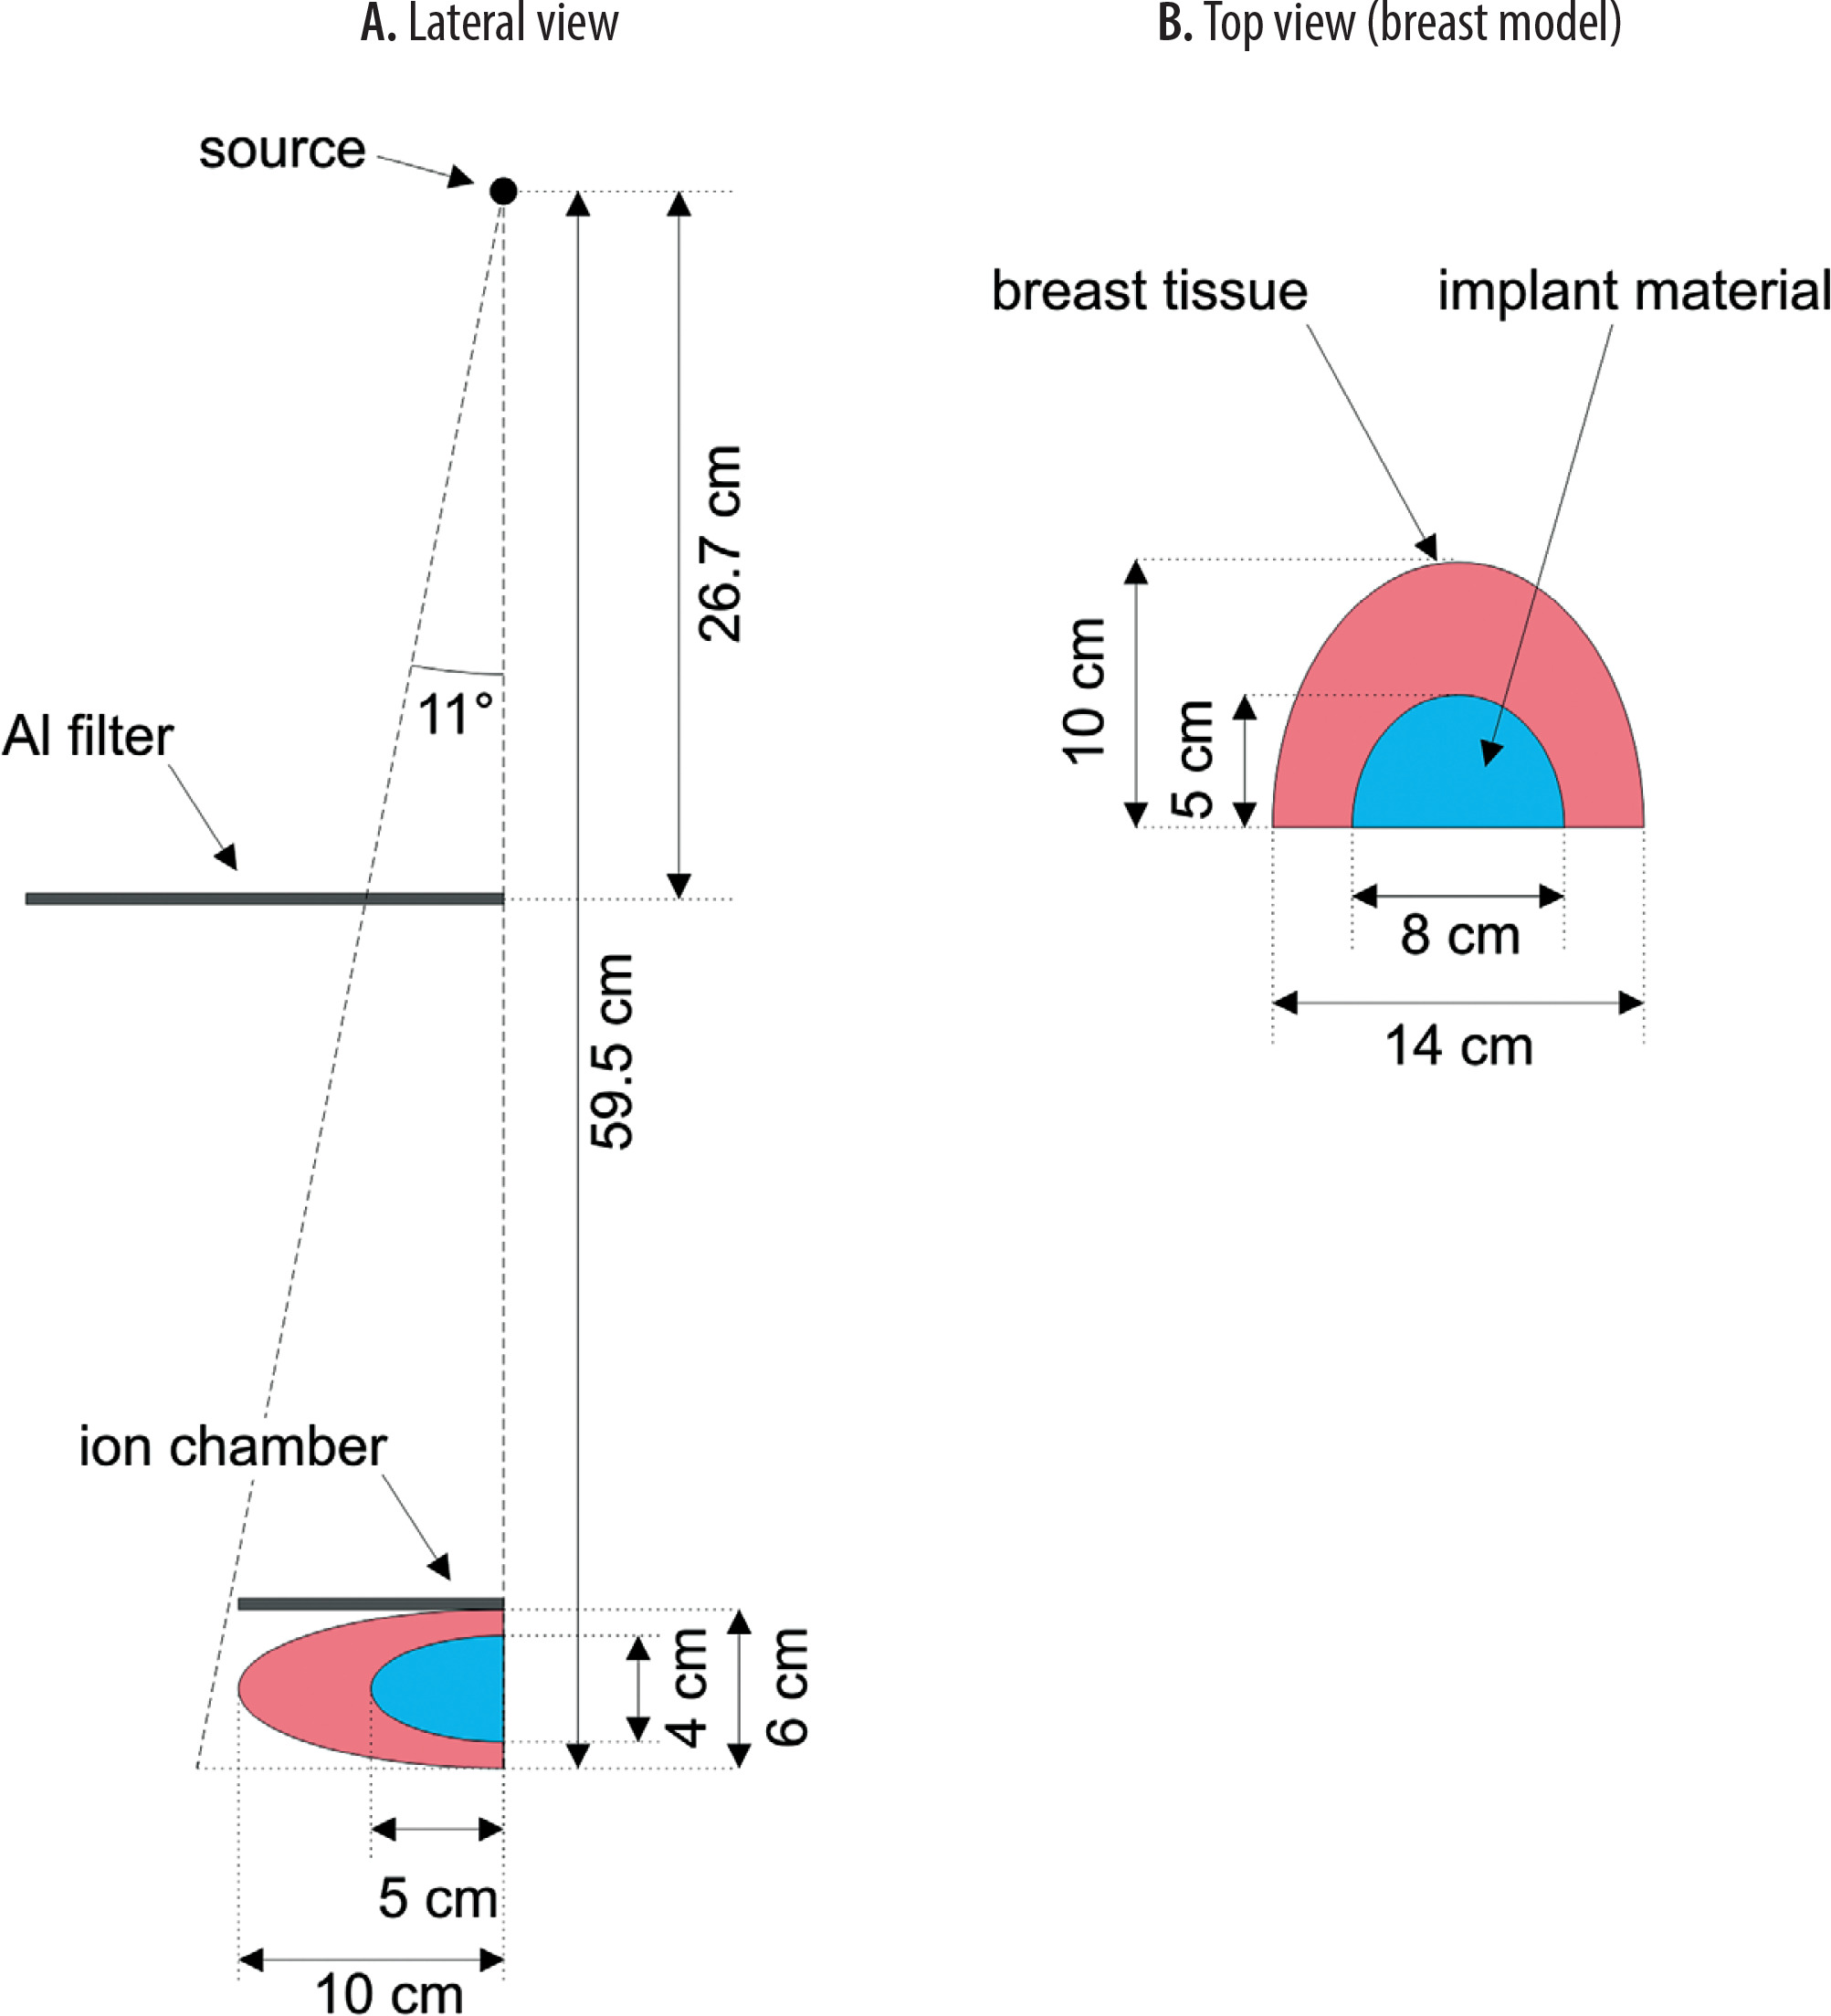
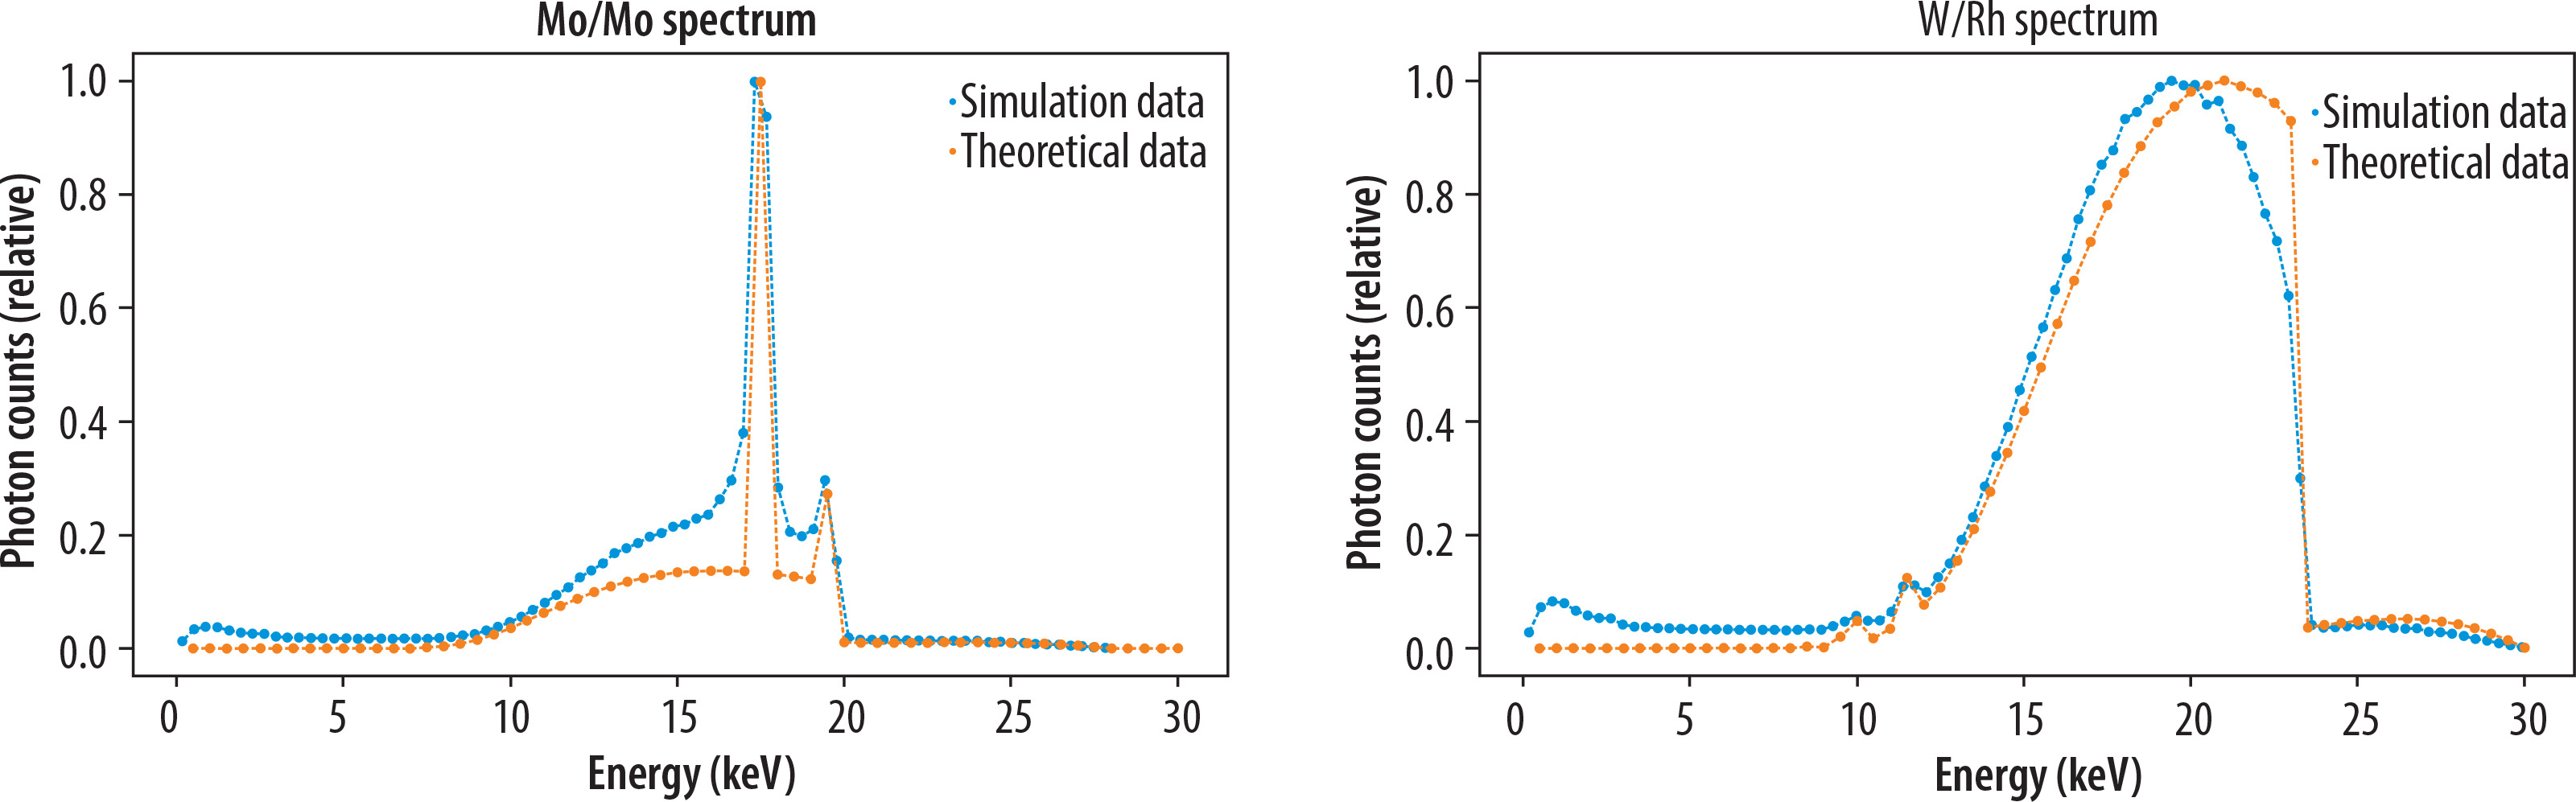
The radiation source emitted photons within an angle range from 0 to 11 degrees with energy spectra characterized by two configurations: Mo/Mo and W/Rh. The Mo/Mo configuration consists of a molybdenum anode with a 30 μm molybdenum filter and a tube potential of 28 kVp, while the W/Rh configuration uses a tungsten anode with a 50 μm rhodium filter and a tube voltage of 30 kVp. The photon energy spectra were derived from the diagnostic spectra catalog [25], and the data were expressed as the number of photons per mAs per mm² at a distance of 750 mm from the focal spot. For use in MC simulations, the spectra were normalized by dividing the photon count at each energy level by the total number of photons in the spectrum. The angular distribution was selected to limit the shape of the radiation field to a circle with a radius of approximately 11 cm in the image detector plane.
An aluminum filter, shaped as a rectangular plate with dimensions 24 cm × 18 cm, was placed 26.7 cm behind the radiation source, with varying thicknesses (as described in section 2.3). The filter plane, oriented perpendicular to the beam, attenuated radiation in the entire simulated area, with the thickness chosen to determine the half-value layer (HVL).
The lower surface of an ellipsoidal breast model was positioned at a constant distance of 59.5 cm from the radiation source. The thickness of the simulated breast ranged from 20 mm to 110 mm. The implant material was located at the center of the breast’s thickness, with its thickness corresponding to two-thirds of the total breast thickness, varying between 20 mm and 73 mm. Figure 1 shows the simulation geometry for a 60 mm thick breast and a 40 mm thick implant. Additionally, the ion chamber was modeled as a rectangular air-filled box with dimensions 5 cm × 5 cm × 0.2 cm, placed at a distance of 53.5 cm from the radiation source, corresponding to the initial surface of the breast. To estimate the air kerma, HVL, and glandular dose, various simulation setups were used, the configurations of which are detailed in Table 1.
Estimation of breast characteristics
The typical thickness of a compressed breast was estimated using real-world data from approximately 4000 diagnostic mammographic exposures performed with two different mammography units (GE Senographe Pristina and Siemens Mammomat Inspiration) at Maria Sklodowska-Curie National Research Institute of Oncology (MSCNRIO) over a period of one month.
The full breast phantom was modeled as an ellipsoid filled with a standard material [26] (referred to as BreastICRU in the GATE framework), with a 1.02 g/cm3 density. Additionally, the simulated breast could include an augmentation, which could consist of either adipose tissue (density of 0.92 g/cm3), saline-water implants (density of 1.0046 g/cm3), or silicone implants (density of 0.96 g/cm3). The composition of all materials is presented in Table 2. In each scenario, the augmentation was modeled as an ellipsoid with two fixed dimensions of 8 cm × 5 cm (see Figure 1B) and variable thickness in the range of 2 cm to 7.3 cm.
Table 2
Content composition of BreastICRU, adipose implant, saline-water implant, and silicone implant material, where d stands for density of the material
Dosimetric quantities
To simulate photon interactions, the quark-gluon string precompound (QGSP) binary cascade (BIC) high precision (HP) physics list was used [27]. Both the Compton effect and the photoelectric effect were included. In all simulations, the energy deposited within a given volume was measured using the DoseActor.
To calculate the kerma (K) in air and to characterize the energy spectrum of the X-ray source, the ionization chamber was simulated. In this configuration, the breast phantom was replaced by an ionization chamber with dimensions of 50 mm × 50 mm × 2 mm. Data on deposited energy and absorbed dose within the air-filled chamber were collected using the DoseActor module in the GATE simulation software. This approach made it possible to simulate and measure air kerma values and determine the spectral characteristics of the sources, under conditions similar to real mammographic measurements.
To calculate a HVL the air kerma was measured with and without aluminum filters of varying thicknesses with an ionization chamber positioned at a height corresponding to the proximal edge of the breast phantom relative to the X-ray source. Aluminum filters were positioned at a distance of 26.7 cm from both the source and the ioni-zation chamber. In our simulation we used the method of interpolating the nearest points:
where K0 is the arithmetic mean of the air kerma measurement, Ka Kb are the arithmetic averages of air kerma measurements for each of the two aluminum filter thicknesses (where
Simulations for the Mo/Mo/28 configuration were performed using 0.3 mm and 0.4 mm aluminum filters, while for the W/Rh/30 configuration, 0.5 mm and 0.6 mm aluminum filters were used. To validate the model, the HVL was measured using the Black Piranha system from RTI (with an uncertainty of ±10%) on the Siemens Mammomat Inspiration at MSCNRIO.
For breasts with implants, the calculation of the glandular dose considered only the energy deposited in the glandular tissue, excluding the contribution from the implant. Specifically, the energy deposited in the implant was subtracted from the total energy deposited in the whole phantom. Given the volume and density of the implant, the glandular dose for each simulation was calculated. The NMGD,K factor was calculated as the ratio of MGD to air kerma:
Kerma was calculated using the deposited energy and the mass of the air in the ionization chamber. The energy deposited in MeV was summed over the entire volume of the ionization chamber. Kerma was then calculated as the ratio of the deposited energy to the mass of the air. The resulting kerma was converted to mGy for reporting.
Statistical analysis
To compare the model’s HVL with experimental data, as well as the tabulated NMGD,K factor values and the obtained results, a 3-sigma test was conducted. The 3-sigma rule, based on the properties of the normal distribution, indicates that approximately 99.7% of data points lie within three standard deviations of the mean. When comparing means, a difference exceeding three standard deviations from the expected variation suggests a statistically significant deviation, likely not attributable to random chance.
A second-degree polynomial model was used to demonstrate the relationship between NMGD,K factor and the breast thickness:
where the coefficients were obtained by fitting the least squares regression model to the simulation data; they were determined to minimize the sum of squares of the residuals, providing the best possible fit to the data.
The fitting accuracy of the multinomial model fitted to NMGD,K factor data was assessed using the root mean square error (RMSE), which quantifies the average error between the observed and predicted values. The RMSE was calculated as follows:
where n is the number of values obtained based on MC simulations, yi the simulated values and
An independent t-test was conducted to compare the mean NMGD,K factor values between the full breast and the (average) filled breast groups across different thicknesses. The test was performed using summary statistics, with means and standard deviations computed separately for each group. Standard errors were derived by propagating measurement uncertainties, ensuring an accurate comparison despite differing sample sizes. This test was chosen to assess whether the observed differences in means between the two groups are statistically significant.
Results
Estimation of breast thickness
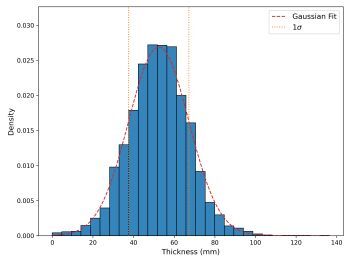
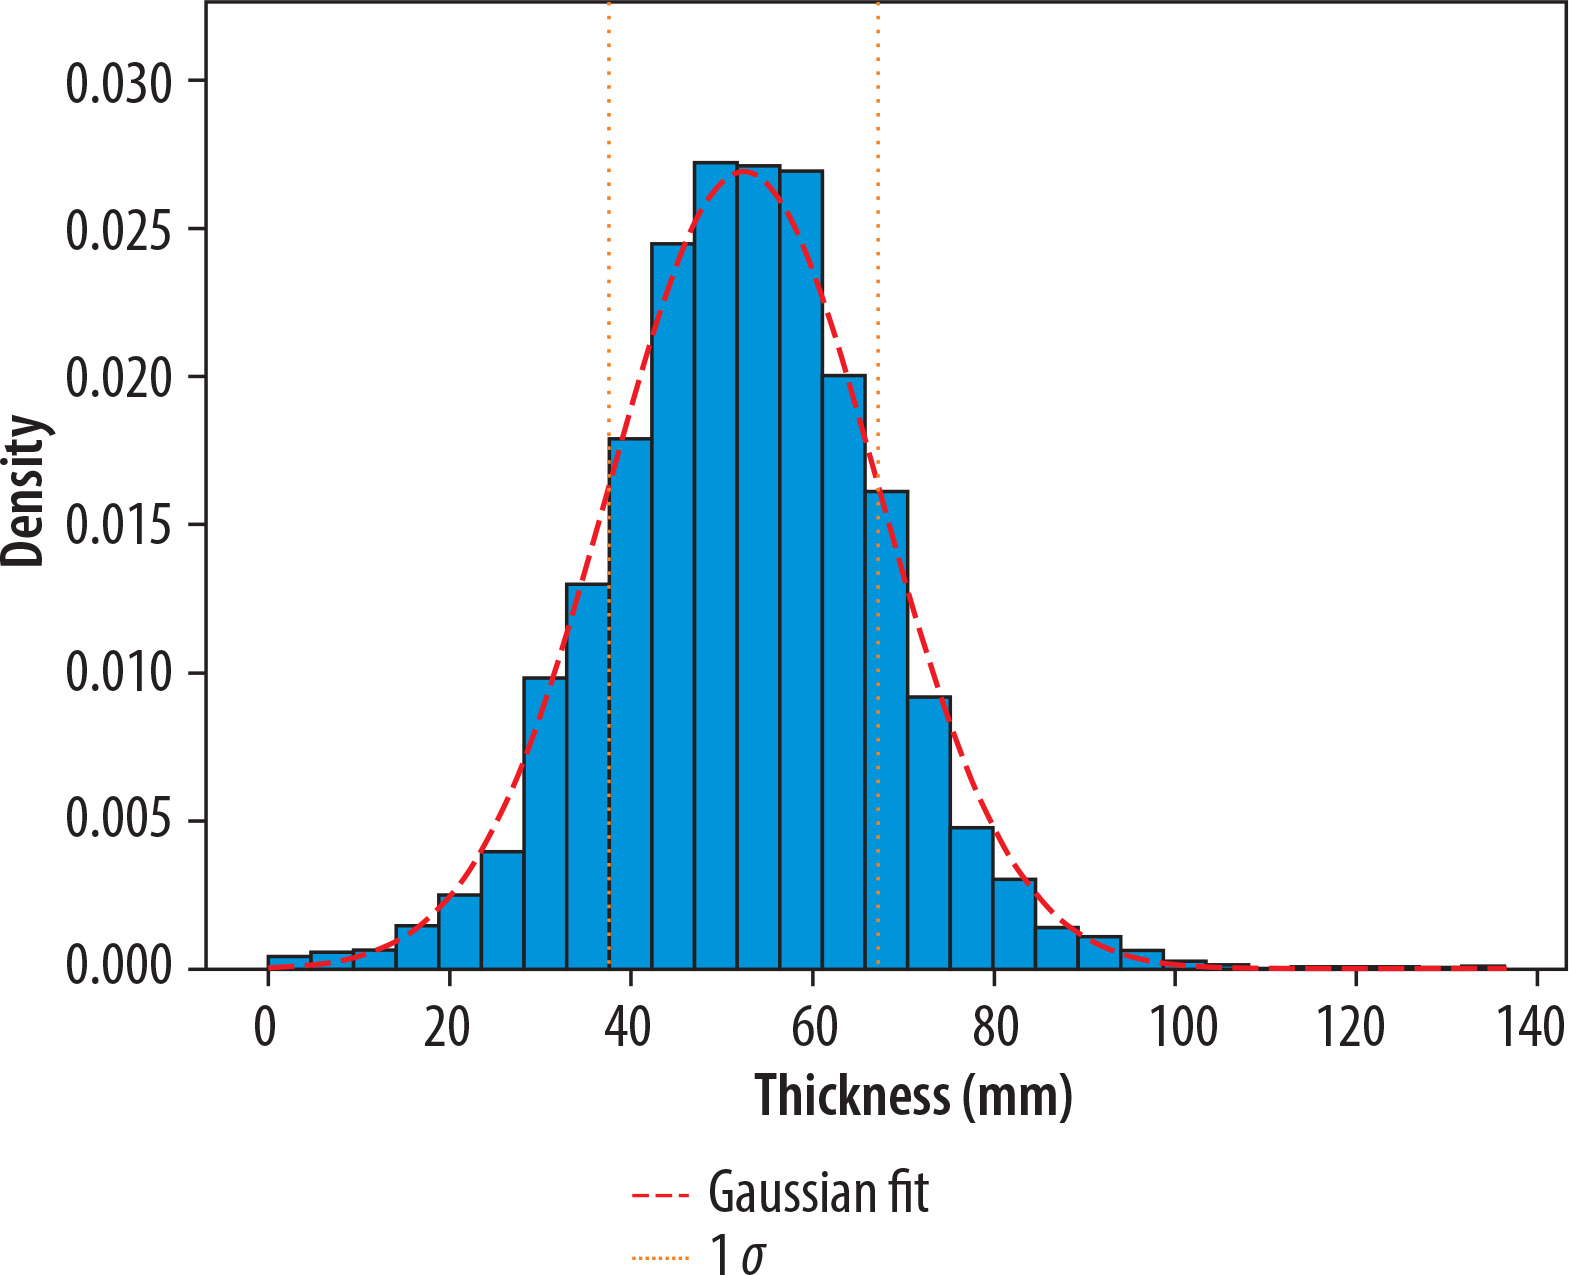
To accurately represent the simulated breast, an appropriate thickness needed to be selected. Data were collected from mammography units at MSCNRIO, specifically the GE Senographe Pristina and Siemens Mammomat Inspiration. Figure 2 illustrates the breast thicknesses, measured in millimeters, for diagnostic mammographic exposures conducted with these units. The thickness values ranged from 0 to 140 mm, with the mean of the cumulative results from both units being 52 ± 15 mm. Based on these data, three breast thicknesses – 40 mm, 50 mm, and 60 mm – were selected, all within one standard deviation of the mean.
Figure 2
Thickness distribution of compressed breast (expressed in mm) for diagnostic mammographic exposures performed using two mammography units (GE Senographe Pristina and Siemens Mammomat Inspiration) in MSCNRIO over a period of one month. The red dashed line represents the Gaussian fit for gathered data and the yellow lines are indicative of a range ^of one standard deviation from the mean
Verification of MC model
Energy spectrum
Figure 3 presents data from MC simulations for the Mo/Mo and W/Rh energy spectra, which are in agreement with the theoretical data. Two characteristic peaks corresponding to molybdenum filtration are clearly observed [28]. Deviations in the data, as shown in Figure 3, may arise from computational inaccuracies in the model and the particle interactions considered in the QGSP BIC HP physics list. The simulation data points include uncertainties derived from a Poisson distribution, calculated based on the total number of simulated particles (1,000,000 events for spectrum counting). The average Poisson uncertainty across all energy intervals is approximately 10-5, highlighting the high statistical precision of the simulated data. This uncertainty was carefully propagated through a normalization process to ensure an accurate representation of the relative intensity distribution, allowing for a reliable comparison between simulated and theoretical results. The RMSE value for the Mo/Mo configuration was 0.0602, while for the W/Rh energy spectra, it was 0.0766, indicating good agreement between the MC simulations and the theoretical data.
HVL
The simulation results of HVL and experimental measurements were compared using a 3σ test and shown in Table 3. For the Mo/Mo configuration, the absolute difference between the simulation results and measurements was 0.016 mm Al, which falls within the 3σ uncertainty range (± 0.12 mm Al). For the W/Rh configuration, the absolute difference between the simulation results and measurements was 0.010 mm Al, which falls within the 3σ uncertainty range (± 0.09 mm Al). For both Mo/Mo and W/Rh configurations, no statistically significant difference was observed between the experimental measurements and MC simulations, suggesting that the simulation model provides an accurate representation of the physical system within the specified uncertainties.
G factor calculations
Figure 4 demonstrates the trend in Mo/Mo configuration of the NMGD,K factor decreasing as breast thickness increases for all augmentation types. Adipose tissue shows the highest NMGD,K factor values, while the values for the full breast model are consistently lower across the entire range of thicknesses.
Figure 4
NMGD,K factor values as a function of breast thickness (in mm) for different augmentation types: adipose tissue, saline-water implants, silicone implants, and full breast models. Results correspond to the Mo/Mo target/filter configuration, commonly used in mammographic imaging. Uncertainty bars represent the standard deviation of measurements
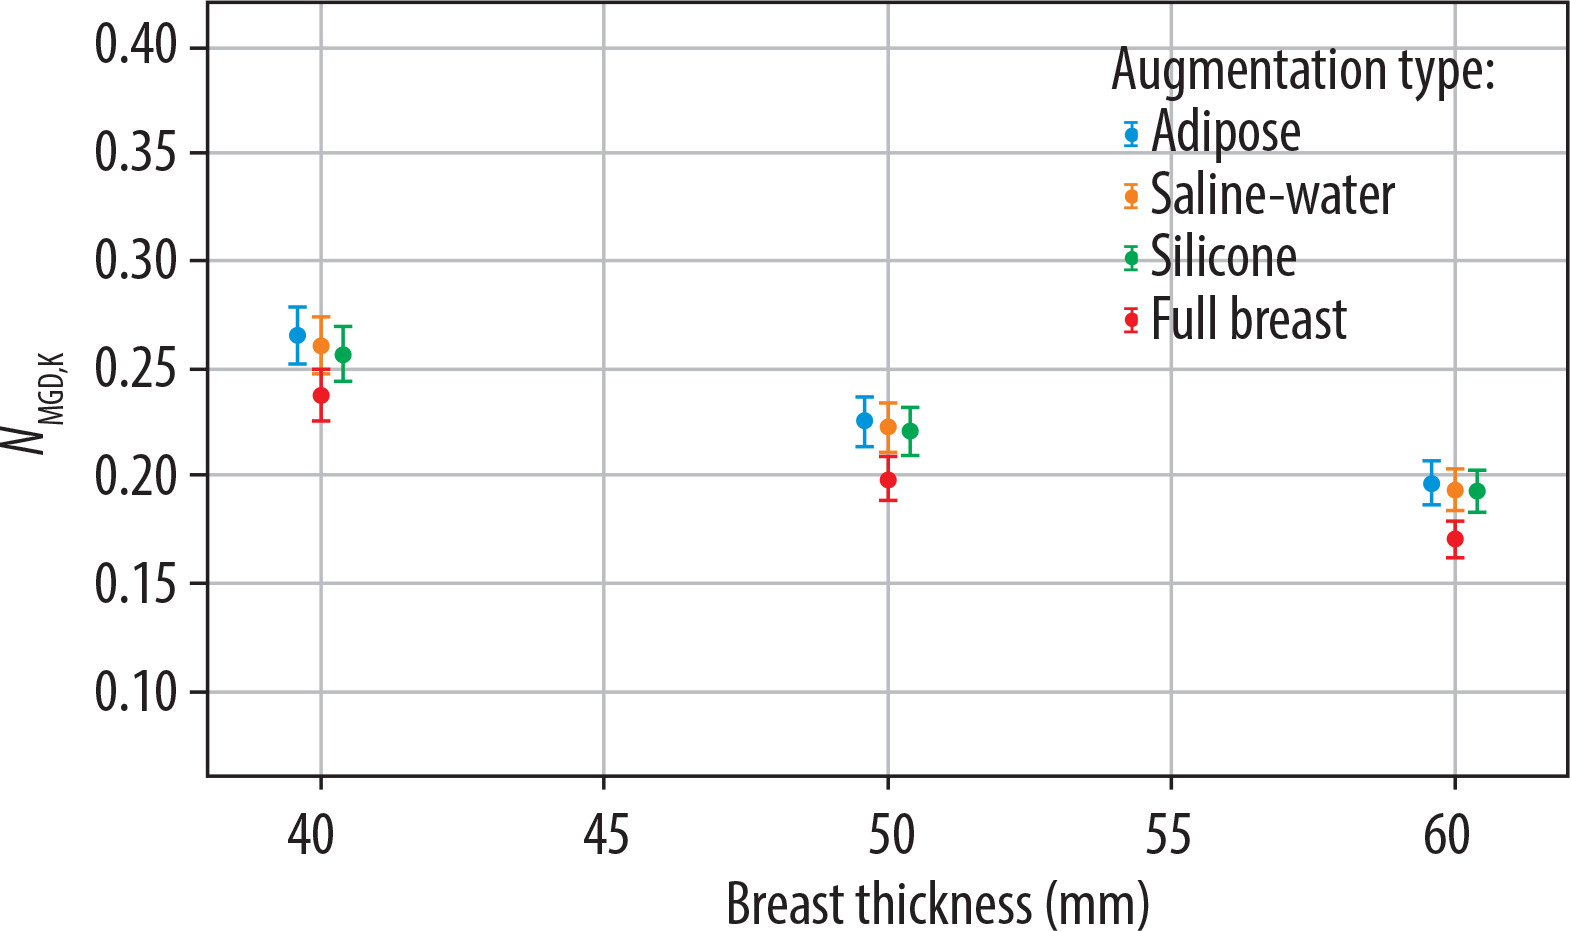
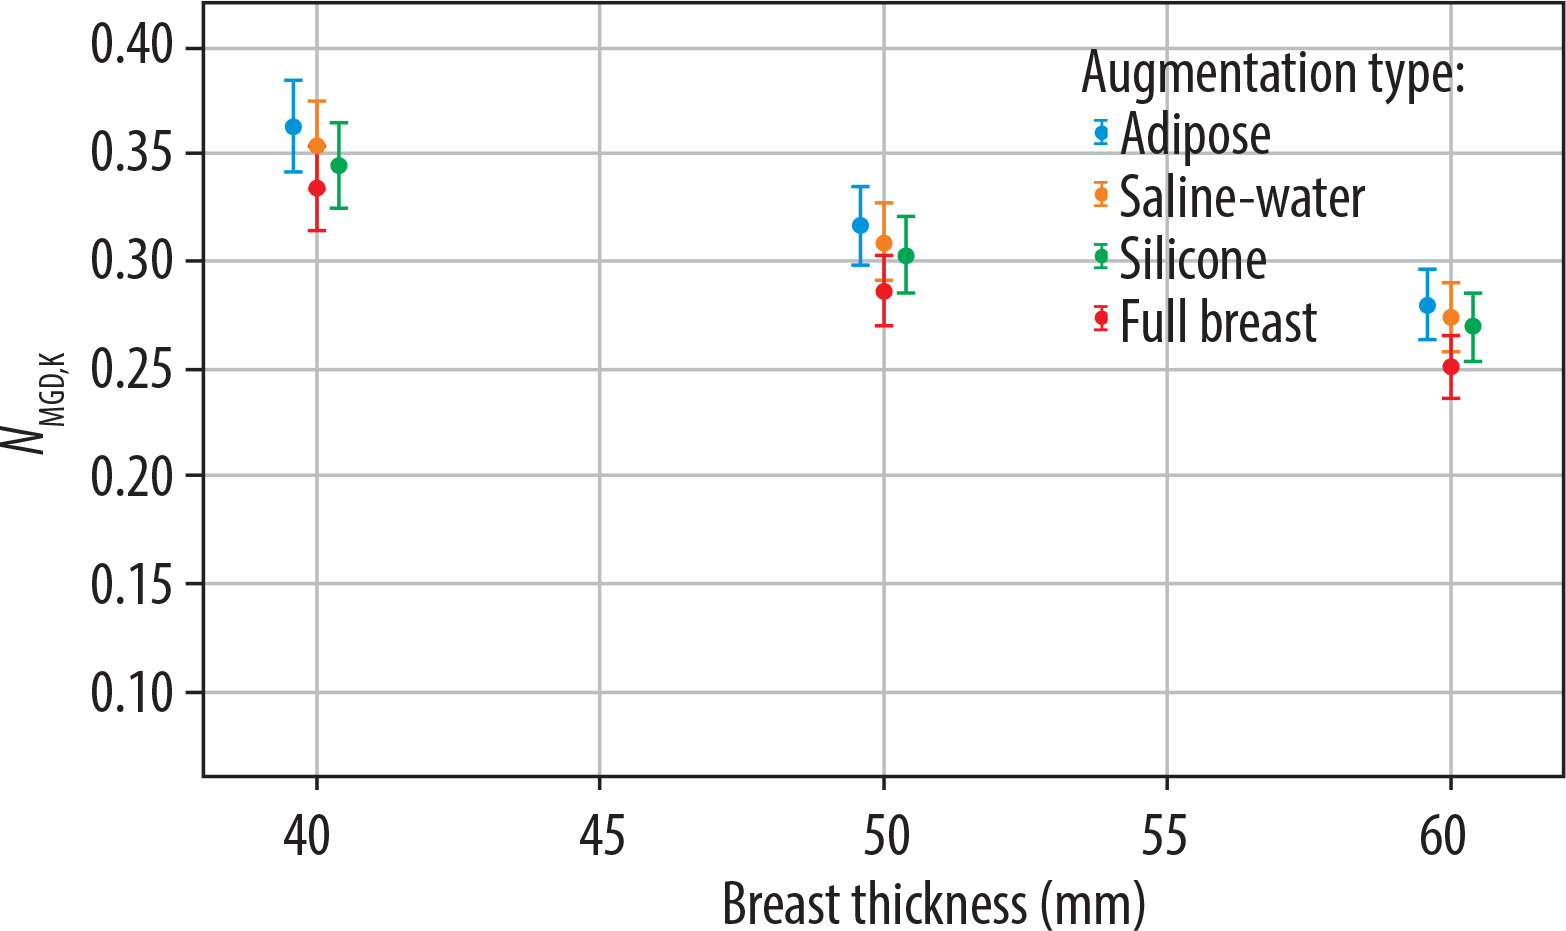
Figure 5, illustrating the W/Rh configuration, shows a trend similar to that of the Mo/Mo configuration, with the NMGD,K factor decreasing as breast thickness increases.
Figure 5
NMGD,K factor values as a function of breast thickness (in mm) for different augmentation types: adipose tissue, saline-water implants, silicone implants, and full breast models. Results correspond to the W/Rh target/filter configuration, commonly used in mammographic imaging. Uncertainty bars represent the standard deviation of measurements
Full breast
Based on data presented in Figures 4 and 5, the polynomial models were used for curve fitting, and fits are presented in Figure 6.
Figure 6
NMGD,K factor as a function of breast thickness (in mm) for full breasts and the average of breasts with implants (including adipose tissue, saline-water, and silicone implants) models. Results correspond to the Mo/Mo configuration (left panel) and W/Rh configuration (right panel). A second-degree polynomial fitting has been applied to the data points to illustrate the trend. Uncertainty bars represent the standard deviation of measurements
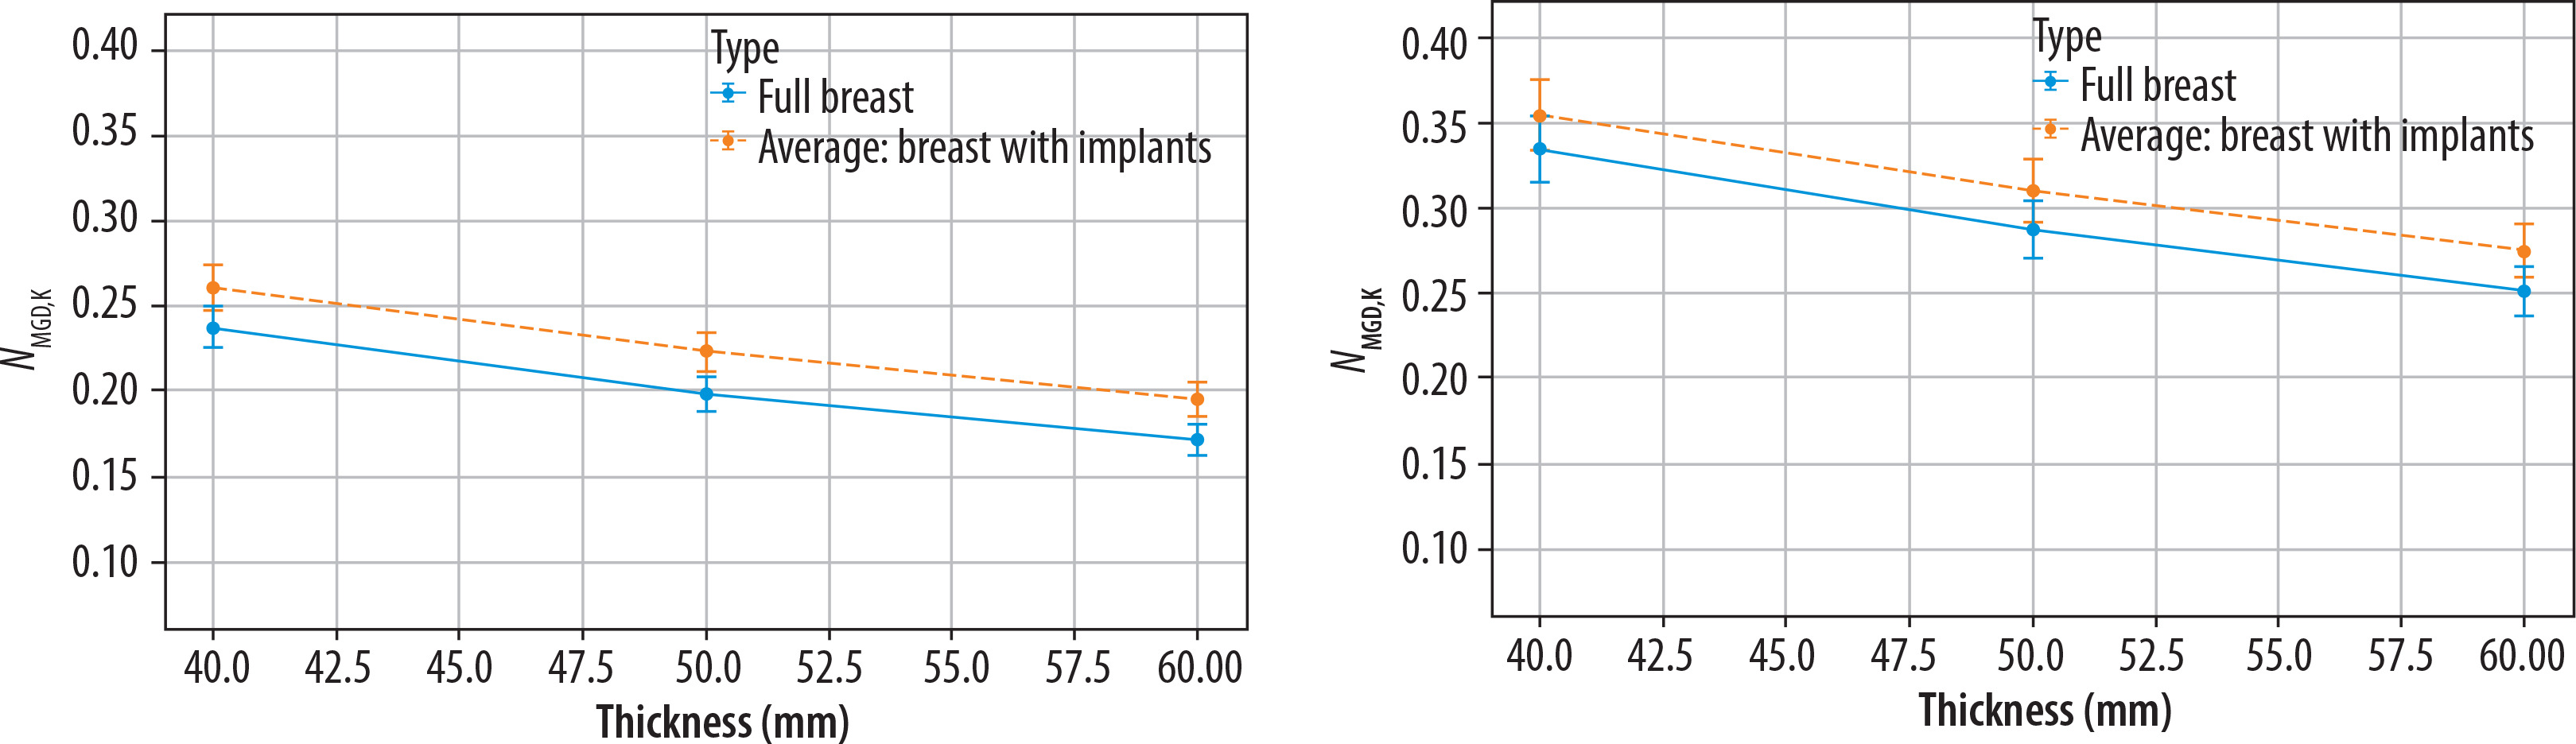
The goodness of the fit for the NMGD,K factor values for different types of breast augmentation in relation to breast thickness was validated by the RMSE values. In both cases, it did not exceed a value of 0.01, indicating good fitting accuracy. The polynomial coefficients and RMSE values for both target/filter configurations are presented in Table 4.
Table 4
Polynomial model coefficients, RMSE values, and statistical significance for NMGD,K factor by filter/target and breast type
The results of the NMGD,K factor simulations were compared with the reference factors. The reference factors were calculated as the product of g, c, and s coefficients published by Dance et al. [13] for different breast types and thicknesses. It was assumed that the breast model in this study corresponds to 50% glandularity (c = 1). For the Mo/Mo target/filter combination (see Table 5), the obtained NMGD,K factors showed differences with the tabularized reference values for most of the breast types and thicknesses. Significant differences were observed for silicone, saline-water, and adipose breast types of augmentations at thicknesses of 50 mm and 60 mm, where the NMGD,K factors were consistently higher than reference values. In contrast, for the W/Rh combination (see Table 6), the obtained NMGD,K factors aligned with the reference values across all breast types and thicknesses, and no significant differences were observed.
Table 5
Comparison of the reference tabularized NMGD,K factor and obtained NMGD,K factor for a given breast type and thickness for Mo/Mo configuration
Table 6
Comparison of the reference tabularized NMGD,K factor and obtained NMGD,K factor for a given breast type and thickness for W/Rh configuration
Discussion
In this study, NMGD,K factor values for breasts with implants were 3-15% higher than for non-augmented breasts. The results highlight the influence of implants on the NMGD,K factor values, demonstrating that the NMGD,K factors determined for standard breast models (without implants) do not apply to breasts with implants.
The type of implant does not appear to have a significant effect on the NMGD,K factor, and thus on the accuracy of MGD determination, which is consistent with the findings of Beckett et al. [29], who observed no significant differences between saline and silicone implants for the Mo/Mo configuration. Similarly, no notable differences were observed between saline, silicone, and adipose implants for both the Mo/Mo and W/Rh mammography device configurations in our studies. This may be due to similar radiation attenuation coefficients for the different implant materials.
The differences between NMGD,K factors for breasts with and without implants were smaller for W/Rh beams than for Mo/Mo beams. This may be due to the difference in the characteristics of the radiation beams. W/Rh beams have a higher HVL, i.e. they are less attenuated in the breast, and the dose distribution is more homogeneous than for Mo/Mo beams.
The work has several limitations. The simulated shape of the breast model does not fully correspond to the shape of the compressed breast. The breast has been described as an ellipsoid, uniformly filled with tissue that is a mixture of glandular and adipose tissue. In other authors’ models, the shape is usually described as a semi-circular cylinder. The lower and upper surfaces are usually flat, which is caused by the placement of the breast between the table and the compression plate. The central area is filled with a homogeneous mixture of adipose and glandular tissue, but simulations are repeated for different ratios of the two tissue types. Also, the central region is usually surrounded by an outer layer of adipose tissue or skin [7]. In recent works, the breast model is more realistic (anatomical shape, breast area depending on compressed breast thickness, non-uniform distribution of glandular tissue) [12]. Also, the simulations are usually performed for a much wider range of beam qualities, breast thicknesses and breast glandularity [7,12].
In our work, the dose absorbed by the breast tissue (a mixture of adipose and glandular tissue) has been treated as the glandular dose. In fact, to calculate the average glandular dose, only the dose to the glandular tissue should be considered. The energy absorbed in the breast has to be divided between adipose and glandular tissue. Mass-energy absorption coefficients for glandular and adipose tissue are usually used to calculate the ratio of energy deposited in the glandular part of the voxel [7,12,20].
This study assumed a fixed implant position and a fixed ratio of implant dimensions to breast dimensions. It is known that variations in cyst depth result in different NMGD,K factors [20]. It can be expected that NMGD,K factors will also depend on the size and location of the implant in a similar way.
In Poland, the g, c, and s coefficients are usually used in MGD calculations [13]. In the new AAPM/EFOMP methodology, a new Γ coefficient was introduced [12]. Our study does not directly reproduce the simulations presented in any of the aforementioned publications. We have deliberately used a different designation (NMGD,K) to emphasize that the results presented in this paper do not supplement any of the currently used MGD determination methodologies with new coefficients for breasts with implants, and are not meant to be used for MGD calculations.
Despite the simplifications applied in this study, the results demonstrate that the use of conversion coefficients calculated for full breast models is not justified in the case of patients with breast implants. Consequently, the MGD values automatically calculated by the mammography device software are not accurate for breasts containing implants. Therefore, caution is required when comparing the MGD between breasts with and without implants. Such comparisons should not be used to draw premature conclusions about the dose for breasts with implants. In the future, the optimal solution would be to extend commonly used methods to include coefficients that take into account the presence, size, and location of implants.
Conclusions
The study underscores the significant impact of implants on NMGD,K factor values, indicating that NMGD,K factors derived for standard breast models are not applicable to breasts with implants. The findings also highlight that the type of implant has a minimal effect on the NMGD,K factor, likely due to similar radiation attenuation properties of different implant materials, and that the differences in NMGD,K factors between breast models with and without implants were less pronounced for W/Rh beams compared to Mo/Mo beams. Despite the study’s limitations, such as the simplifications in the breast model and the single implant position used, the results demonstrate the necessity of adjusting NMGD,K factor calculations for breasts with implants to ensure accurate dose assessment, particularly when comparing MGD values.