Intruduction
There is no single mechanism responsible for atherosclerotic vascular disease, and the etiology is apparently multifactorial. Although risk factors are systemic in nature, some arteries or even specific areas within them are more prone to developing lesions. The nonrandom distribution of plaque in the vasculature is mainly restricted to the “risk points,” with a complex interplay between hemodynamic forces and endothelial responses.
Coronary artery calcium (CAC) derived from non-contrast cardiac computed tomography (CT) provides a measure of plaque distribution and burden. The overall burden of coronary atherosclerosis reflects the combined impact of genetic predisposition, environmental factors, lifestyle, and the presence of comorbidities, including novel risk factors [1,2].
The moment of conversion from zero to positive CAC is difficult to capture but important for prognosis and treatment [3]. Once this conversion occurs, progression becomes exponential and inevitable [4]. This is mainly because modification of cardiovascular risk factors has a limited impact on the progression of CAC [5]. Consequently, each patient tends to remain at the same CAC score (CACs) percentile over time [1,4,6,7]. On average, it takes 10 to 15 years for CACs of 1 Agatston unit to increase to 100 [6]. One prospective study showed that in apparently healthy participants with positive CAC at baseline, the CACs roughly doubled over a 5-year follow-up [8]. Additionally, the Multi-Ethnic Study of Atherosclerosis (MESA), involving 5,756 participants, revealed that the CACs tends to increase about 20% to 25% annually [1]. Hence, based on a current CACs and age, it is possible to estimate the age at which the CACs was 0.1, which is related to the concept of arterial “age,” namely the age of the initiation of calcification [9].
Many research studies have found that coronary atherosclerosis is more commonly present in the left coronary artery, specifically in the left anterior descending artery (LAD), than in the right coronary artery (RCA) [10,11].
We examined the gender-related distribution of calcium deposits and plaque burden in the coronary vasculature. Additionally, we determined the patient’s age at which the CACs was at most 0.1 per vessel, suggesting that CAC first developed in the LAD. In patients with multi-vessel disease, we estimated the time to the appearance of calcification in the second coronary artery site.
Material and methods
Study population
This study was a retrospective registry of individuals who underwent CAC scoring and coronary computed tomography angiography as a routine diagnostic procedure. Therefore, the Bioethics Committee granted an exemption from ethics approval for this study. The study involved 764 consecutive individuals with intermediate or low probability of chronic coronary syndrome from January 2023 to December 2023. Patients with prior cardiovascular disease were excluded, including those with prior myocardial infarction, percutaneous coronary intervention, coronary bypass surgery, or cardiovascular implantable electronic devices. Additionally, patients with chronic kidney disease showing a mild reduction in estimated glomerular filtration rate and those with severe coronary artery calcification (a calcium score greater than 600) were also excluded. Patients with a CACs of 0.1 AU or higher were classified as having a positive CACs. According to the total CACs using the modified CAC Data and Reporting System (CAC-DRS), patients were divided into three risk groups: mildly increased risk (A1 with CACs from 0.1 to 99), moderately increased risk (A2 with CACs from 100 to 299), and severely increased risk (A3 with CACs of 300 or higher) [12]. Patients were further stratified into four groups (N1 to N4) based on the number of affected coronary territories, namely LAD, RCA, left circumflex branch (LCx), and left main (LM). Additionally, we analyzed the distribution of CAC in the A1/N1 subgroup based on CAC-DRS.
CT image acquisition for CACs
Patients were scanned in the supine position during a single breath-hold using a dual-source CT scanner (SOMATOM Definition Flash, Siemens Healthineers, Forchheim, Germany). Noncontrast CT scans were performed to evaluate CACs using standardized parameters. Patients with a heart rate above 70 beats per minute received metoprolol 2.5-5 mg intravenously. The presence of a lesion larger than 1 mm2 and a peak intensity greater than 130 Hounsfield units was automatically identified and color-coded by the software (Syngo.via). CACs were quantified using the Agatston method [13]. In addition, we analyzed the volume of calcification plaque in mm3 and the equivalent mass of calcium hydroxyapatite (Ca-HA) in milligrams, automatically calculated by Syngo.via software. To calculate calcium mass, a scanner-specific calibration factor was used. Location of calcification plaque volume, equivalent Ca-HA, and CACs in CT images were determined separately for LAD, RCA, LCx, and LM. The total CACs included the cumulative count across the four main coronary territories. Plaque burden ratio was calculated as individual vessel CACs divided by total CACs (vessel/total CACs).
Statistical analysis
All categorical variables are presented as absolute or relative frequencies. Comparisons between the groups were performed via the χ2 test and Fisher’s exact test. Continuous data are presented as median and interquartile range or mean and standard deviation, depending on the distribution. The value of p < 0.05 was deemed statistically significant. Statistical analysis was performed using TIBCO Software Inc. (2017), Statistica, version 13.
To calculate the initial age of atherosclerosis plaque, the appropriate formula was used (Supplementary material, Figure S1). This formula, analogous to a continuous compound interest equation, was solved for the time variable (t). The following assumptions were applied: constant and linear atherosclerosis plaque increase with a rate of 25% per year and CACs of 0.1 as a minimum detectable by the imaging method.
Results
The evaluated population consisted of 764 consecutive Caucasian patients, with a median age of 65 years (58-70). Among these patients, 443 had calcified coronary plaques (58%) – nearly three-quarters of the men (70.6%) and half of the women (53.6%). This difference was statistically significant (p < 0.001). Patients with positive CACs were older than those without calcifications, with a median age of 65 years (range 58-70) compared to 56 years (range 49-63), respectively (p < 0.001). Women with positive CACs were older than men, with a median age of 66 years (range 60-70) compared to 62 years (range 54-68) (p < 0.0001). There were no significant differences in plaque distribution and plaque burden between men and women, except for a higher LAD artery median percentage of vessel/total CACs: 80% (range 48-100) for women versus 63% (range 35-98) for men (p < 0.007).
Additionally, men were more likely to have multivessel disease (p < 0.006). Detailed demographic data, plaque distribution, and plaque burden per patient level (overall and by sex) are presented in Table 1.
Table 1
Demographic data, plaque distribution, and plaque burden within the study group and subgroups categorized by risk level and the number of diseased vessels (overall and by sex)
[i] CACs – coronary artery calcium score, CAD – coronary artery diseases, IQR – interquartile range, LAD – left anterior descending artery, LCx – left circumflex branch, LM – left main, RCA – right coronary artery, risk categories: A1 0.1-99, A2 100-299 and A3 > 300, N/n – number of diseased vessels
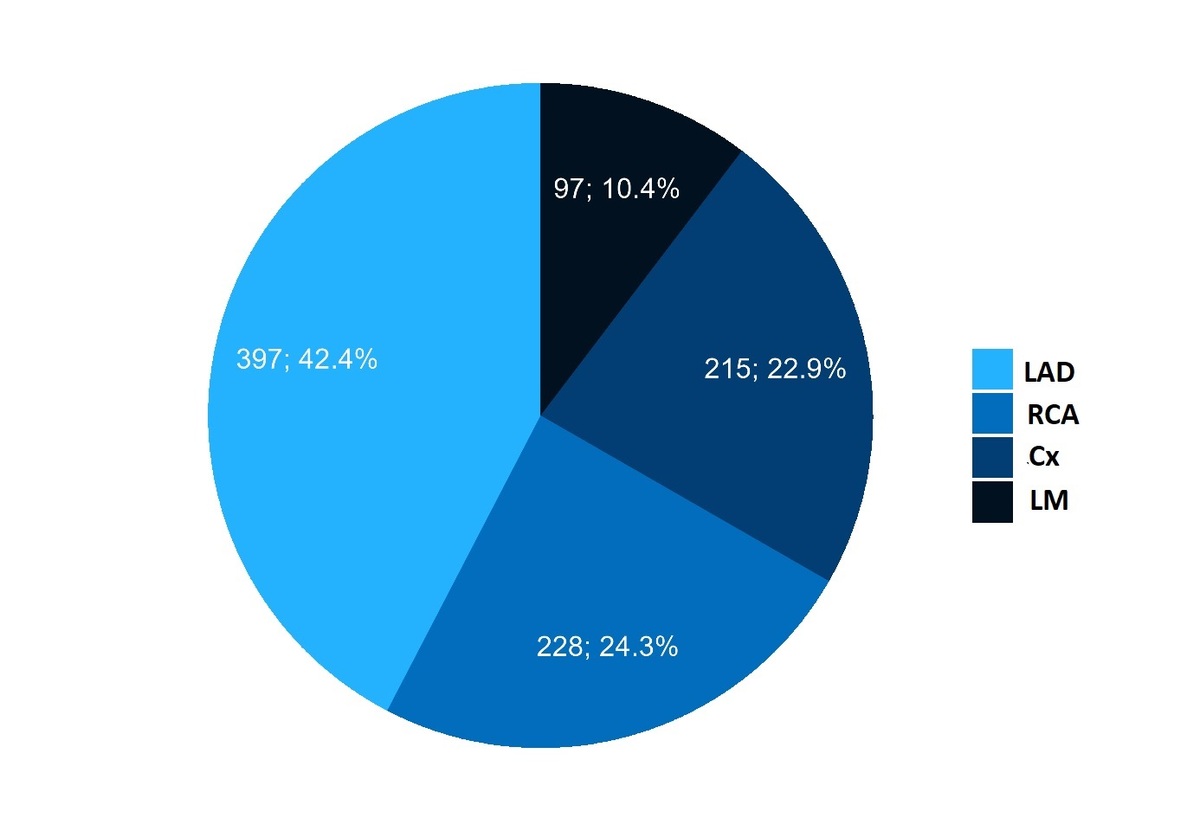
The number of defined diseased coronary territories analyzed per vessel was 937. Calcified plaque was most commonly identified in the LAD (397, 42.4%), followed by the RCA (228, 24.3%), the LCx (215, 22.9%), and the LM (97, 10.4%) (p < 0.0001) (Figure 1).
Figure 1
Distribution of calcifications in coronary artery territories – analyzed per vessel. The most frequently affected artery was the left anterior descending artery (LAD), followed by the right coronary artery (RCA), circumflex branch (Cx), and left main (LM)
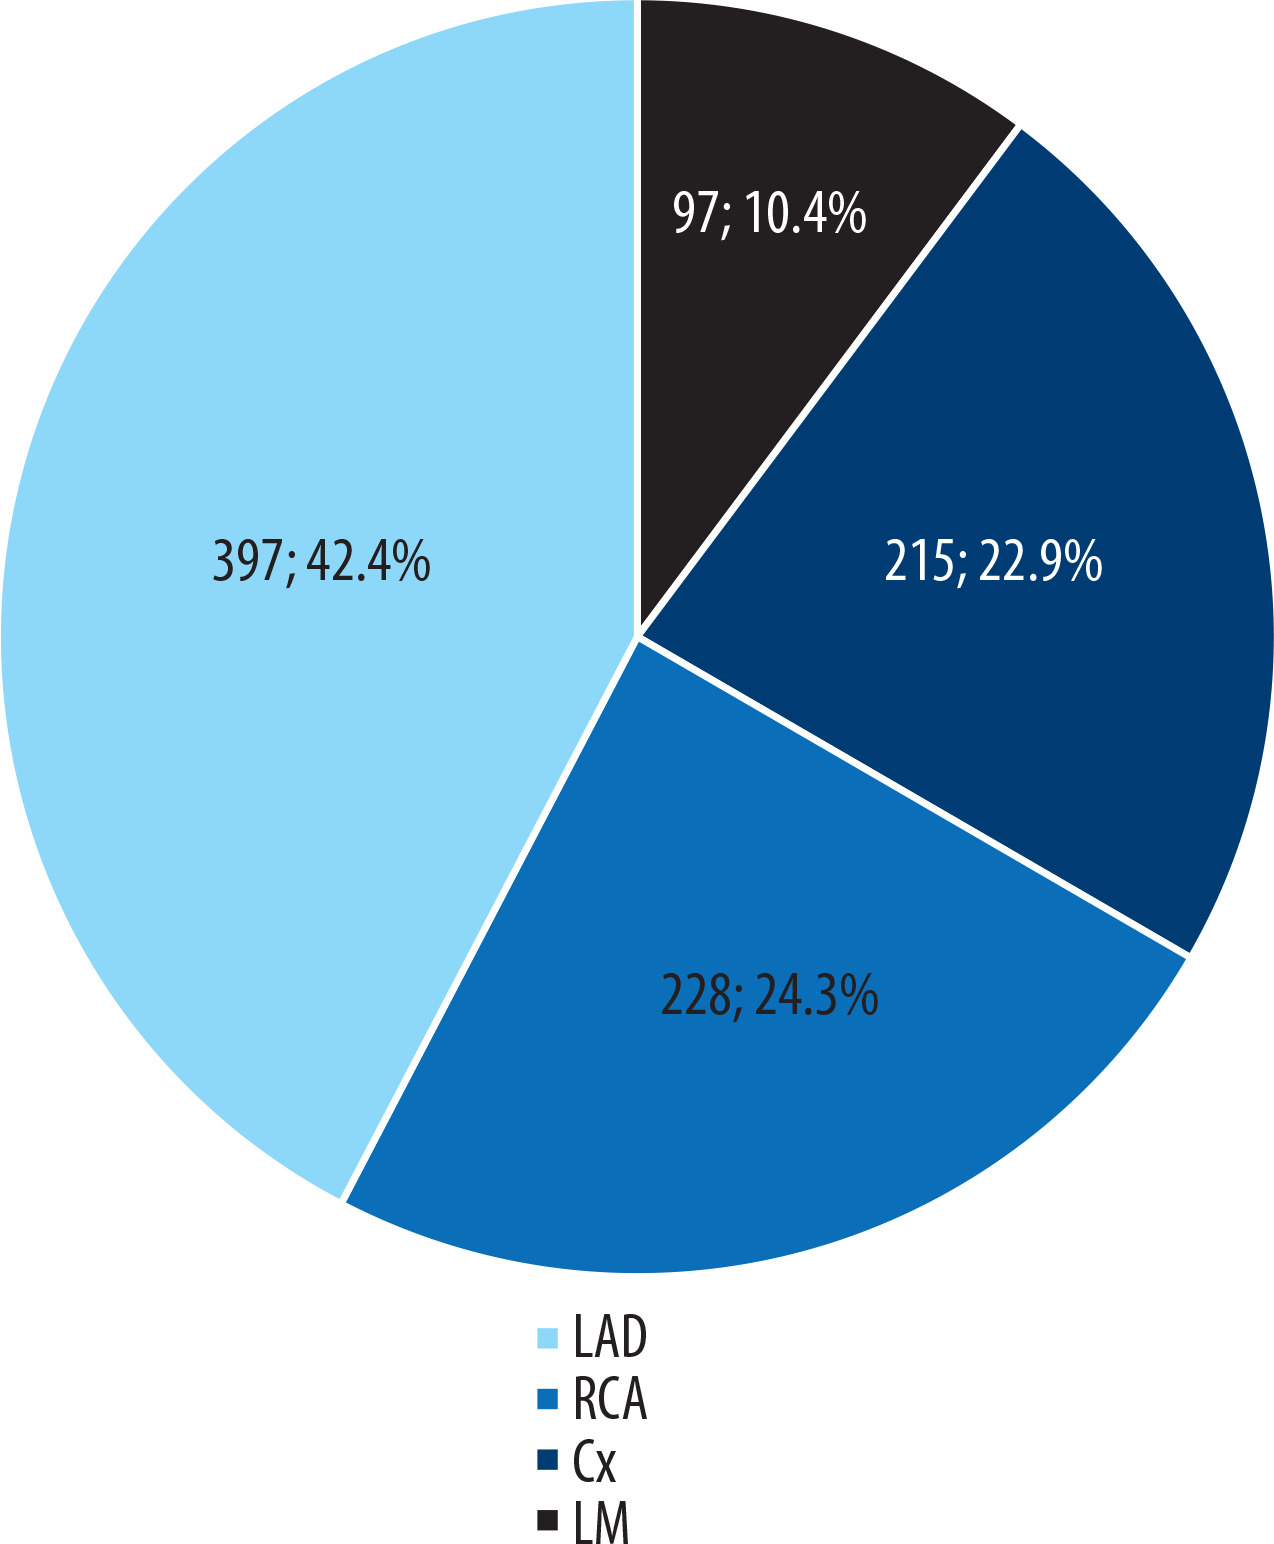
Table 2 presents the overall and sex-specific plaque distribution and median CACs per vessel for 937 diseased vessels. There was no difference in the distribution of diseased vessels or median CACs between women and men. As expected, the median CACs were highest in the LAD compared to other coronary territories in both women and men.
Table 2
Distribution of diseased vessels and median CACs per diseased vessel (overall and by sex). There was no difference in the distribution of diseased vessels and median CACs between women and men. As expected, the median CACs were highest in the LAD compared to other coronary territories in both women and men
The distribution of coronary artery calcifications differs statistically significantly (p = 0.001) among the 3 risk categories. The low-risk group included 287 patients (group A1). Among them, 243 patients (85%) had LAD calcification (Figure 2).
Figure 2
Distribution of coronary artery calcifications in the 3 risk categories. Groups A1, A2, and A3 represent patients with CAC scores ≥ 0.1-99, 100-299, and ≥ 300, respectively. The most frequently affected artery in each group was the left anterior descending artery (LAD). CAC – coronary artery calcium, RCA – right coronary artery, Cx – circumflex branch, LM – left main
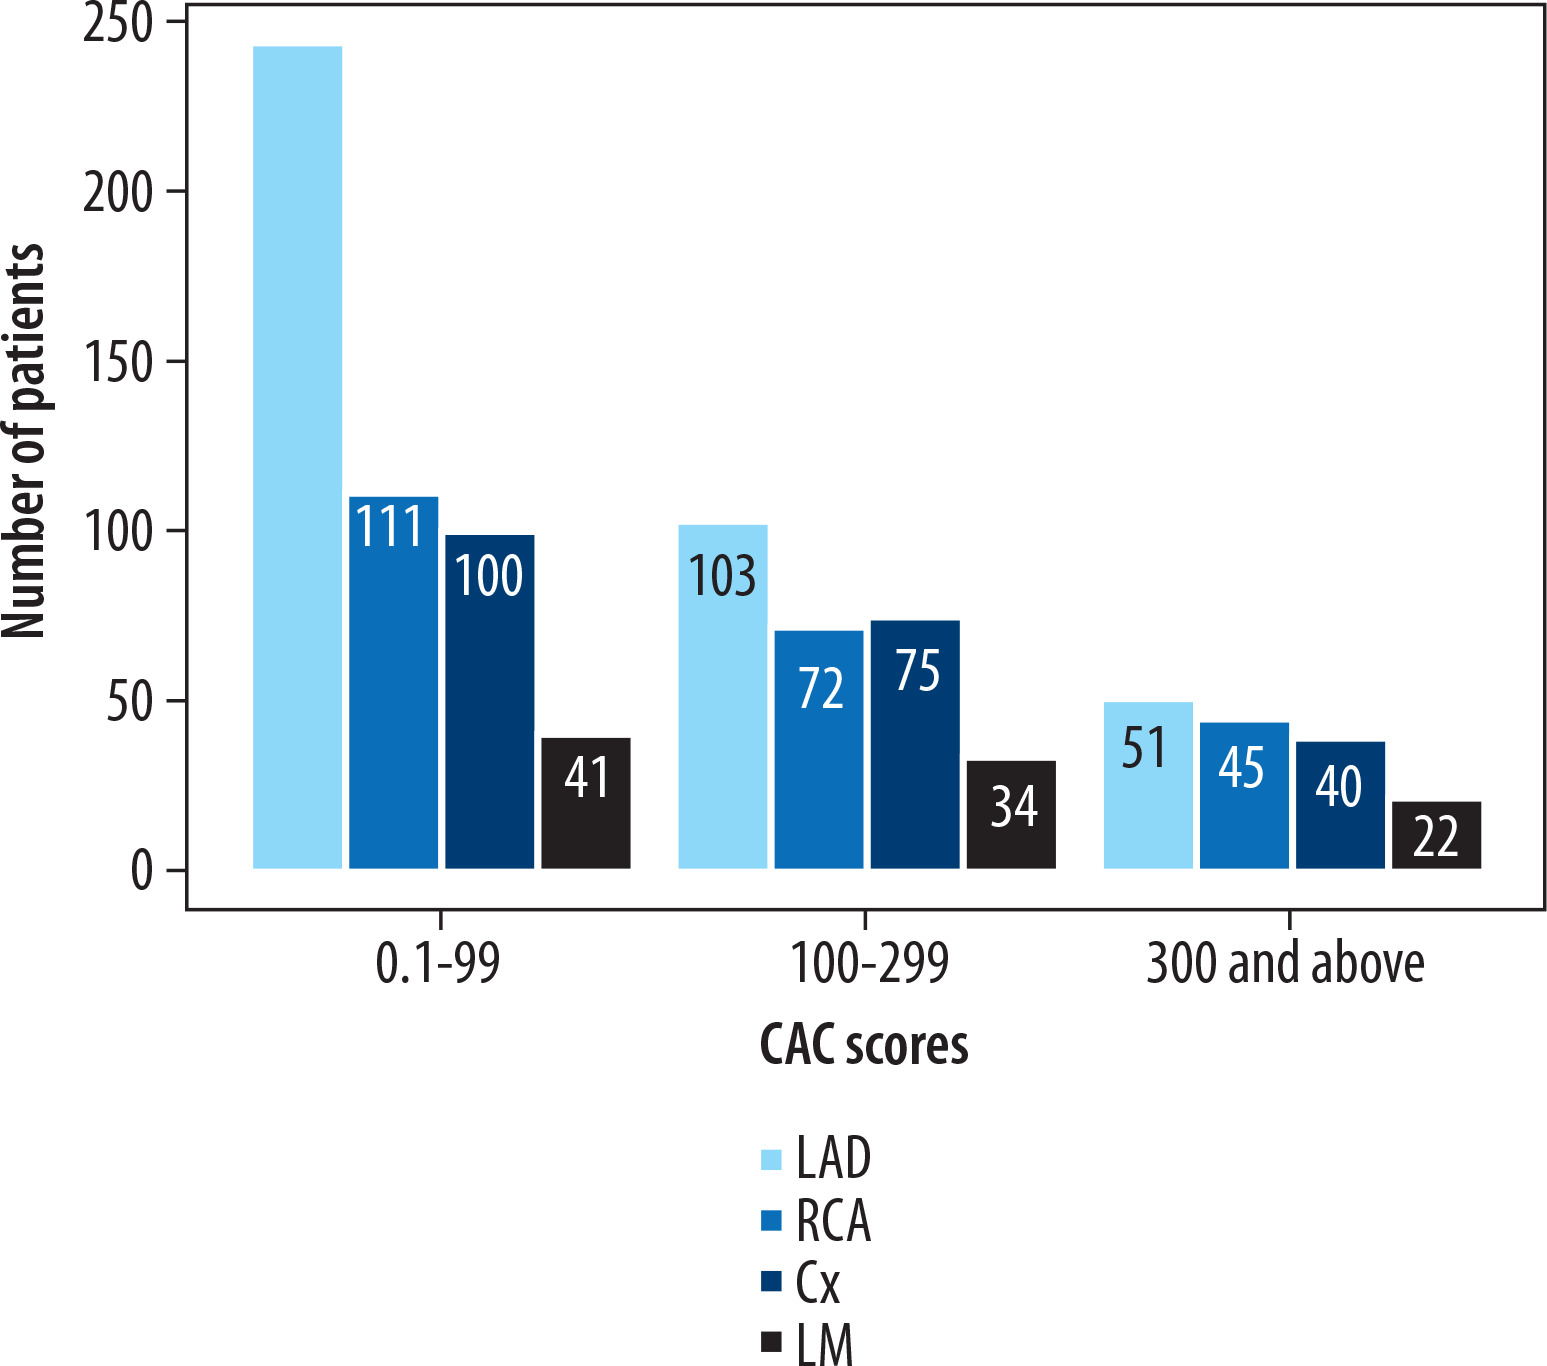
Similarly, among the 145 patients with single-vessel disease, 111 (77%) showed LAD involvement. Likewise, in the subset of 137 A1N1 patients, the LAD was the most frequently affected artery (n = 103, 75%).
Assuming that calcifications increase by 25% annually, we calculated the age at which calcification was at most 0.1 in at least one coronary artery territory. Among 443 patients, the median age for the onset of the first calcification was 41 years (range 34-48) (Table 3). Women experienced a later onset, with a median age of 42 years (range 37-50), versus 39 years (range 30-47) (p < 0.001) in men. Table 3 also presents the calculated onset of calcification in all four evaluated coronary territories, both overall and by sex. In the entire study group, the calculated median age of first CAC in the LAD was earlier than in the RCA, LCx, and LM. A sub-analysis by sex revealed that calcifications in the LAD and RCA can be expected significantly earlier in men than in women. 298 patients exhibited involvement of more than one coronary vessel. In this cohort, the estimated median time for the onset of calcification in an additional coronary territory was 4.5 years (range 2.2 to 8) following the diagnosis of singlevessel disease. For males, the calculated median age for this onset was 3.8 years (range 1.6 to 6.9), while for females it was 4.6 years (range 2.3 to 8.4) (p = 0.2).
Table 3
Estimated onset age of coronary artery calcification across the four coronary territories overall and for both sexes. The starting age was defined as the estimated age when coronary calcification was at most 0.1 per vessel level
Discussion
Our study confirms a non-uniform CAC distribution, with a clear predisposition to CAC formation in the LAD. Particularly in low-risk category patients (group A1), in patients with single-vessel disease (group N1) and within the A1N1 subgroup, the LAD was the most frequently affected vessel, impacting approximately three-quarters of patients. Additionally, the calcium burden was higher in the LAD compared with the RCA and LCx.
Our results are in line with previous observations. For example, Bax et al. [14] noted that the proximal LAD and LCx segments showed a higher plaque burden compared with the distal segments. Based on the findings from the MESA study involving 1,125 participants who developed detectable CAC on follow-up CT scan, it was noted that the LAD (44% of total) was the most frequently affected vessel, followed by the RCA (12%), LCx (10%), and LM (6%). This pattern was consistent across age and gender [15]. Iwasaki et al. [16] found that in patients with mild to high CACs, the LAD was more often affected than the other coronary arteries. Amanuma et al. [17] noted that the proximal LAD had the most extensive calcifications. Moreover, Enrico et al. [18] demonstrated that nearly half of the coronary plaques were found in the LAD, 25% in the RCA, and about 20% in the LCx. Recently, findings from the EISNER (Early Identification of Subclinical Atherosclerosis by Noninvasive Imaging Research) registry, focusing on patients in the low-risk category (A1), revealed that out of 385 subjects with a proximal plaque, 295 subjects (77.6%) exhibited calcification in the LAD [19]. Finally, a higher vulnerability of the LAD plaque to rupture has been observed in patients with suspected coronary artery disease undergoing cardiac catheterization with potential ad hoc percutaneous coronary intervention [20].
The susceptibility of the LAD to atherosclerosis can be understood through hemodynamic theory, which proposes that atherosclerosis is a biological response of endothelial cells (ECs) to the frictional drag force exerted by circulating blood on the vessel wall, known as wall shear stress (WSS) [21,22]. ECs respond to low and time-averaged WSS by undergoing morphological reorganization, leading to increased permeability and activation of multiple mechanosensing pathways. This biological response of ECs to mechanical stimuli is termed mechanotransduction [23,24]. Mechanotransduction leads to an increase in atheroprone genes and the suppression of atheroprotective genes, resulting in a local pro-inflammatory response. Together with other cytokines, whose endothelial expression is hemodynamically mediated, bidirectional blood flow with oscillatory WSS promotes local inflammation and expression of endothelial bone morphogenetic proteins 4 and 9, facilitating the transformation of vascular smooth muscle cells into osteo-like cells. These cells acquire the ability to produce a mineralized matrix, resulting in the formation of calcium deposits commonly observed in individuals over 70 years old [25-28].
Therefore, atherosclerosis is not solely the result of the accumulation of lipids and lipid-engorged cells in the intima. It also includes a persistent inflammatory response that contributes to virtually irreversible and exponentially progressing calcifications [29]. Considering the role of the hemodynamic environment in the development of atherosclerosis, the vulnerability of the proximal segment of the LAD to atherosclerosis can be attributed to its complex geometric characteristics with complex blood flow [30,31]. In the proximal LAD, secondary blood flows can be caused by contraction during systole, as blood is redirected through penetrating septal perforators, similar to the effect of a myocardial bridge. An intriguing observation supporting this theory is that the plaque near the septal branch origin is asymmetrical, with a larger mean atheroma area and intimal thickness on the septal side compared to the antiseptal side [32].
This specific plaque eccentricity is caused by the “milking effect” of the septal perforator, which alters the blood flow profile in the LAD towards the antiseptal side, consequently reducing WSS at the septal side. We believe that the “milking effect” of septal perforators, along with flow separation at the LM bifurcation and the take-off of diagonal branches, creates an environment that promotes plaque formation in the proximal LAD. The uneven CAC distribution allows us to formulate a generalized statement that plaque forms at the most vulnerable site, exposed to the most unfavorable local hemodynamic environment caused by specific geometric features. This location is often in the proximal LAD segment, and the risk point of CAC can be identified using computational fluid dynamics techniques before the plaque is detectable by imaging modalities. However, the boundary conditions in the LAD must consider the effect of septal perforators on the blood flow pattern [21,33-35]. The annual progression of CACs varies in the literature, ranging from 14.6% in control groups to 59% in patients with end-stage renal disease [7,36,37]. This rapid increase in CACs in patients with renal disease can be linked to additional medial calcification. In a preliminary study, a 24% annual increase in CACs was found, with no significant variation by gender [38]. Another study by Janowitz et al. [39] indicated an annual progression of CACs at 27% in patients with obstructive coronary artery disease, compared with 17% among those without clinically manifest disease. Mitchell et al. [40] observed 347 patients for 1.4 years and noted an average annual increase of 21% in men and 18% in women for CACs. Subsequently, a study of 299 subjects with a 2.2-year follow-up period showed a 33% annual increase in CACs, suggesting a doubling approximately every 2.5 years on average [41]. A meta-analysis of 10 trials reported an average annualized CACs increase of 16.9% in patients with cardiovascular disease [7]. An observational study involving 817 asymptomatic subjects referred for sequential electron beam tomographic imaging showed a 26% annual progression in calcium volume score used for plaque quantification [42].
Numerous studies have investigated the impact of different therapies on the progression of CAC. Analysis of two randomized controlled trials found that statin therapy did not result in significant differences in the change of CAC density between baseline and over one year, with annual CACs increasing by 28% to 32% [43]. Another study showed a 29.7% yearly increase in CACs with statin monotherapy [44]. Despite some variations between men and women in the process of plaque formation, we assumed a 25% annual increase in CACs for both genders. Evidence from studies such as the St. Francis and EBEAT trials showed that although males initially had higher baseline CACs than females, the progression rate did not vary between genders [45]. Moreover, findings from the KOICA (Korea Initiatives on Coronary Artery Calcification) registry indicated that men and women at similarly high-risk levels undergo coronary atherosclerosis progression in a similar manner [46]. In brief, CAC scores rise exponentially in both sexes, allowing fairly reliable predictions of future CACs [4]. Our data revealed that the estimated onset of CAC deposition in the LAD occurs earlier compared to the RCA, LCx and LM. Table 3 summarizes the data on the estimated age of calcification initiation in the four coronary artery territories overall and for both sexes. Gender-related analysis showed that calcifications in the LAD and RCA appear earlier in men than in women. This indicates that female sex only delays the onset of calcifications in LAD and RCA. Our finding aligns with the result from an autopsy series (Tampere Sudden Death Study), which reported for proximal LAD no notable differences in the total plaque area between premenopausal women (< 50 years) and men in the same age group. In this study there were also no sex differences in atherosclerosis within the proximal RCA [47].
The vulnerability of the LAD artery to atherosclerosis is also evidenced by findings from the MESA study pertaining to participants without standard modifiable risk factors such as dyslipidemia, hypertension, diabetes mellitus, and smoking (SMuRF-less patients) as well as patients with myocardial infarction [48-49]. In the MESA cohort with CACs > 0, SMuRF-less status was associated with a higher proportion of LAD disease compared to participants with ≥ 1 SMuRF [48]. In myocardial infarction patients, the absence of SMuRFs was linked to a higher occurrence of LAD infarction and increased mortality [49,50]. Data concerning SMuRF-less patients, according to our findings, revealed a unique vulnerability of the LAD to atherosclerosis. This underscores the significance of accounting for the specific hemodynamic pro-atherosclerotic environment of the LAD.
Our study has some limitations that should be pointed out. Firstly, we focused solely on calcified plaques. Secondly, we did not adjust for confounding risk factors for CAC and lacked detailed information on physical activity and treatment. Thirdly, the number of subjects with LM calcification was small, so any results involving the LM should be interpreted with caution. Lastly, this was a retrospective study conducted at a single center. However, these results represent important preliminary observations that deserve to be explored further using personalized algorithms to calculate the onset of coronary artery calcification.
Conclusions
The LAD was identified as the most commonly affected vessel in patients classified as low-risk (A1 group), those with single-vessel disease (N1 group), and those in the A1N1 subgroup. The LAD artery showed the highest plaque burden and earlier onset of coronary artery calcification compared to other coronary artery territories. Our findings offer important insights into screening strategies, particularly in young adults of both sexes.