Introduction
Parkinson’s disease (PD) is an advanced neurodegenerative condition that disturbs motor function [1]. The illness is caused by the progressive loss of dopamine-secreting neurons in an area of the brain called the substantia nigra. The neurotransmitter dopamine, which is involved in movement and coordination, plays a role in this process [2]. The cause of PD remains unclear, but it is speculated to be a result of a combination of genetic, environmental, and other determinants [3]. The above 60-year age group is predisposed to PD, as are specific genetic mutations and a family history of PD [4]. Diagnosis of PD occurs primarily through medical symptoms and neurological examination. There is no diagnostic test to determine whether a patient has PD. Several clinical and neurological markers are present, including tremors (mainly at rest), slowness of movement, muscle rigidity, gait disturbance, and impairment of coordination [5]. Some of these methods also assist in PD diagnosis and evaluation. One method used to assist in diagnosing and evaluating some motor impairments related to PD is the administration of drawing tasks [6]. Among such tasks, the spiral drawing test is most widely used in the diagnosis of PD. During the spiral drawing test, the patient is asked to draw several spirals on paper using a pen or pencil. Patients with PD are more likely to exhibit characteristic deficits in their drawings of spirals [7]. In some cases, the task of wave drawing is assigned, where the patient is requested to draw some kind of waves such as sine waves or any type of wave on a study paper. The same defects, including microscopic imaging, irregularity, and tremor, are present in this task, which are characteristic of PD. Early diagnosis enables the initiation of treatment immediately, which will preserve quality of life and independence as long as possible. Early diagnosis will increase the likelihood of responsiveness to neuroprotective therapies, since they will be provided with greater chances to exert their effect on the disease before it reaches an advanced stage [8].
With diagnosis, patients make the necessary changes to their lifestyle, including exercising regularly, adjusting their dietary habits, and modifying their housing arrangements. Diagnosis at an early stage eliminates potential causes of other neurological disorders and enables timely treatment and management [9]. Manual early PD diagnosis has several drawbacks. Early signs of diagnosis, such as minor tremors in movement, require the attention of professional healthcare practitioners [10]. Other neurological disorders share overlapping symptoms with tremor, making manual diagnosis a challenge [11]. Symptoms manifest differently in various patients, and therefore, early manual diagnosis is not straightforward. Predicting the progression of the disease is challenging, as it varies from patient to patient [12]. In certain areas, particularly in third-world countries, there are few health facilities for patients. AI tools can significantly reduce the majority of errors in human diagnosis of PD by providing data-driven solutions [13]. AI methods examine various sources of information, including hand-drawn wave and spiral doodles, sensor data, and voice recordings, to quantify and assess nuanced variations that are good predictors of earlier PD [14]. AI methods are best suited to detect intricate patterns in vast amounts of data by examining numerous and complex data points – such as hand-drawn images, voice, and walking data – which are difficult for physicians to identify [15].
Hand-drawn-image-based screening is a non-invasive, low-cost, and easy-to-use method that directly measures early neuromotor impairments through micro-tremors, pressure abnormalities, and stroke distortions. This is different from voice, gait, or neuroimaging methods. Spiral and waveform drawings uniquely convert fine motor control into measurable spatial and textural biomarkers, facilitating objective digital assessment without requiring costly equipment or extensively trained personnel.
Also, handwriting and speech features are typically inconsistent because of language and sound considerations. Gait sensors and imaging methods, on the other hand, require wearable or MRI infrastructure, making them difficult to access in resource-limited areas. In contrast, simple sketches on paper or a tablet can be gathered rapidly in clinical waiting rooms or even from a distance, making it possible to scale tele-diagnostics [16]. Neurologists have known for a long time that spiral and waveform analysis are useful for diagnosis because they make tremor, stiffness, and bradykinesia – early signs of PD – more noticeable. When combined with AI, these sketches can be automatically analysed to provide interpretable motor anomalies, which connect clinical intuition with computational accuracy. Focusing on hand-drawn image data enables early screening that is both explainable and cheap. This approach facilitates the translation of AI models from the laboratory setting to real-world neurology practice.
In the interest of transparency, originality, and clarity, the following section outlines the specific contributions made by the authors during the study. From conceptualization to model design, experimentation, and result interpretation, every activity was carried out with utmost care to advance the area of PD diagnosis from hand-drawn pictures. These contributions reflect the multidisciplinary and team-based nature of the research, providing both scientific rigor and pragmatic usefulness.
Author’s contributions
Introduced a novel 2-channel input representation through combining normalized greyscale images and Canny edge maps to provide structural and stroke pattern clarity necessary for PD diagnosis.
Trained the model on two publicly available spiral and waveform drawing datasets through intensive preprocessing and augmentation to facilitate strong model training and generalizability in real-world applications.
Built a multi-representation fusion pipeline that captures spatial (convolutional neural network, CNN), statistical (grey-level co-occurrence matrix, GLCM), and semantic (50layer residual network, ResNet-50) features that improve classification performance as well as interpretability.
Designed three deep learning pipelines – Baseline CNN, CNN + GLCM hybrid, and fine-tuned ResNet-50 – each of which was adapted for PD detection from hand-drawn images with different levels of complexity and performance trade-offs.
Incorporated GLCM handcrafted features into CNN-based pipelines and utilized gradient-weighted class activation mapping (Grad-CAM) visualizations to improve model explainability and clinical robustness.
Conducted comprehensive experimental testing with cross-validation, confusion matrices, and performance measures (accuracy, precision, recall, F1-score), and paired t-tests and Wilcoxon tests for statistically validating the significance of results.
The remaining organization of this paper is structured as follows: Section 2 describes a comprehensive review of the literature on PD image detection from images and machine learning, identifying the main gaps and motivations. Section 3 outlines the material and methods of this work, including information on the dataset, image pre-processing methods, and GLCM-based feature extraction paradigm. Section 4 describes the framework of the proposed models, specifically the baseline CNN, the CNN using GLCM fusion, and the fine-tuned ResNet-50 architecture. Section 5 presents experimental results, model performance evaluation, and visual interpretability, using Grad-CAM, as well as statistical verification. Lastly, Section 6 concludes the research work with its findings and recommendations for future studies.
Literature review
The diagnosis of PD has increasingly leveraged artificial intelligence, specifically deep learning and machine learning methods, to examine speech, handwriting, and spiral drawings for early diagnosis. This section discusses recent progress, identifying principal methodologies, performance results, and gaps in current research that drive the motivation for the current study. Previously, researchers [17] implemented a CNN for the identification of PD by analysing irregularities in drawing movements. Using spiral pentagon drawing images, they trained a convolutional classifier with an accuracy of 93.5% between PD and healthy controls. In another study [18], DL methods were introduced, and two strategies using 2D and 3D CNNs for the diagnosis of PD were proposed. To train the model effectively, bias field correction, Z-score normalization, and image resizing were applied. The 3D model achieved an area under the curve (AUC) of 86% compared to 72.22% for the 2D model, indicating that the 3D model performed better than the 2D model.
In a previous study [19], acoustic features of speech samples were used for the early diagnosis of PD. A variety of machine learning classification algorithms were tested, including support vector machines (SVMs), random forests, gradient boosting, k-nearest neighbours (KNN), logistic regression, and decision trees. To enhance performance, ensemble learning techniques were employed, including stacking and stacking with cross-validation. While operating in the range of 70% to 82% for single models, the stacking ensemble improved that to 92%, and further to 95% using cross-validation. The method depicts speech as a promising initial biomarker, but its efficacy may be sensitive to speaker variability and noise level. A recent novel Internet of things (IoT)-based hybrid approach for the early diagnosis of PD via hand-drawn spiral images was proposed [20], employing a new sine cosine geese migration optimization for optimal image routing and a cosine deep CNN for classification. The model achieved the highest accuracy of 89.98% with consistent metrics, including positive predictive value (87.41%), true negative rate (89.77%), negative predictive value (NPV, 87.82%), and true positive rate (TPR, 89.84%). The algorithm also exhibited lower communication delay (0.283 ms) and power consumption (0.507 J), demonstrating its suitability for real-time surveillance. Nevertheless, the explicit and minimal set of images used by the model in its application, along with the absence of external validation, restricts generalizability and clinical scalability.
Researchers [21] validated a computerized approach to measuring kinetic tremor in patients with essential tremor (ET) and PD through quantifying standardized drawings performed under magnetic resonance-guided focused ultrasound thalamotomy. Patients made drawings (signature, spiral, and line) at various stages of treatment, which were measured and analysed to give quantitative tremor scores. The findings indicated marked post-treatment gains, particularly for ET patients, with strong correlations between drawing score and accelerometer-measured wrist angles (e.g., R2 = 0.85 for spirals in PD). Although the approach provides objective quantification of tremor, the use of stringent clinical settings and post-processing could curtail immediate generalization to more general tele-monitoring environments. Other research [22] demonstrated that a new technique for early diagnosis of PD, involving the quantification of dysgraphia using a 16 × 16 low-signal degradation and high-response pressure sensor array, is effective. The system avoids crosstalk using an isolation layer, thereby efficiently recording subtle handwriting dysgraphia. The ResNet-18 CNN is utilized for feature extraction and classification with high efficiency in detecting Parkinson ‘s related dysgraphia. Despite tremendous potential for early diagnosis, the utility of the system will likely be limited by the need for specialized equipment and clinical validation in a broad range of populations.
One study [23] proposed a hybrid deep learning framework, called Chronological Tangent Search Optimization-Zeiler and Fergus Network (CTSO-ZFNet), for early and precise diagnosis of PD using hand-drawn spiral images and voice signals. Median and adaptive Wiener filters were used in pre-processing, followed by the lyrebird herd optimization (LHO) algorithm, and feature-based feature selection. Chronological Tangent Search Optimization was used to optimize the Zeiler and Fergus Network model for classification. The model achieved a satisfactory performance, with an accuracy of 89.69%, a TPR of 90.87%, and an NPV of 90.55%. Although it yields good values, the complexity of the method and the two-modality input may limit its implementation in clinical practice without increasing the ease of integration through simplification and validation. Another study [24] introduced an attention-based continuous convolutional network for enhancing the early diagnosis of PD through handwriting analysis. The network can identify tremors and writing space abnormalities well by focusing on diagnostically significant areas using an attention mechanism. It reported an extremely impressive mean accuracy of 96.5% compared to conventional CNNs in diagnostic accuracy. Although the method is emerging, validation in multiple datasets and real clinical conditions is necessary to establish its robustness and generalizability.
A study [25] aimed to develop a simple but accurate auxiliary diagnostic tool for PD through spiral hand-drawing testing. Unlike traditional AI systems, which have limitations due to dynamic input and dedicated hardware, the researchers developed a static image-based Archimedes spiral database that successfully detects tremor, shape, and spacing features. By reducing the number of pooling layers, the authors developed a new continuous convolution network. 89.3% of classifications were accurate, the Matthews correlation coefficient was 0.733, and the AUC was 0.934, indicating excellent diagnostic performance. The method in the study, however, is to be improved in the next stage by validation in heterogeneous real-world settings to ensure generalization. Table 1 below encapsulates the salient techniques, findings, and pitfalls reported in the reviewed literature, providing a comparative snapshot of available trends and knowledge gaps in PD diagnosis research.
Table 1
Summary of recent studies on Parkinson’s disease diagnosis
[i] AUC – area under the curve, CC-Net – continuous convolution network, CNN – convolutional neural network, CosineDCNN – cosine deep convolutional neural network, CTSO-ZFNet – Chronological Tangent Search Optimization-Zeiler and Fergus Network, IoT – Internet of things, LHO – lyrebird herd optimization, MCC – Matthews correlation coefficient, ML – machine learning, MRgFUS – magnetic resonance-guided focused ultrasound – MR-guided focused ultrasound, ResNet – residual network, SCGA – sine cosine geese migration optimization, TPR – true positive rate, NPV – negative predictive value
The authors of one study [26] used machine learning (ML) algorithms on voice recordings to identify PD without the need for intrusive methods. The researchers used a dataset of 195 samples and many classifiers, including linear discriminant analysis (LDA), SVM, KNN, and CNN. They found that KNN was the best, with 98% accuracy and balanced precision and recall. The work emphasized the potential of acoustic biomarkers and ML models in enabling early, economical PD screening without reliance on clinical imaging. The study’s findings are outstanding; however, voice-based research relies solely on acoustic parameters, which are often susceptible to noise, linguistic variations, and recording quality, thus limiting generalizability across populations. Another limitation is the limited size of the dataset used for the study.
In one study [27], the authors introduced the EO-optimized Lightweight Automatic Modulation Classification Network (EO-LWAMCNet) into an IoT-enabled healthcare system for early illness prediction. The framework attained a good accuracy of 94.8% and 95% on chronic liver and brain disease datasets, respectively, by using data collected from sensors and analysed through a Lightweight CNN. The main limitation of the proposed work model is its reliance on sensor-based inputs, which restricts its applicability to detect motor disorders associated with certain neurological conditions, such as PD. Furthermore, the study lacks interpretability mechanisms and multimodal feature fusion, which are essential strengths addressed in this work.
Research gaps
The research shows that machine learning and deep learning have made significant progress in predicting diseases and screening for PD using speech, gait, handwriting, and sensor data [14,17,18,22]. Nonetheless, significant research gaps remain: (i) most current methods depend on high-cost or infrastructure-dependent modalities such as acoustic recordings or wearable sensors [17,18], which makes them hard to scale; (ii) previous hybrid models have mostly focused on temporal learning through CNN – recurrent neural network (RNN) or transformer-based fusion networks [23,24], which are less effective with static motor-imaging data; (iii) feature-level fusion between deep and handcrafted descriptors is not often studied in Parkinson’s diagnostics [22]; and (iv) existing studies do not consistently ensure that explainability and cross-dataset validation are present, which are important for clinical trust and reproducibility [25].
To address these deficiencies, this study introduces an explainable hybrid CNN + GLCM framework that amalgamates deep spatial representations with handcrafted textural statistics for the analysis of hand-drawn spirals and waveforms, a neurologically validated and cost-effective modality. This hybridisation facilitates interpretability, resource efficiency, and cross-cohort generalisation, thereby rectifying the observed deficiencies and propelling the domain of AI-driven, explainable PD screening.
Problem statement
Although there have been significant developments in the application of AI for PD diagnosis, particularly through handwriting, speech, and spiral drawing analysis, serious drawbacks often hinder existing solutions. These include non-generalizability with small or homogeneous data sets [20], excessively high computational costs in 3D models [18], reliance on custom-made acquisition devices [22], and a lack of interpretability or clinical usability [23,24]. Additionally, most models use deep features or handcrafted descriptors but only infrequently combine the complementary strengths of both. Encouraged by these shortcomings, this paper proposes a stable and interpretable hybrid diagnostic model that combines CNN-based spatial features with GLCM-based texture features in augmented 2-channel input representations. This approach addresses the dual challenge of achieving enhanced classification performance while maintaining clinical interpretability and computational efficiency under diverse real-world conditions.
Material and methods
Dataset description
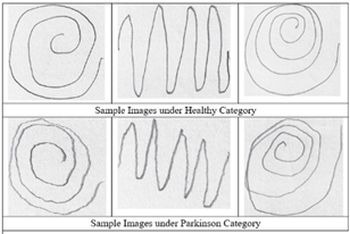
Two publicly accessible databases of hand-drawn images for PD classification were used in this study. The primary training dataset was taken from Augmented Hand-Drawn Data for Parkinson’s Disease [28], which contains 3,264 grey-scale wave and spiral images. The database contains both PD class and control class images and has undergone extensive augmentation (i.e., rotation, zoom, and translation) for improved generalization. The data are well annotated for deep learning validation and serve as a good starting point for training effective models. As a standalone test and model generalization test, the second dataset [29] includes raw waveforms and spiral charts of patients with PD and healthy controls with 60 images. This dataset introduces variation in the style of the drawings, brushstroke quality, and image acquisition, thereby enabling us to evaluate the usability of the learned models under real-world conditions. A few examples of the training dataset images are shown in Figure 1.
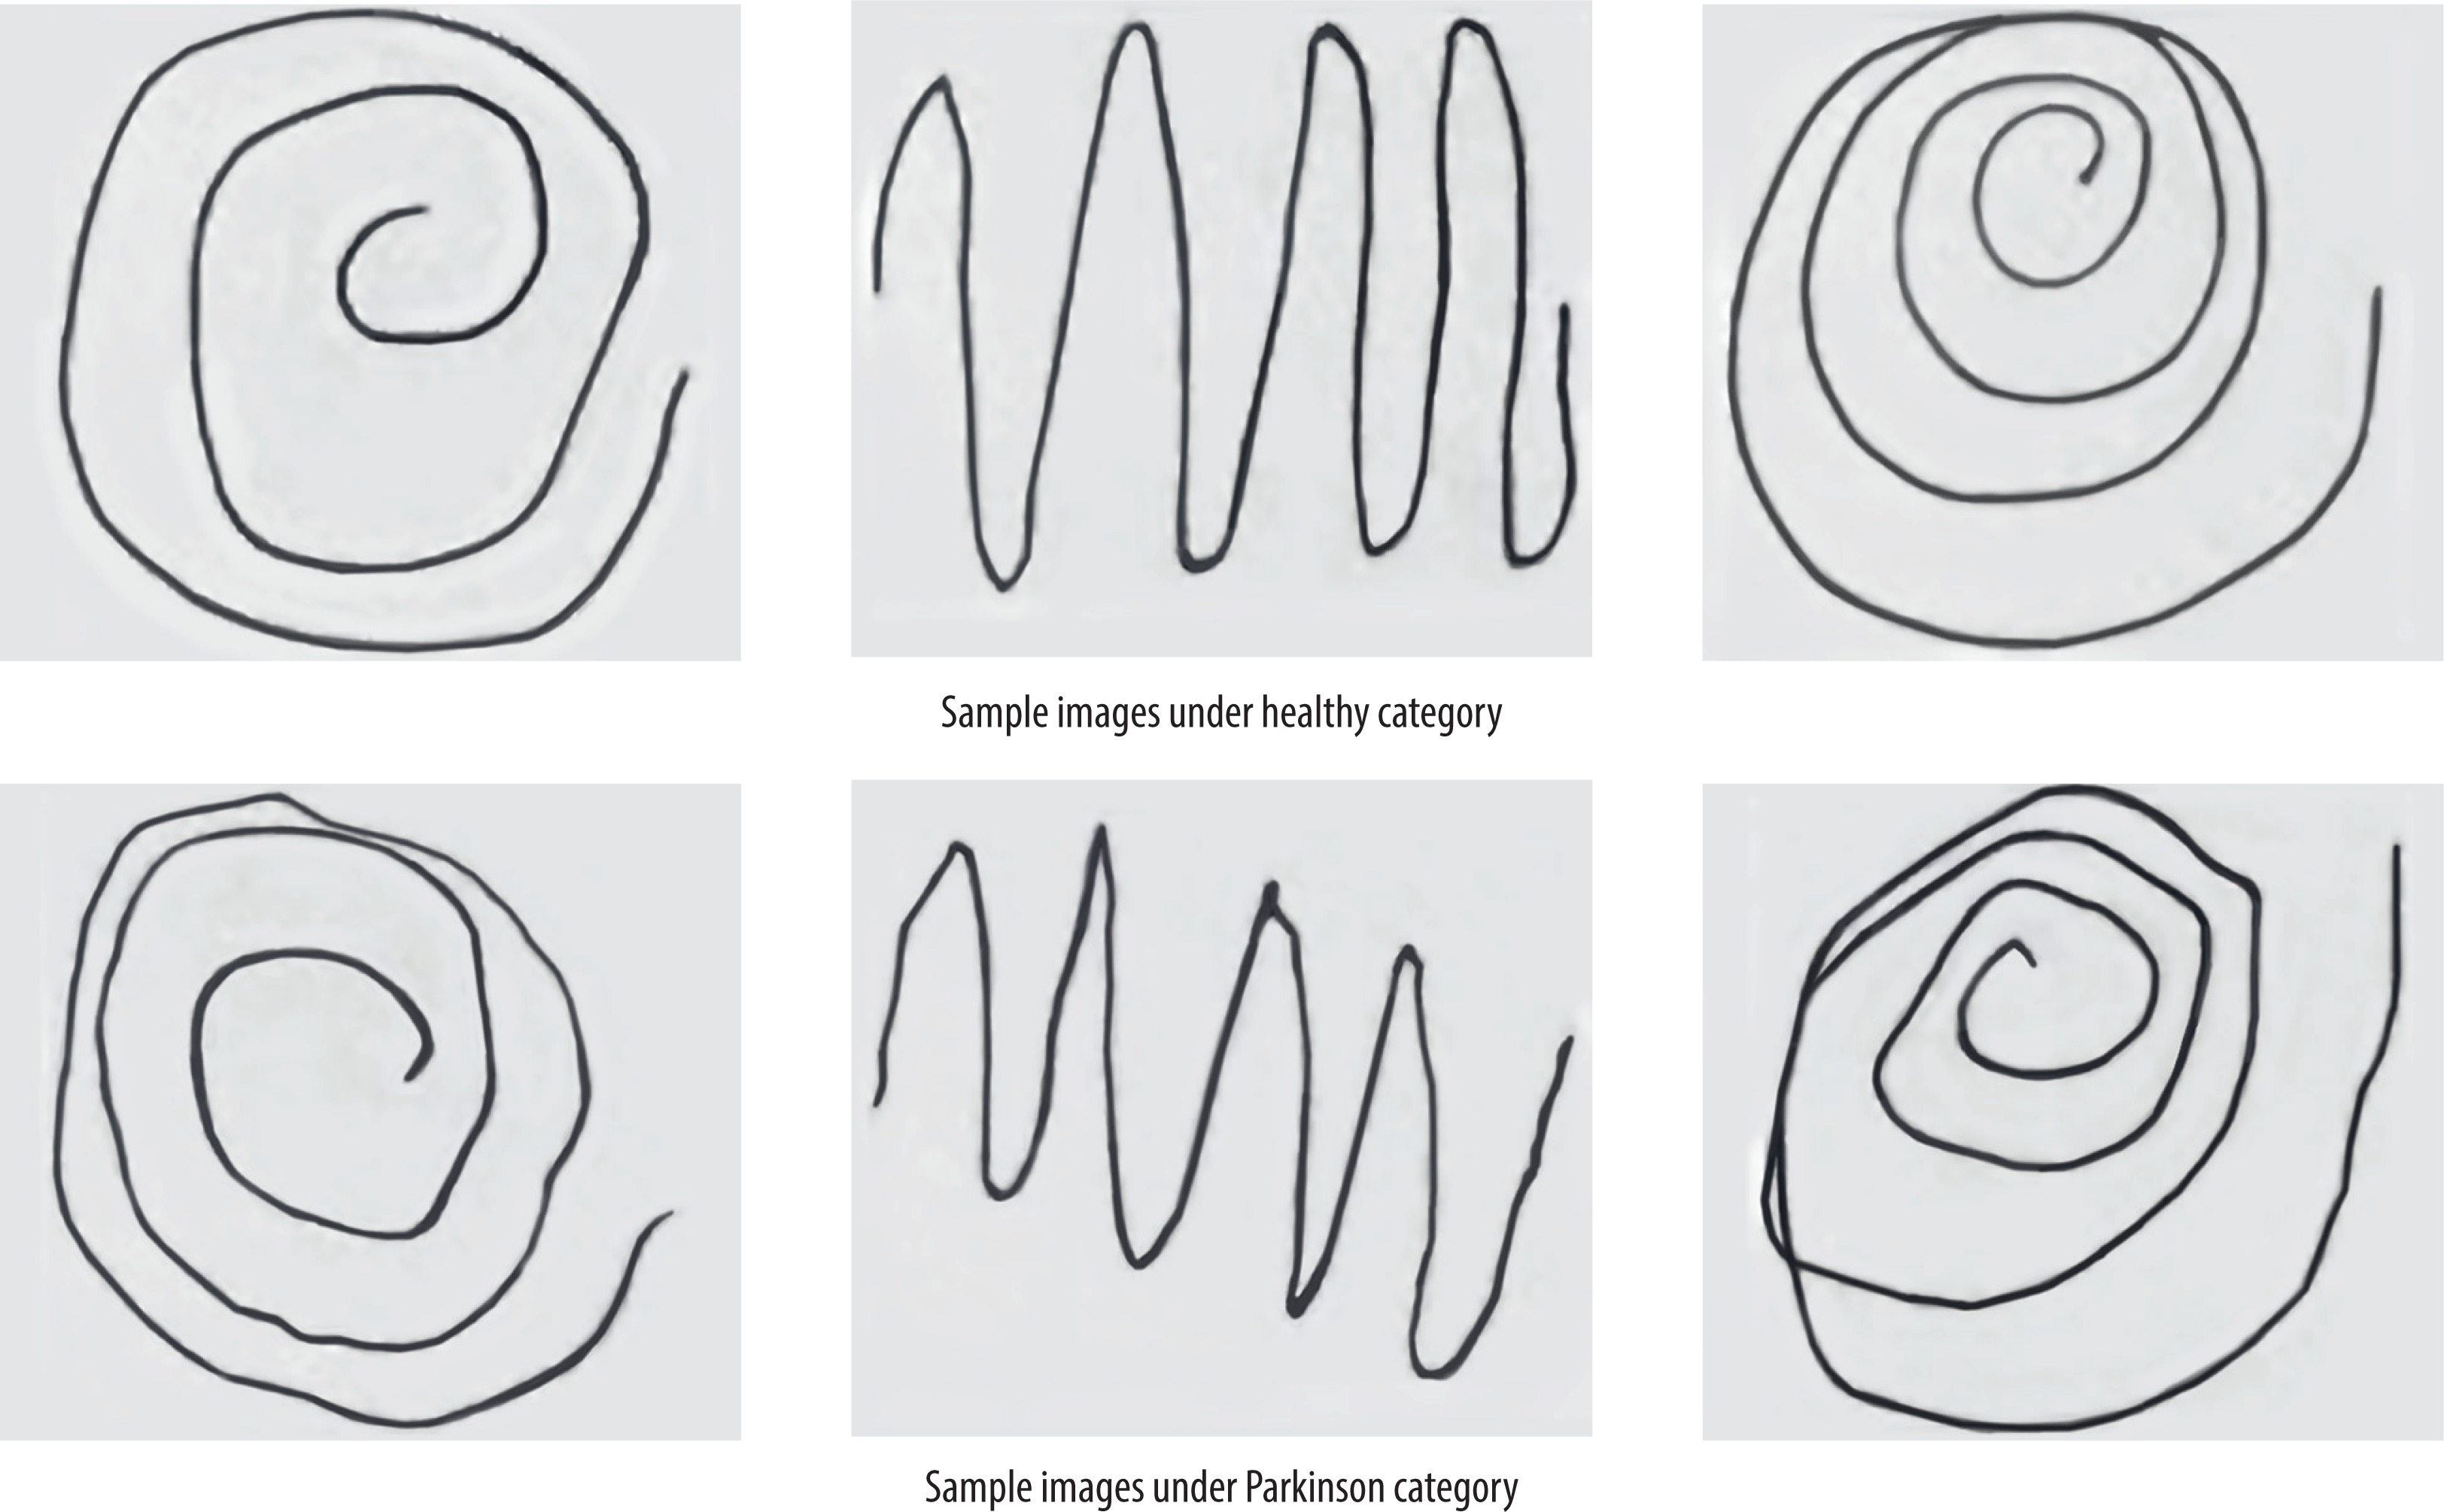
Image pre-processing and augmentation
To ensure consistent input for all deep models, all hand-drawn spiral and wave pictures (already grey scale) were initially resized to 128 × 128 pixels using bilinear interpolation (Eq. 1). Pixel intensity was also normalized to [0, 1] by dividing by 255 to ensure normalized input distributions and accelerate training convergence, represented by Eq. 2. To introduce diversity to training samples and prevent overfitting, a custom data generator – EdgeImageGenerator, derived from Keras’ Sequence class – was implemented. The generator consists of light-weight, real-time augmentations such as: horizontal flip with 50% probability, random rotations between –10° and +10°, and injection of Gaussian noise (mean 0, standard deviation 0.02) with 30% probability.
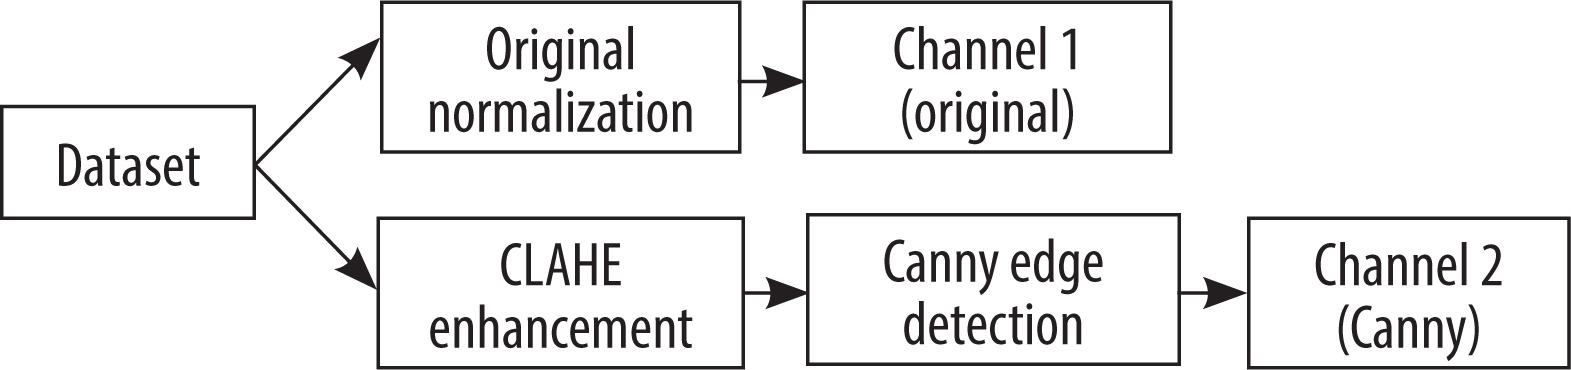
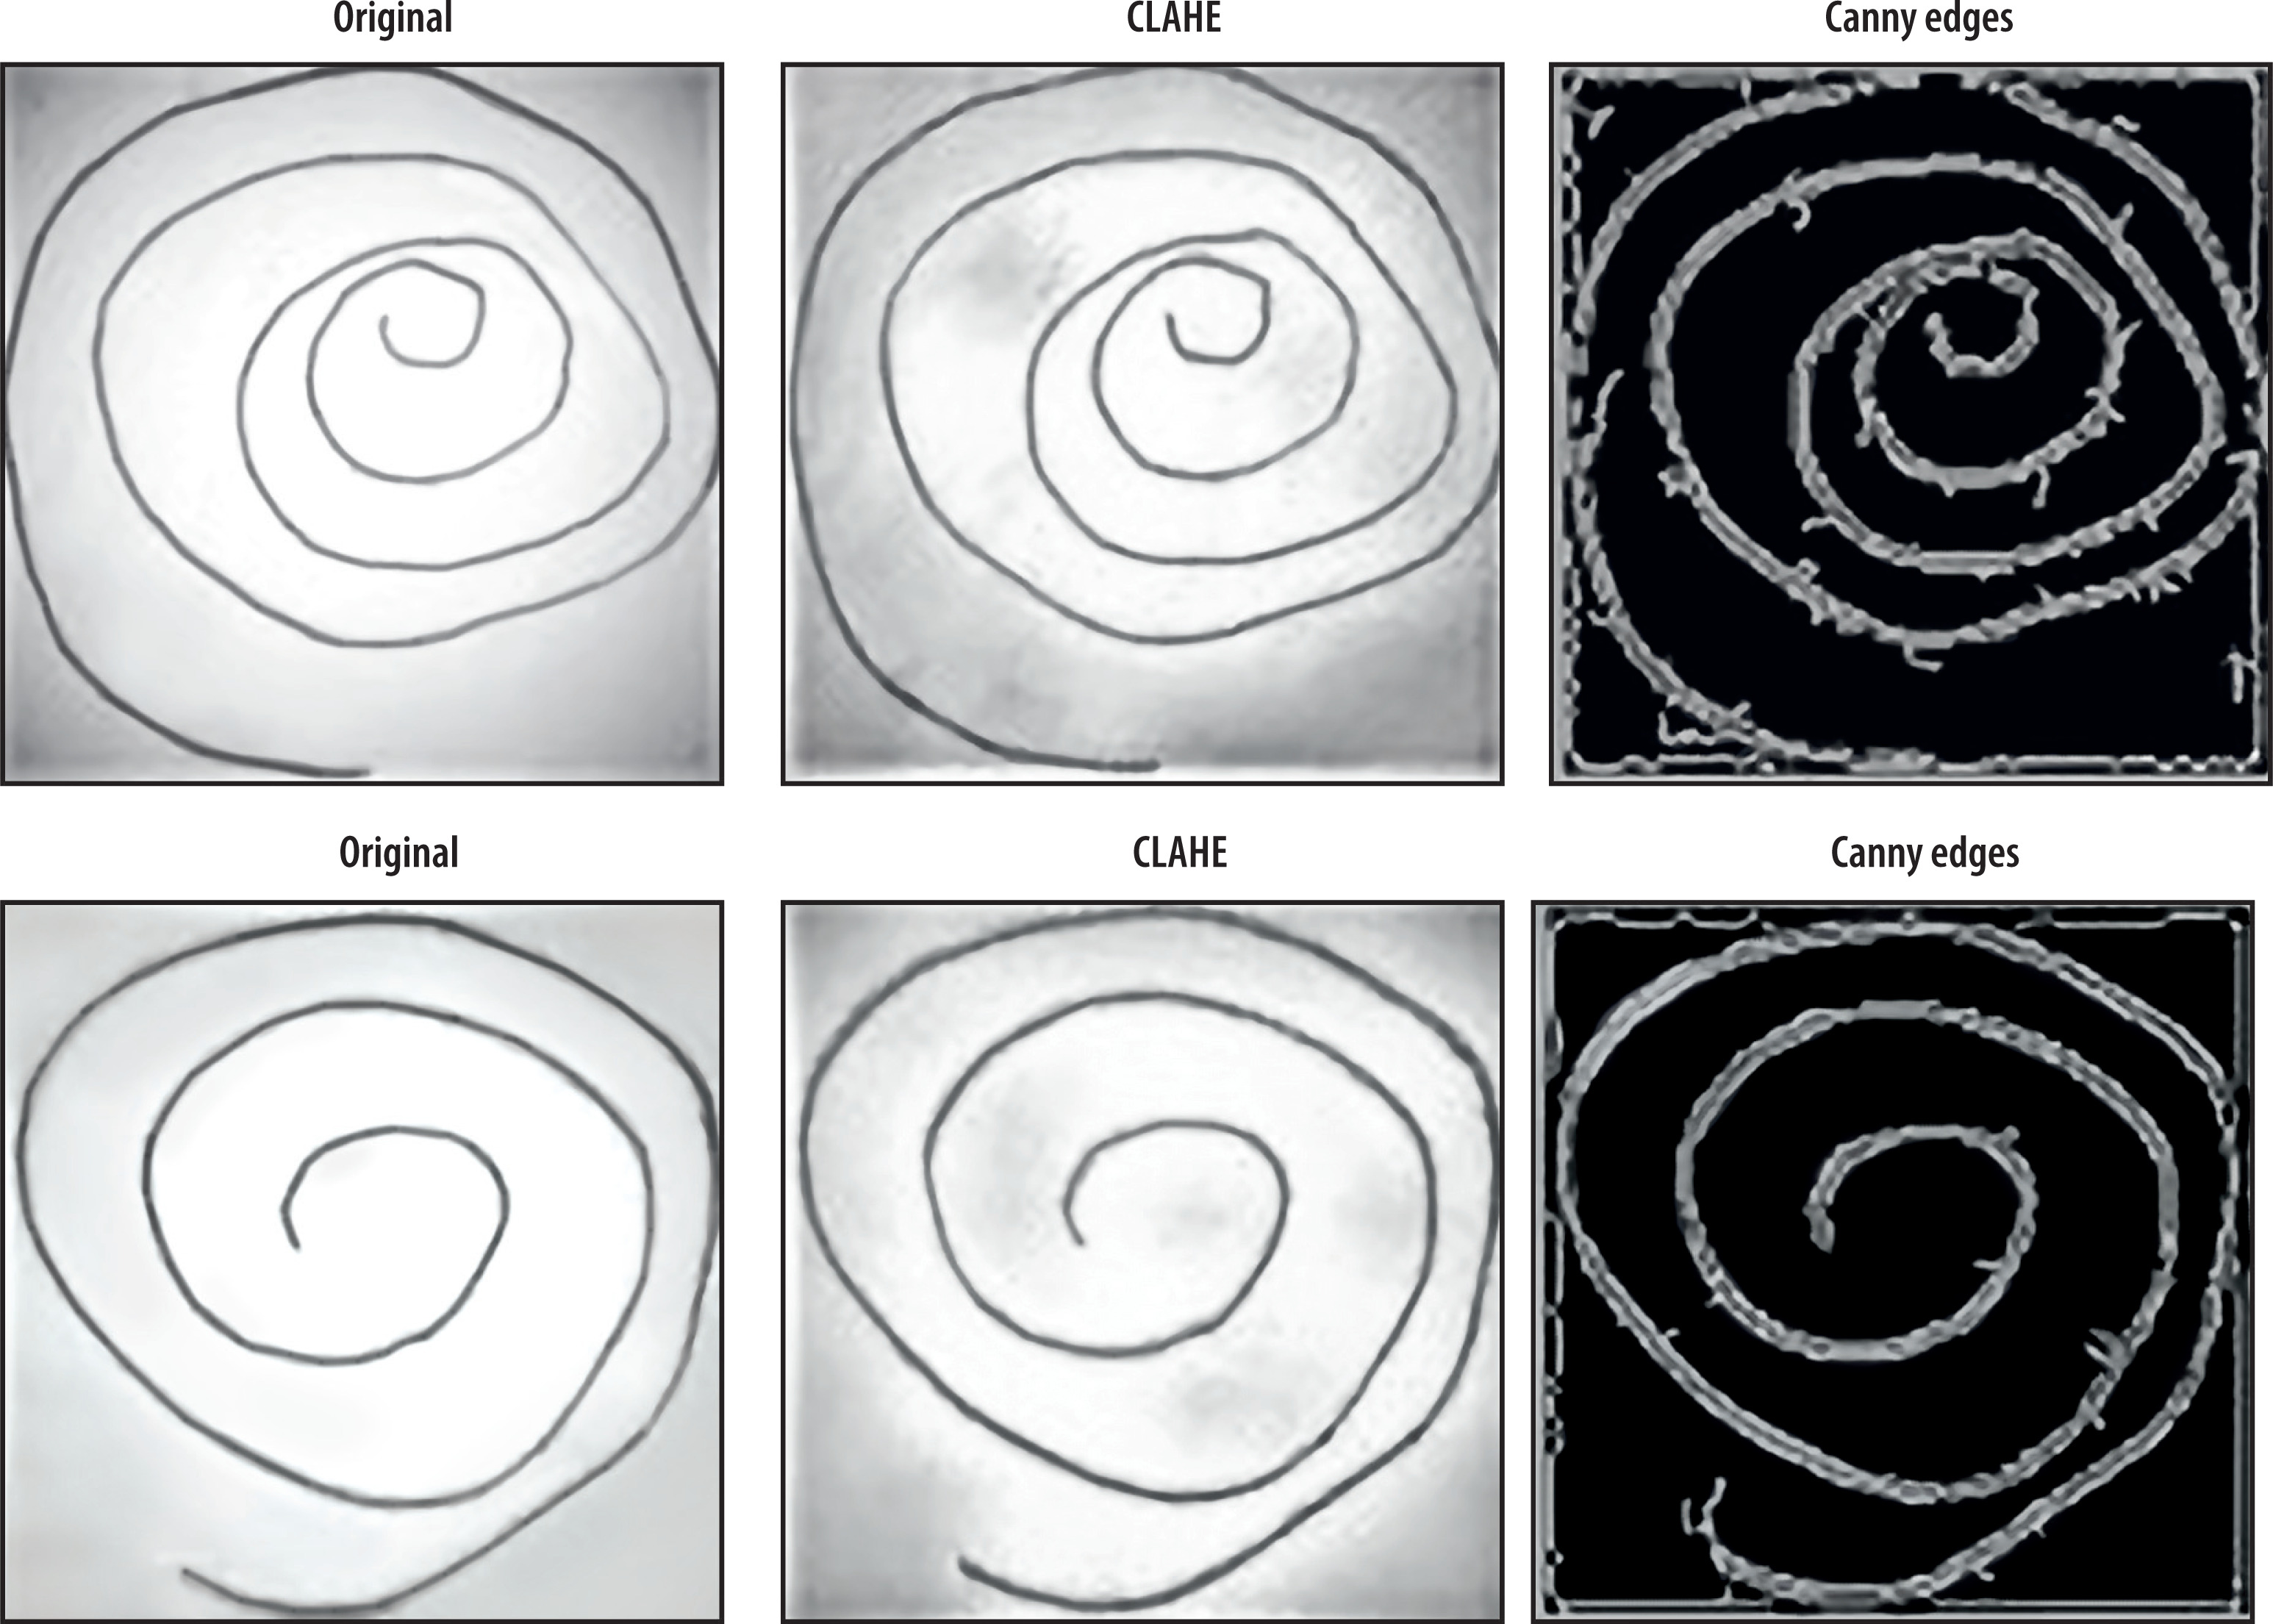
Apart from augmentation, a multi-representation fusion strategy is proposed for enriching features. Specifically, the approach operates on two channels, with the original black-and-white image serving as the initial channel. The second channel was created by applying contrast-limited adaptive histogram equalization (CLAHE) to improve local contrast and emphasize fine texture details, especially beneficial in tremor analysis, represented by Eq. 3 Then, Canny edge detection was applied to the improved image using CLAHE, thereby maintaining stroke boundaries and line irregularities of motor symptoms, using Eq. 4 and 5 [30]. Two highly complementary channels with different properties were superimposed over one another to construct a composite 2-channel image without compromising spatial, textural, and structural information, shown in Eq. 6. The improved representation was used to train the CNN-based models, resulting in improved discriminative features for Parkinson’s diagnosis from hand-drawn activities. Figure 2 shows the pre-processing pipeline of the dataset, and sample output after applying pre-processing is shown in Figure 3.
Let the original greyscale image be denoted as:
Where H = W = 128
To normalize pixel values to the range [0, 1], each pixel intensity is scaled as:
This normalized image forms channel 1 (original).
The CLAHE transformation, which applies localized histogram equalization with contrast limiting, can be abstractly represented as Eq. 3:
Where clipLimit = 2.0 and tileGridSize = (8,8) are hyper-parameters used to control local contrast. To further extract the edge maps from the CLAHE-enhanced image, Canny edge detection is applied using Eq. 4 and 5.
Where G is a gradient magnitude. Now non-maximum suppression and double thresholding with thresholds T1 = 30 and T2 = 100 yield the final binary edge map:
This forms channel 2 (edges). The final input tensor is constructed by stacking the normalized original image and the edge-detected (Canny) image as per Eq. 6:
Where Ifinal ϵ R(128×128×2) represents the composite input comprising spatial intensity and edge information.
Feature extraction using GLCM
For encoding the spatial pattern and texture features of hand-drawn spiral and waveform images, the GLCM is utilized to extract features [31]. The GLCM is a statistical technique that measures spatial pixel relationships by detecting the frequency with which a pixel with the grey-level value i is adjacent to a pixel with a value j at some offset and direction. It is especially suited for biomedical imaging, where minute details in texture contrast, such as tremors or micro-motion in hand-drawn images, are medically important. For every greyscale image used in this study, it was pre-processed to obtain a set of six discriminant texture features from its GLCM calculated across several directions (0°, 45°, 90°, and 135°), and their means were used. Extracted features are: contrast, correlation, energy, homogeneity, dissimilarity, and entropy, as given by Eq. 7 to 12. All the input images were processed using different GLCM-based feature extraction methods, which were employed either as standalone inputs to traditional classifiers or as inputs combined with deep learning approaches to increase interpretability and classify efficiently. Texture descriptors are significant indicators of drawing disturbances associated with motor disorders within PD.
Let P(i, j) represent the normalized GLCM for grey levels i, j ∈ [0, L − 1], where L is the number of grey levels (typically 256).
Contrast – Measures local variations in grey-level co-occurrence:
Correlation – Measures the joint probability occurrence of specified pixel pairs:
where μi, μj and σi, σj are the means and standard deviations of the row and column marginal distributions.
Energy – Also known as angular second moment (ASM); measures textural uniformity:
Homogeneity – Measures the closeness of the distribution of elements to the GLCM diagonal:
Dissimilarity – Similar to contrast but with a linear weight:
Entropy – Measures the randomness or complexity of texture patterns:
(With the convention that 0·log2 0 = 0).
Proposed model architecture
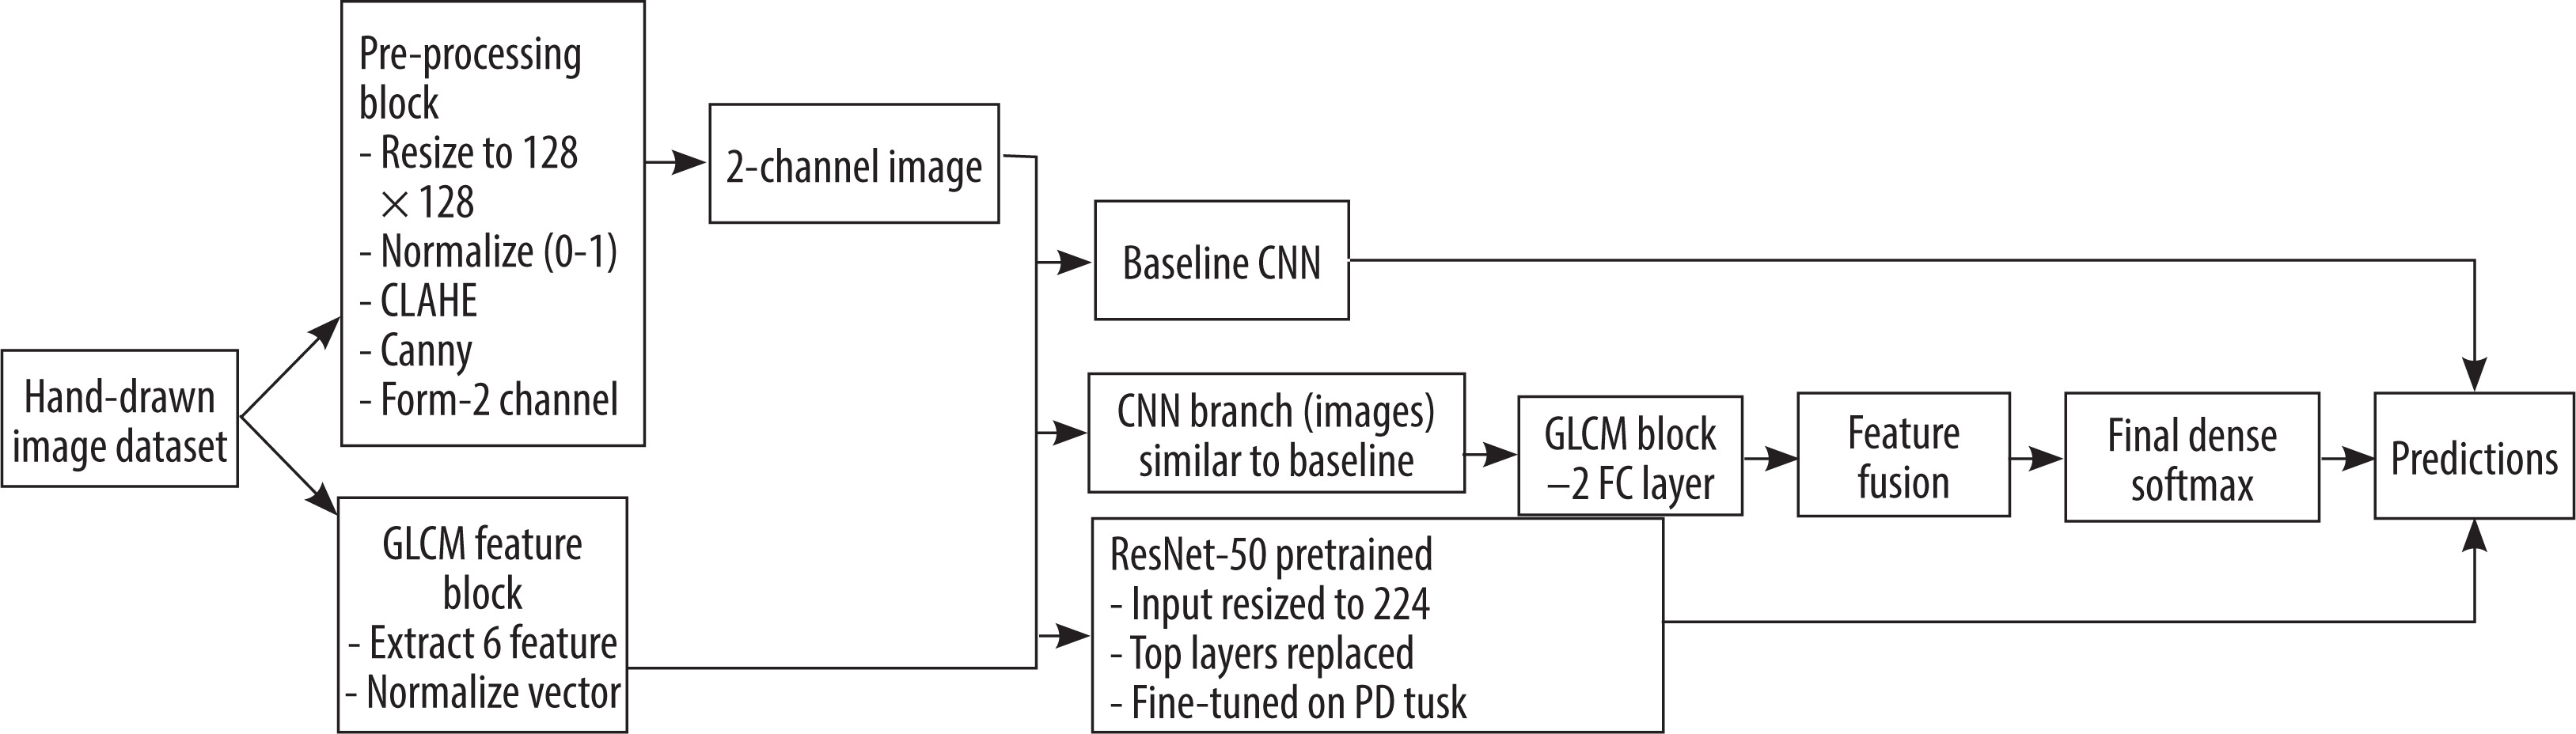
To assess the capability of hand-drawn image descriptions in classifying PD, three model architectures were employed: a lightweight baseline CNN, a CNN-GLCM fusion model, and a ResNet-50 fine-tuned transfer learning model. Each model was implemented to research different views of spatial, textural, and semantic features of the image input. The model pipeline is shown in Figure 4, and Algorithm 1 illustrates the main steps involved in designing the hybrid model (CNN + GLCM).
Figure 4
Proposed model pipeline for Parkinson’s disease classification using hand-drawn spiral and waveform images
Baseline CNN
The baseline CNN was designed to be a robust and straightforward architecture for handling the 2-channel input images produced by the pre-processing pipeline (original normalized + Canny edges). Three convolutional blocks follow a rectified linear unit (ReLU) activation (Eq. 14), a batch normalization (Eq. 15), and a max-pooling (Eq. 16) layer. The convolutional layers are sized to extract low- to mid-level features such as edges, curves, and junctions related to hand motions in a stepwise order. The final convolutional output is flattened and passed through two dense layers with dropout regularization, followed by a sigmoid or softmax activation (Eq. 17 to 20). The light CNN model serves as a baseline for comparison, assessing the impact of additional handcrafted or pre-trained features. Let the 2-channel pre-processed image be denoted as – I ε R(128×128×2); each convolution layer applies a set of learnable filters W(1) followed by bias b(1); the output feature map represented as Eq. 13.
Where * denotes 2D convolution, is the layer index and I(0) = I is the input image.
Activation map
Output after batch normalization
Where μ is a mean, σ2 is variance, γ is a learnable scale and β is a shift parameter in batch normalization. The pooled output at layer 1 is represented as Eq. 16 and the flattened vector from the last convolution block is represented in Eq. 17.
Hidden representation from dense layer is h1 and h2, where W1 and W2 are weight metrics for dense layers, and b1 and b2 are bias vectors for dense layers.
Final output prediction is represented by Eq. 20 where Wo and bo are weight and bias of the output layer.
CNN with GLCM fusion
To leverage both spatial information from images and texture-based statistical information, a combined model was proposed that combines CNN-learned features and GLCM-based handcrafted features. The GLCM feature vector (6D: correlation, contrast, energy, entropy, etc.) was first normalized and then passed to a fully connected dense sub-network with dropout and ReLU activation. In parallel, the image stream was passed to the same baseline CNN. Each branch’s output was concatenated and passed through a shared dense layer and subsequently to the classification head. The proposed two-branch fusion enabled the model to leverage both types of features – deep features as well as interpretable textural features – thereby enhancing both performance and clinical interpretability. Let fimg be the feature vector from baseline CNN and gglcm ε R6 be the GLCM feature vector with 6 dimensions; Eq. 21 represents the GLCM subnetwork:
Where Wg and bg are weight and bias for the dense layer processing GLCM features. Eq. 22 represents the feature fusion by concatenating the fimg and hidden representation from GLCM sub-network (hglcm).
Now the final classification and prediction are represented by Eq. 23 and 24, where h3 is the hidden representation after fusion and dropout, W3 is weight after fusion, b3 is bias after fusion, Wo is weight after final classification, and bo is bias after final classification.
Fine-tune ResNet-50
To leverage the representational capacity of deep convolutional models, we used the pre-learned ResNet-50 model on ImageNet and fine-tuned it for PD classification. The last layers of ResNet-50 were replaced with a new classification head tailored to the target task. The ResNet-50 input model was created by duplicating or rescaling the 2-channel input into the desired shape of 224 × 224 × 3. The lower layers were first frozen to preserve pre-trained weights and only train the top dense layers. Selective unfreezing was then conducted with a slower learning rate to fine-tune deeper layers. This design acted as a strong baseline for high-level abstraction and transfer learning performance with small clinical image datasets. Let pre-processed image X ε R(224×224×3) be created by repeating 2-channel input. The convolution and residual block of ResNet-50 is represented as:Z(1) = Conv(X), Z(2) = ResidualBlock1 (Z(1)),…. Final classification and prediction of the model are represented as Eq. 25 and 26, where Wres and res are weight and bias of the top dense layer after ResNet block, hres (Eq. 25) represents the hidden layer activation from dense layer post-ResNet, fresnet is the global average pooled output from final ResNet layer (fresnet ε Rd), and Wo and bo are weight and bias of the final output layer.
CNN – convolutional neural network, FC – fully connected, GLCM – grey-level co-occurrence matrix, PD – Parkinson’s disease
Algorithm 1: Parkinson’s disease detection using hybrid CNN + GLCM model
Input: Hand-drawn image dataset labelled as Parkinson or healthy, image size: 128 × 128
Output: Trained hybrid model, classification accuracy and performance report
Begin
End
Results and discussion
Experimental setup
To train the model, the simulations were performed on a local computing setup featuring an Intel Core i7 processor (8th Generation), 16 GB of RAM, and the Windows 10 operating system [32]. The models were implemented in Python 3.x using TensorFlow 2.9 and the high-level Keras API to train the neural network. The main libraries employed included OpenCV for pre-processing the images, NumPy and Pandas for data processing, scikit-learn for performance analysis and feature extraction using GLCM (utilizing skimage.feature), and Matplotlib for graphics. All three model architectures were tested: baseline CNN customized for our data, a CNN + GLCM hybrid fusion model, and a fine-tuned ResNet-50. All three models were trained on an equivalent pre-processed 2-channel input and stratified train-validation splits for a proper comparison. Data augmentation was used uniformly on all experiments using ImageDataGenerator.
To guarantee equitable and impartial model assessment, all experiments were structured to maintain patientlevel independence among training, validation, and testing datasets. The hand-drawn spirals and waveforms of each record were combined, and the data-splitting process was conducted at the record level rather than the image level. This method made sure that no sketch from the same patient was in more than one partition. Dataset 1 (augmented hand-drawn data for PD) was divided into an 80 : 20 train-validation split, while Dataset 2 (an independent cohort acquired under different drawing and scanning settings) was reserved solely for external testing. This separation at the subject level ensures that the model’s performance genuinely generalizes to novel individuals, rather than merely memorizing image-specific patterns, thereby enhancing clinical reliability.
Hyper-parameters were manually tuned for stability during training and performance. A summary of the important parameters used across models is provided in Table 2. The choice of critical hyper-parameters was informed by empirical testing. The input image size of 128 × 128 was chosen to find a good compromise between speed and the preservation of spiral and waveform details, which are important for analysing Parkinsonian tremors. The size 224 × 224 was kept for ResNet-50 to match its pre-training setup on ImageNet. The Adam optimizer’s learning rate of 0.001 allowed for quick but stable convergence without overshooting minima, which is common for small-batch medical imaging. The batch size of 32 made sure that the gradient updates were steady on the available graphics processing unit (GPU) memory. The epoch count (20-25) was set once the accuracy and loss curves showed that convergence was stable, which stopped overfitting. We used dropout (0.4) and batch normalisation to regularise the data. The GLCM branch dense units (16) had enough space to store six handcrafted texture descriptors without any extra data. In general, these parameters were adjusted in a loop until the best balance of accuracy, generalisation, and training stability was found for all models.
Table 2
Model parameters and configuration summary
Performance analysis
To analyse the efficacy of the models proposed for classifying PD to the highest degree, controlled experiments have been conducted on various input configurations and model structures. Particularly, the behaviour of three fundamental deep models has been compared – Baseline CNN, CNN with GLCM fusion (CNN + GLCM), and ResNet-50 fine-tuned – on two input groups: (1) raw greyscale hand-drawn images and (2) pre-processed 2-channel images derived from fusing normalized greyscale and Canny edges. Furthermore, the same fourth model, with just the six GLCM texture features and fully connected layers, was also experimented with to compare the discriminability of handcrafted features alone.
Training and validation performance were evaluated for every model using principal classification measures, named precision, recall, and F1-score, as well as training and validation accuracy curves to assess generalization and overfitting. Model optimization with a training-validation split was followed by testing on different datasets, using Dataset 2 as test data to evaluate the final classification performance and model stability. To further enhance the clinical explainability of deep learning predictions, Grad-CAM was applied to examine test examples carefully. Using Grad-CAM heatmap visualizations, prominent regions in drawing images were identified that influenced the model’s predictions, enabling transparent evaluation of learned representations and increasing the model’s reliability for real-world diagnostic applications.
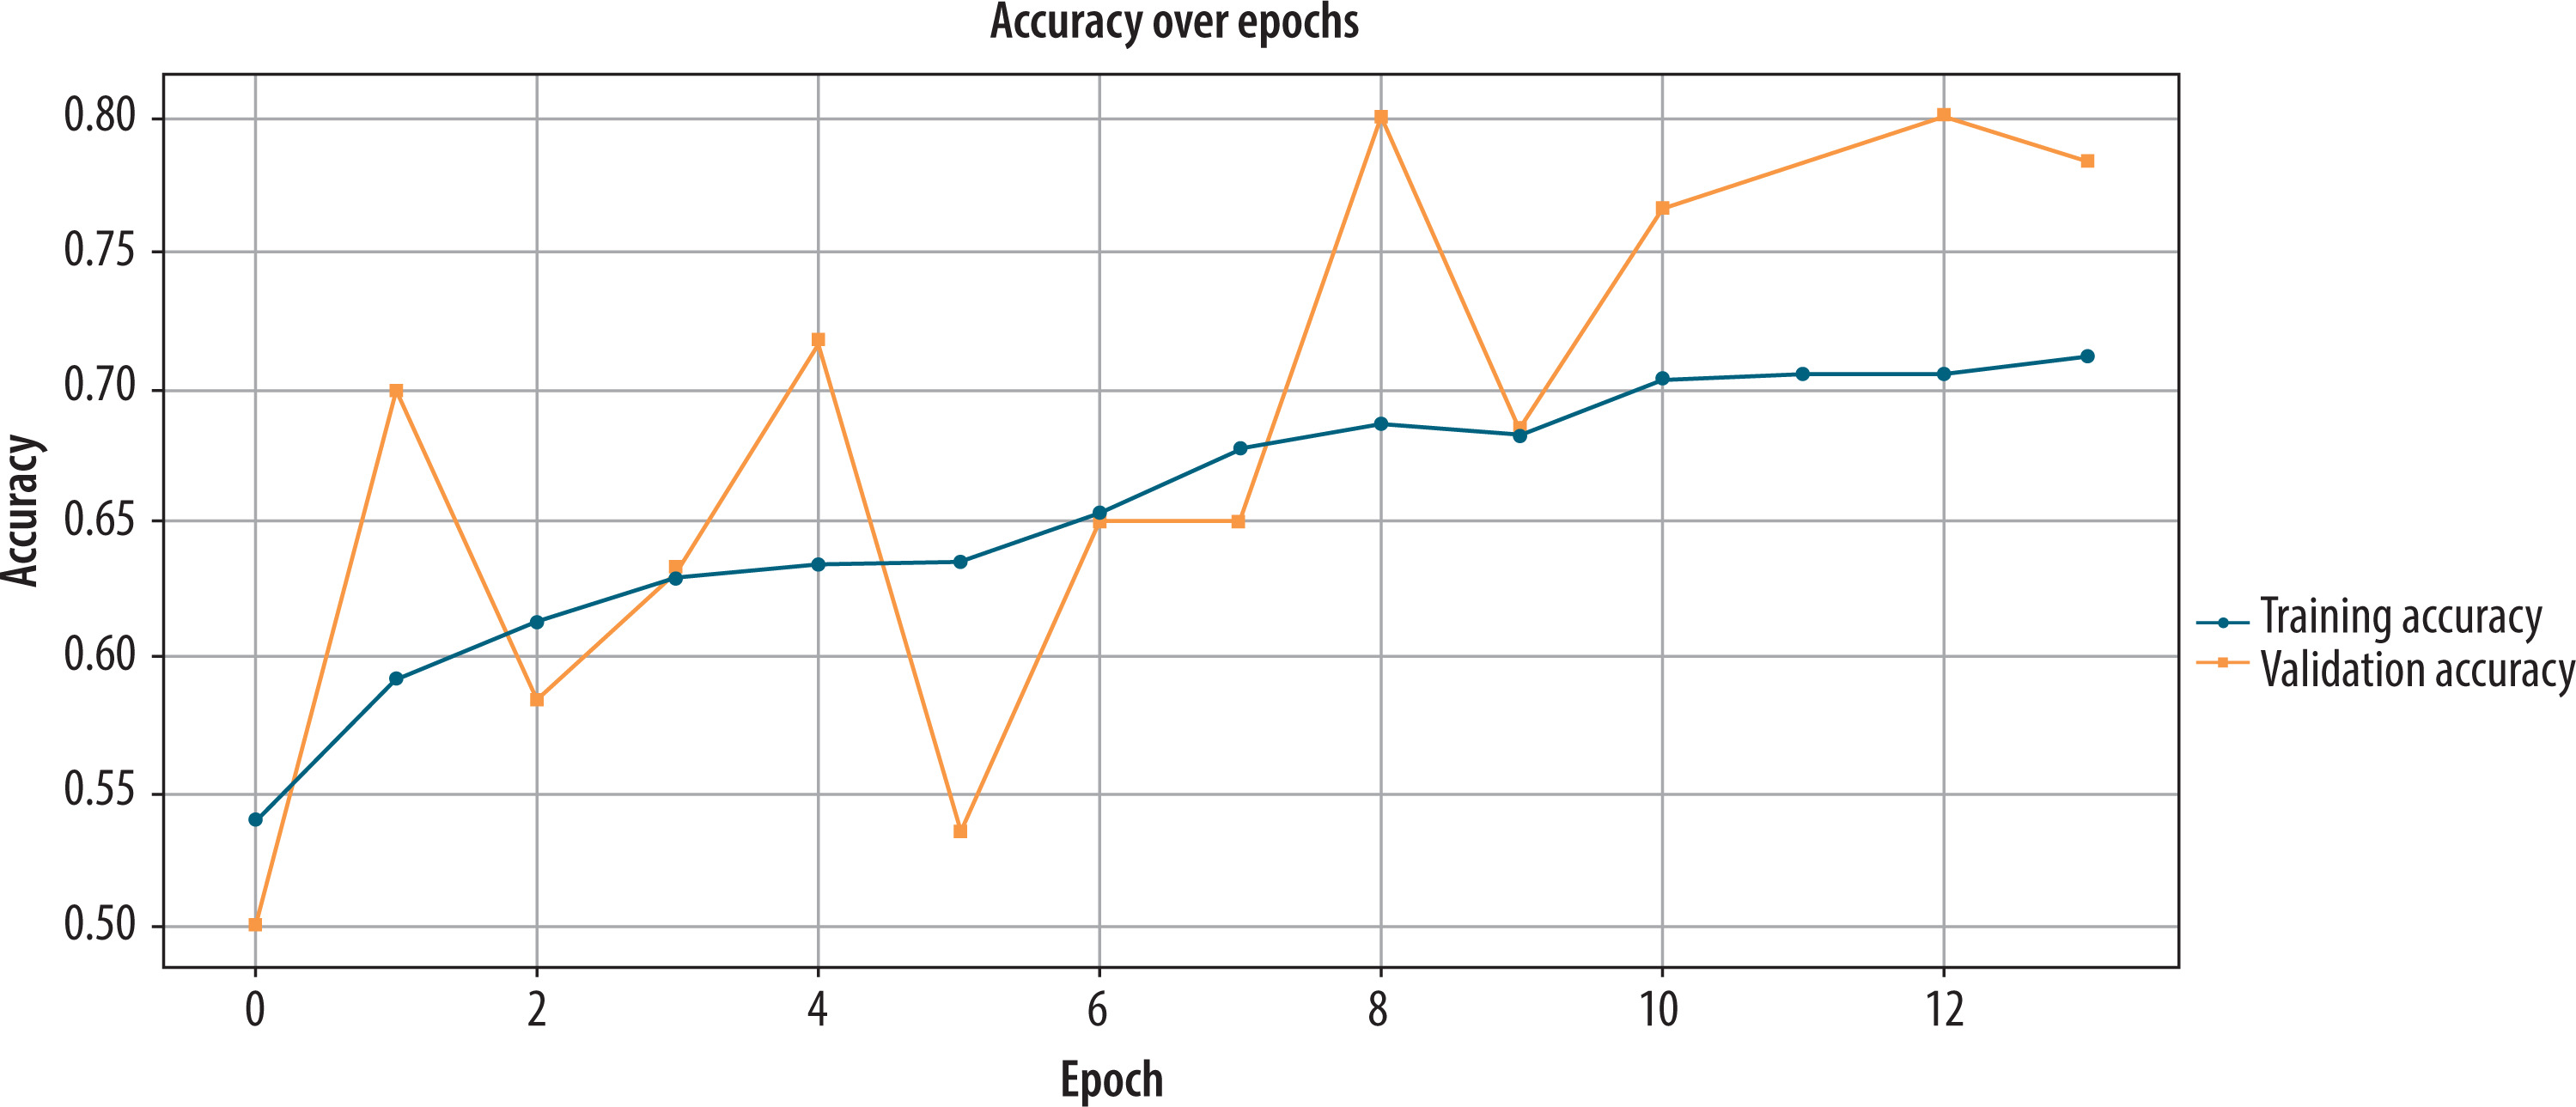
Performance analysis of baseline CNN on original dataset
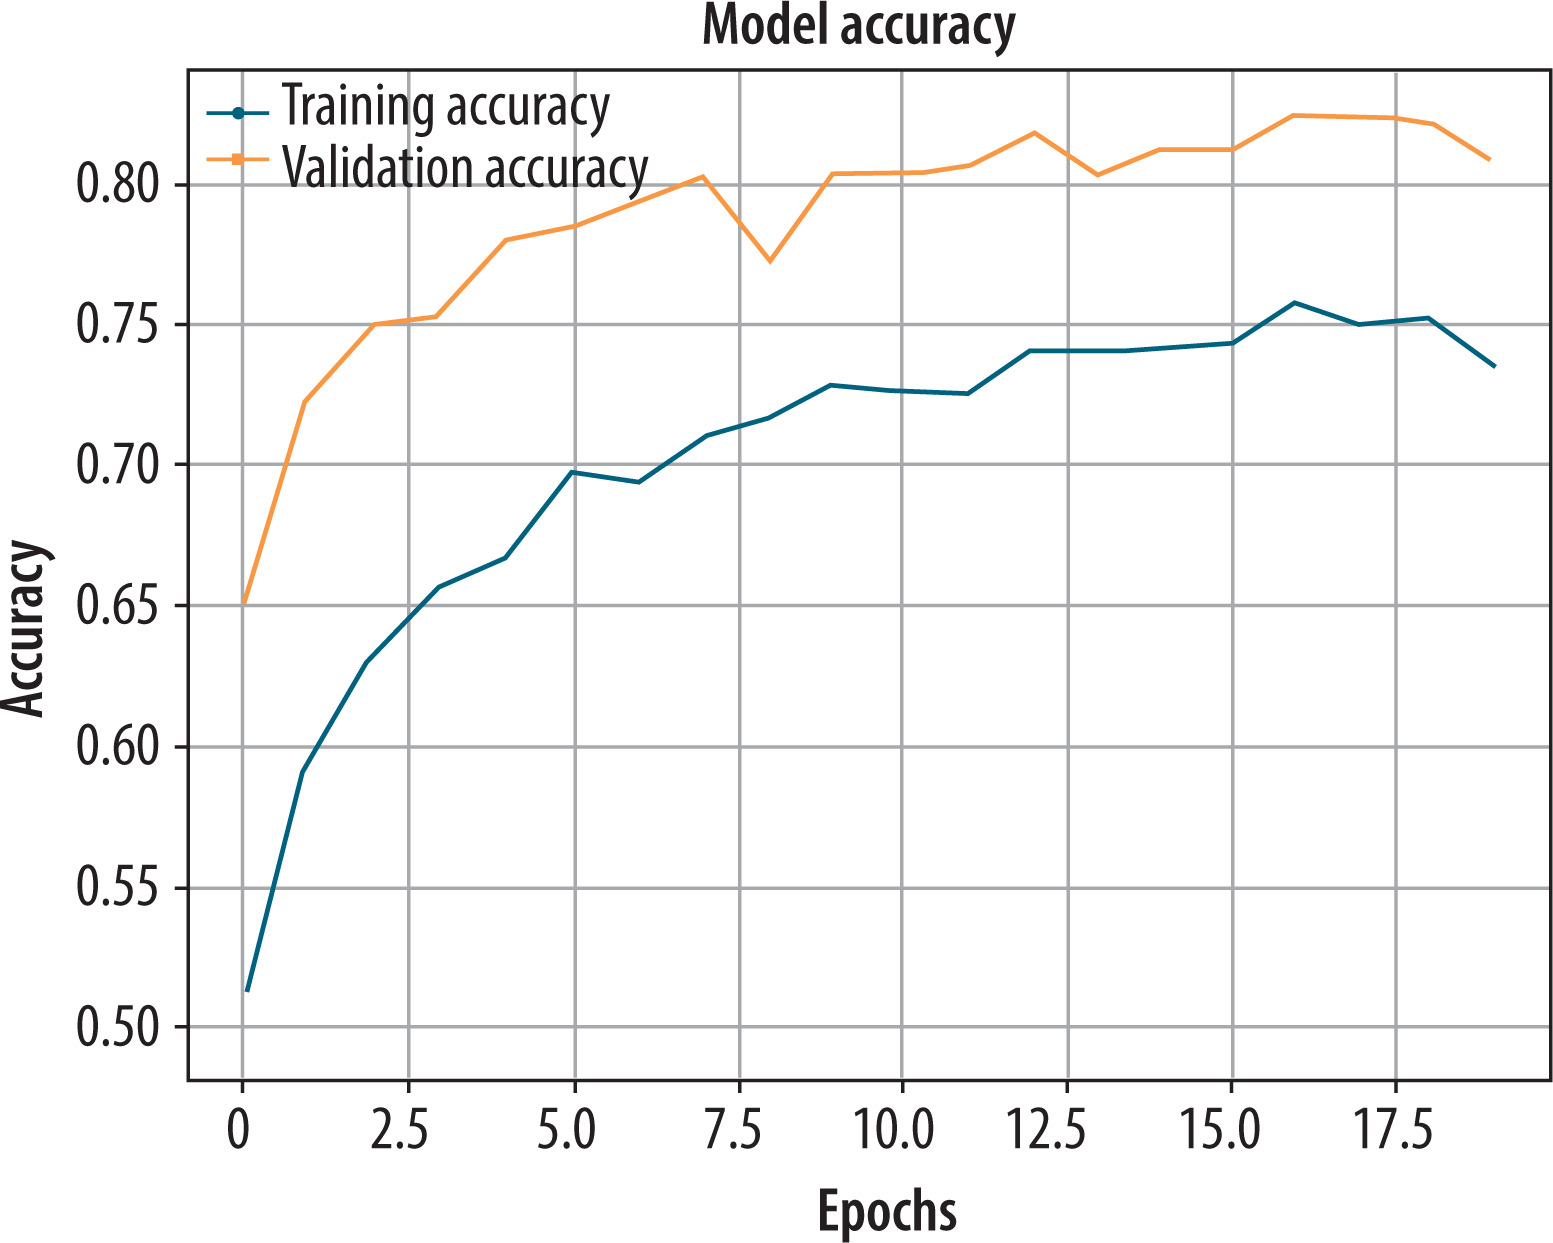
Initially, the baseline CNN was trained on greyscale hand-drawn images to determine whether it could recognize PD. During the training and validation process, the model’s performance was monitored for 20 epochs. According to Figure 5 from epoch 12, the training accuracy plateaued at approximately 72%. On the other hand, validation accuracy fluctuated from epoch to epoch, reaching a peak value of 78.3%. It indicates that while the model could learn significant patterns, it was somewhat sensitive to the changes in the validation data. After the last model validation on the validation set, the achieved evaluation metrics were encouraging: accuracy = 0.783, precision = 0.791, recall = 0.762, and F1-score = 0.775. They indicate a well-balanced classification ability of the model with a good trade-off between sensitivity and specificity. Despite some reported variability in training and validation accuracy trends, the overall F1-score indicates that the baseline CNN generalizes quite adequately when trained on raw greyscale features alone without feature fusion.
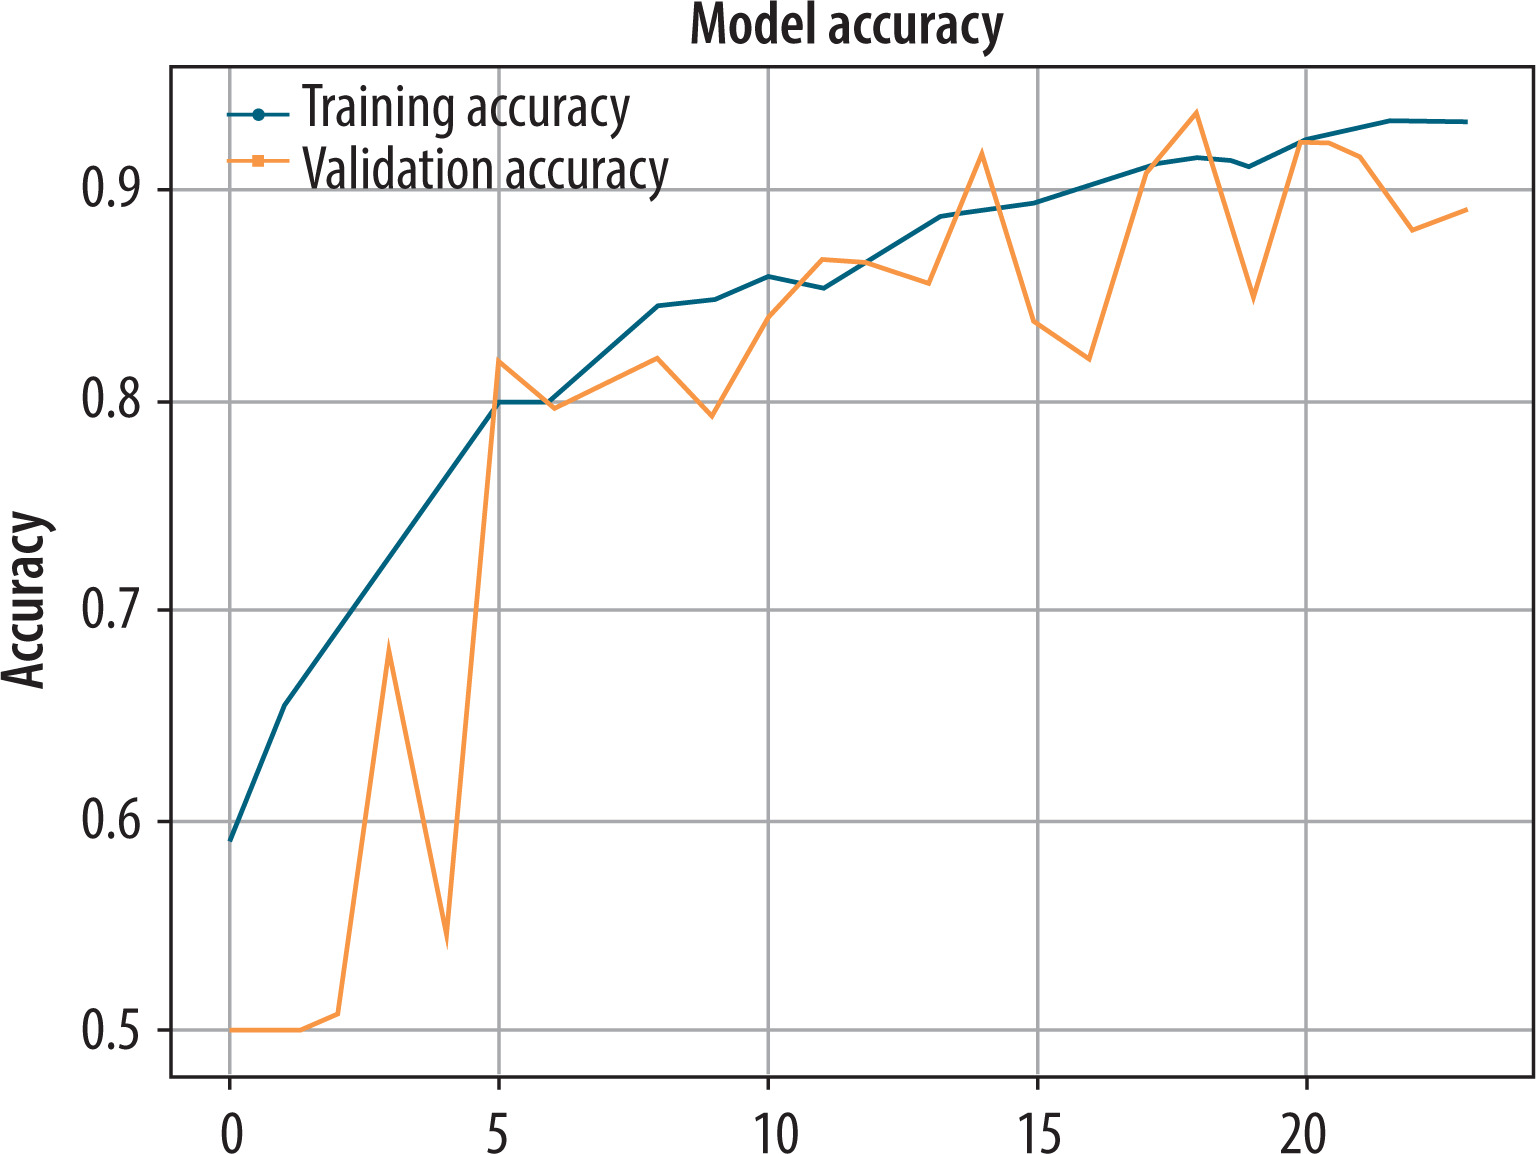
Performance analysis of baseline CNN on pre-processed normalized greyscale and Canny edges dataset
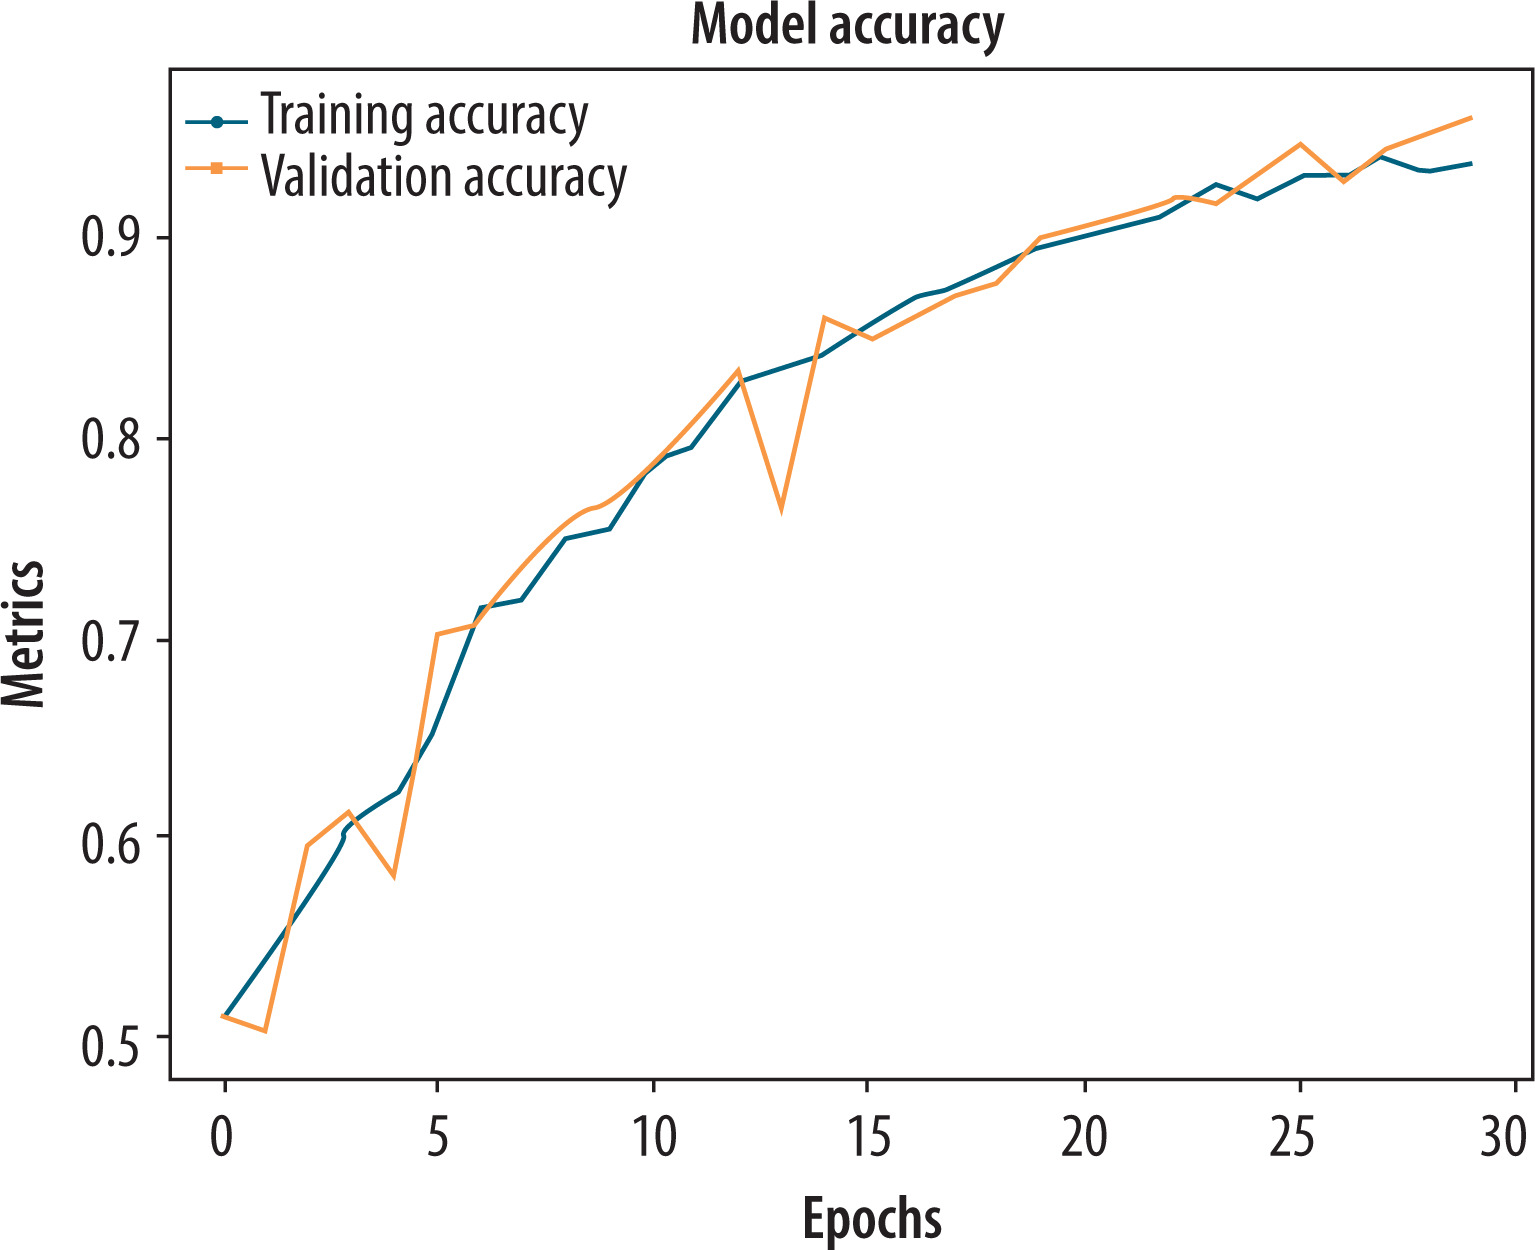
To enhance the model’s capacity to extract both intensity and structural stroke data, the baseline CNN was trained on a 2-channel input representation created by stacking the normalized greyscale image and its Canny edge map. The fusion enabled the model to leverage complementary information regarding the quality of stroke, sharpness at boundaries, and tremor patterns that are of maximal relevance in the diagnosis of PD. As is evident from Figure 6, the training accuracy grew steadily, crossing 95% at epoch 23, indicating excellent learning of discriminative features. The validation accuracy increased steadily and stabilized at approximately 88%, with some minor fluctuations, indicating good generalization to new samples and minimal overfitting. A quantitative assessment on the validation set revealed a significant improvement over the original greyscale input. The model achieved an accuracy of 0.88, precision of 0.843, recall of 0.872, and an F1-score of 0.845. The measurements validate a good and strong classification ability with both false negatives and false positives well controlled by the model. The enhanced F1-score validates the strength of incorporating edge-enhanced representations, in addition to raw pixel intensity, in enhancing performance in the classification of PD.
Performance analysis of hybrid CNN + GLCM on original dataset
The hybrid model, which integrated CNN attributes with handcrafted GLCM-based texture attributes, was tested on the original greyscale hand-drawn image data to simulate the complementary advantages of spatial and statistical information. The CNN branch learned abstract spatial features from the images. The GLCM branch, on the other hand, provided six handcrafted features that characterized textural attributes, such as contrast, energy, and correlation. These two streams of attributes were combined before classification to produce a hybrid model.
As shown in Figure 7, the model was trained consistently and comprehensively across 20 epochs. Training accuracy and validation accuracy improved consistently and converged at approximately 89% with near-zero difference between them – a sign of high generalization and low risk of overfitting. Quantitative analysis also confirmed the efficiency of the proposed hybrid model. The model recorded a classification accuracy of 0.89, precision of 0.901, recall of 0.823, and an F1-score of 0.891. The good precision is a measure of the model’s capability to suppress false positives, while the strong F1-score indicates a good balance of sensitivity and specificity. The metrics value indicates that the inclusion of handcrafted GLCM features significantly improved the discriminative capability of the CNN, especially in detecting fine texture anomalies in Parkinsonian states.
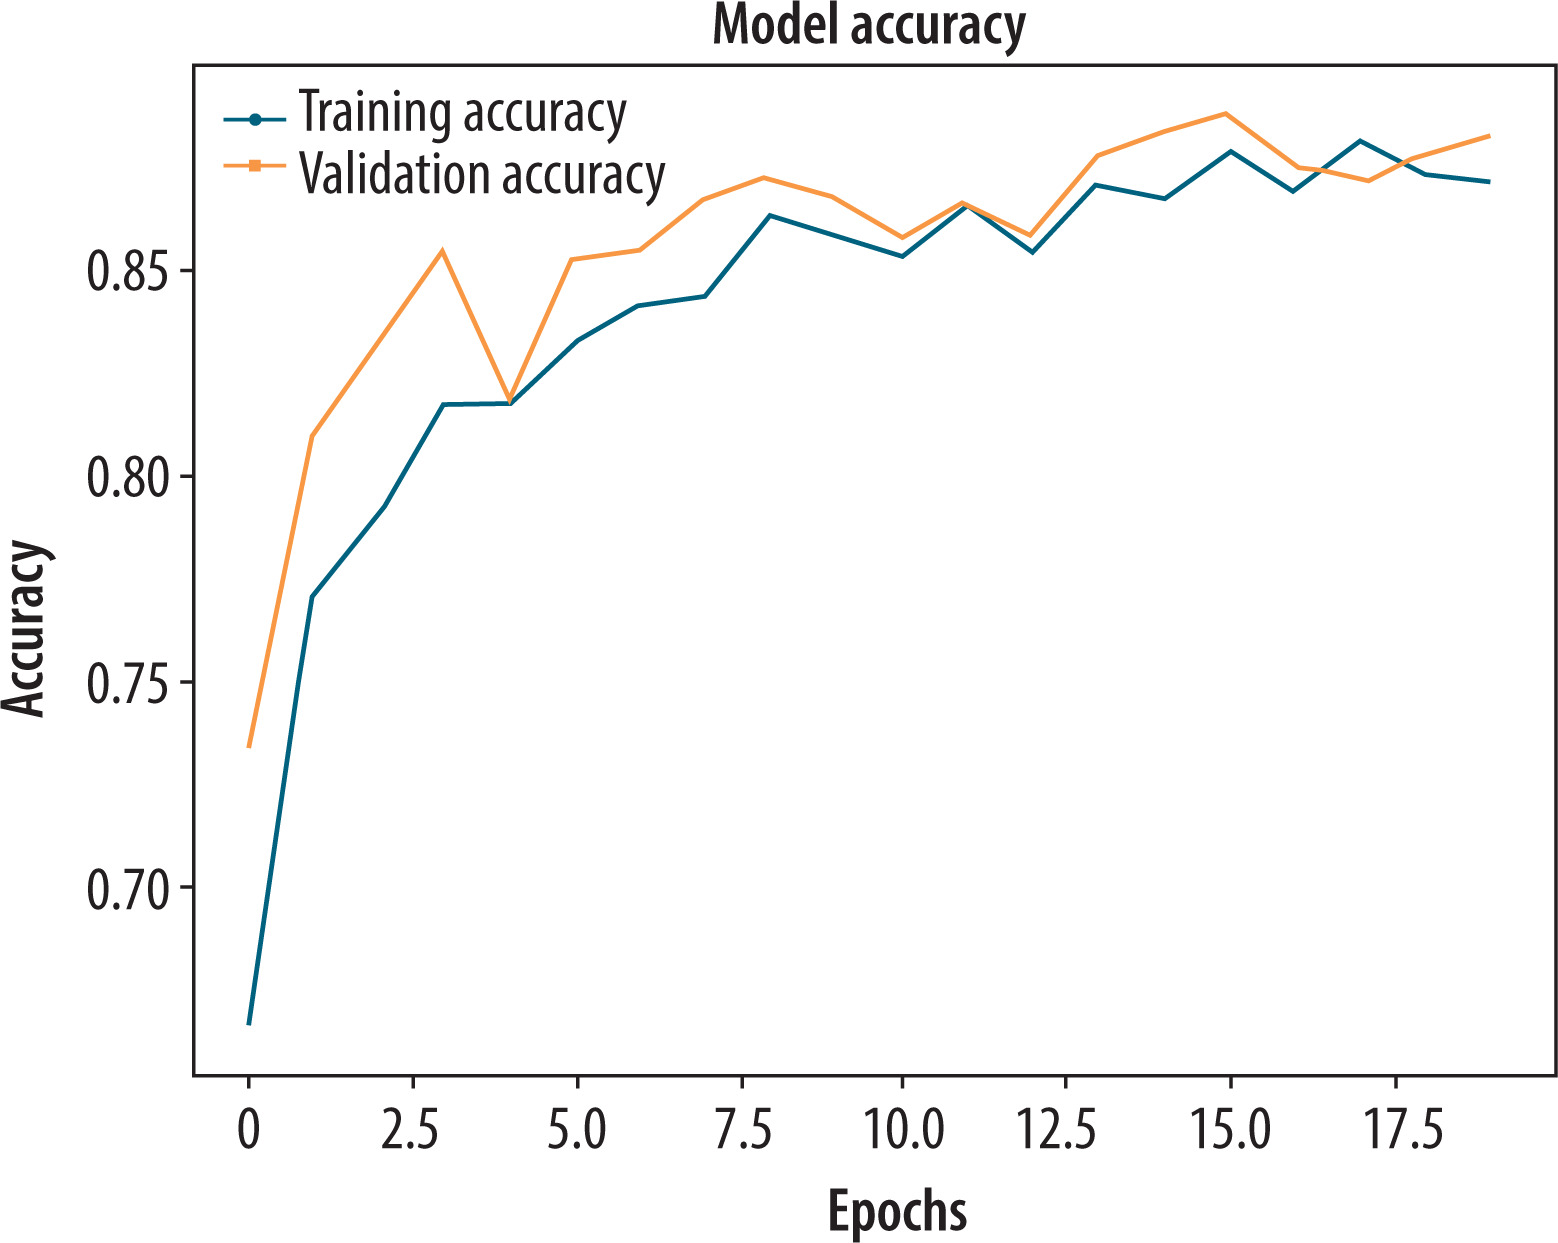
Performance analysis of hybrid CNN + GLCM on pre-processed normalized greyscale and Canny edges dataset
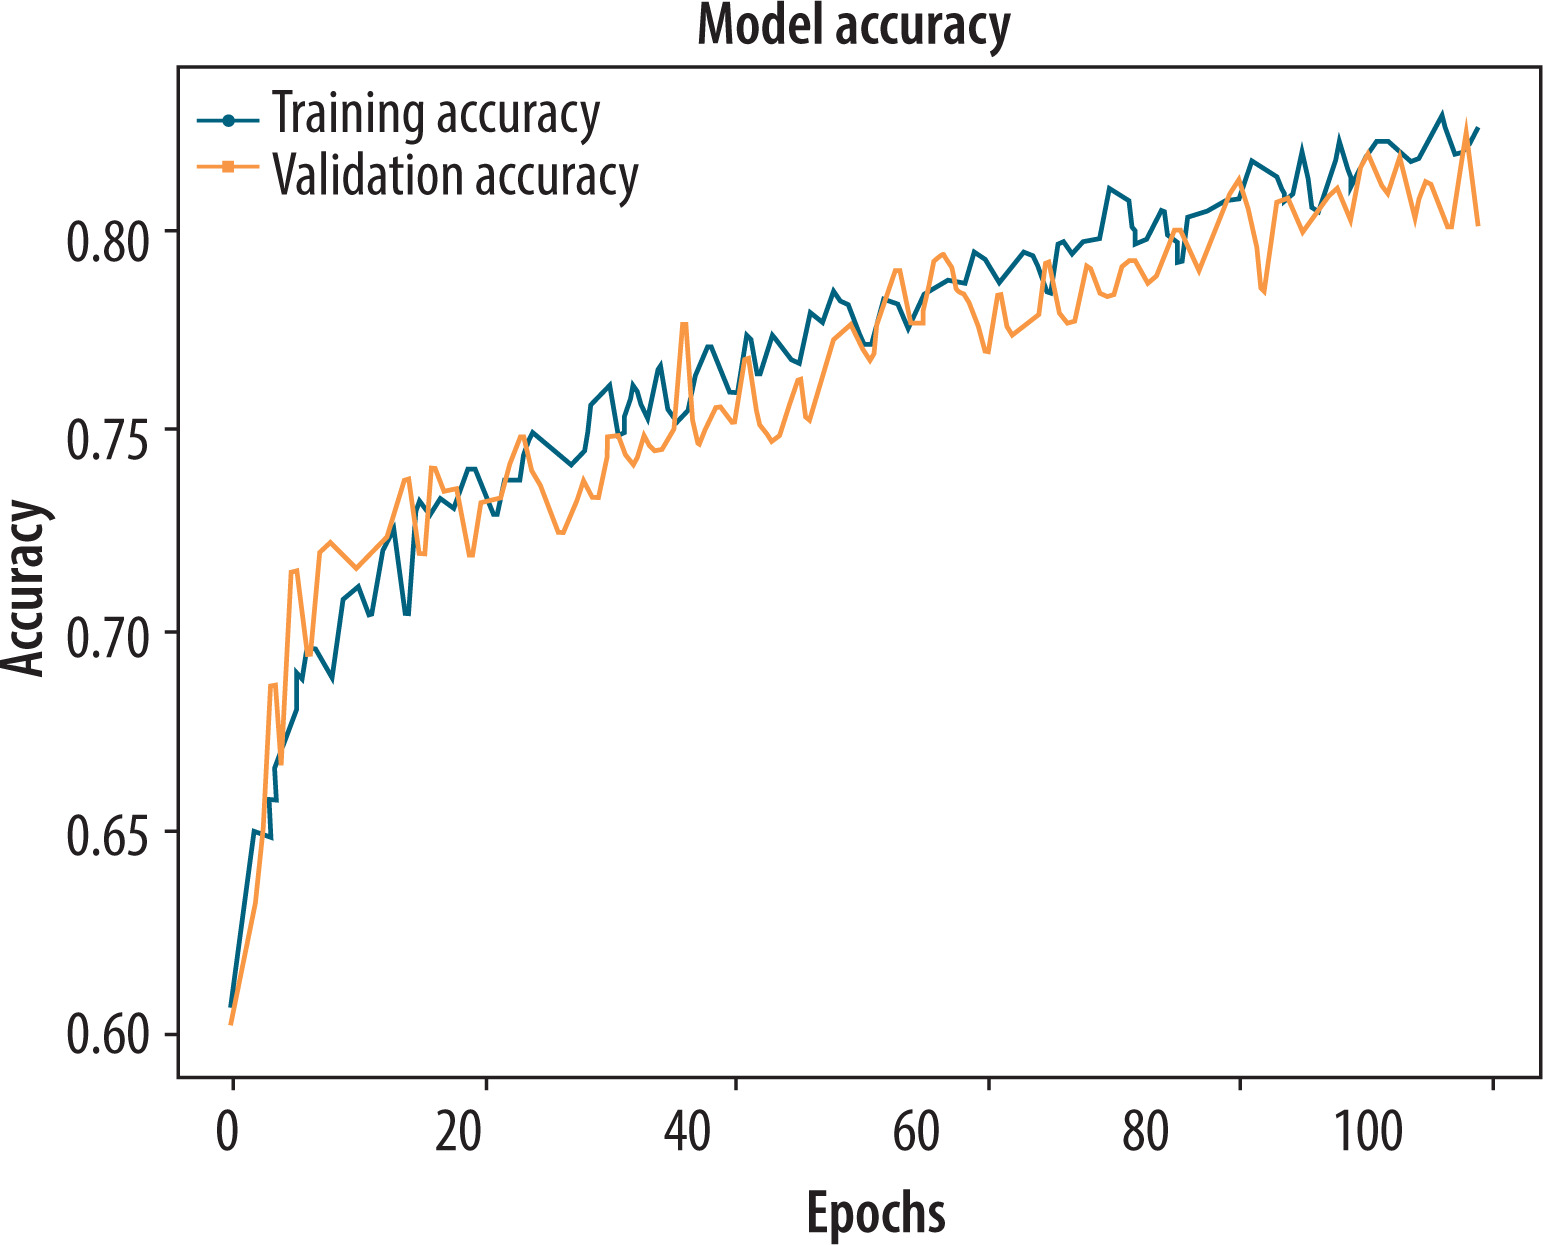
The hybrid CNN + GLCM model was further evaluated using a pre-processed 2-channel image representation, which combined normalized greyscale images with Canny edge maps to enhance the detection of structural features. These spatial features were combined with six handcrafted GLCM texture descriptors, providing a rich and complementary feature set for effective PD classification. According to Figure 8, both training and validation accuracy exhibited a consistent upward trend throughout the training process. The alignment between training and validation performance indicates strong generalization and minimal overfitting. Consequently, the validation dataset performed well because the model converged smoothly. The proposed hybrid model achieved a quantitative accuracy of 0.9702, a precision of 0.945, a recall of 0.923, and an F1-score of 0.954. Due to its high reliability and ability to strike a balance between sensitivity and specificity, this model is well suited for clinical decision support. Additionally, edge-enhanced image information improved the model’s ability to detect subtle differences in drawing patterns, contributing to its optimal performance.
Performance analysis of ResNet-50 on original dataset
ResNet-50 was pre-trained on ImageNet and fine-tuned for PD classification using the original greyscale hand-drawn spiral and waveform images. To meet the architecture’s requirement for three channels, the input was resized to 224 × 224 pixels. The top layers of the model were replaced with custom classification heads that were selectively tuned to learn task-specific features during training. Figure 9 shows that both training and validation accuracy increased steadily during the first few epochs. There was a consistent upward trend in the validation accuracy, which peaked at 80.6%, while the training accuracy plateaued at about 75%. Despite the slight discrepancy, the pre-trained layers provided a strong feature base, although the fixed lower layers limited their ability to adapt to subtle PD-related variations.
Despite this, the model performed well, achieving a final accuracy of 0.8067, precision of 0.789, recall of 0.823, and an F1-score of 0.83. Based on the F1-score, it appears that the ResNet-50 model is a viable option for PD detection without the inclusion of edge-enhanced features. These results validate the effectiveness of transfer learning in biomedical image classification tasks, especially when dealing with moderately sized datasets.
Performance analysis of ResNet-50 on pre-processed normalized greyscale and Canny edges dataset
To further enhance the model’s capacity to identify structural and textural changes in hand-drawn images, the ResNet-50 model was also fine-tuned on pre-processed 2-channel representations, such as normalized greyscale input and Canny edge maps. The combined input was modified to meet the three-channel requirement of ResNet-50 and used to transfer-learn discriminative patterns for PD detection. As shown in Figure 10, the model demonstrated steady progress in training accuracy over 23 epochs, ultimately achieving 95%. Validation accuracy varied slightly with responsiveness to image-level change but levelled off at a strong 88.9%. This trend suggests effective learning with acceptable overfitting, which can be attributed to the depth of ResNet-50 and the expressiveness of the input representation.
Figure 10
Training and validation accuracy plot of the ResNet-50 using Pre-processed normalized greyscale and Canny edges dataset
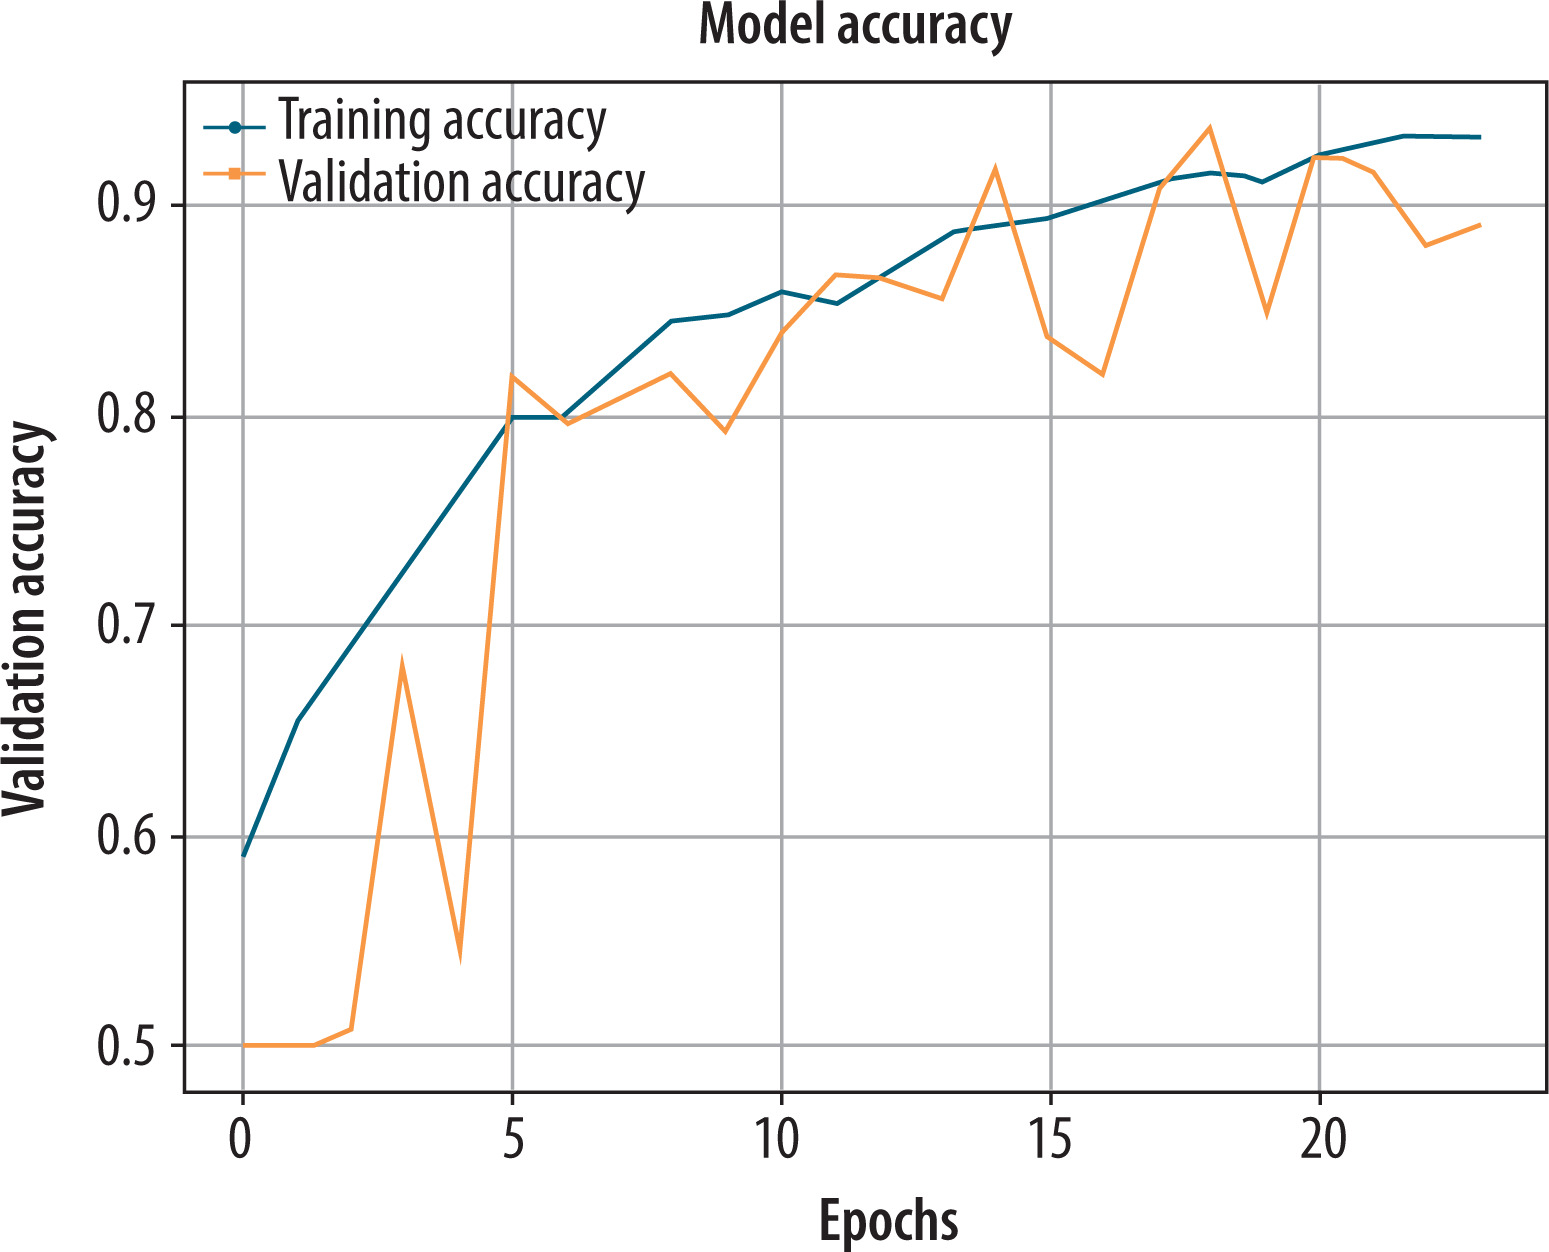
Validation set results yielded exceptional values for the metrics: 0.8896 for accuracy, 0.8220 for precision, 0.856 for recall, and an F1-score of 0.89. Overall, the model retains high sensitivity and specificity. ResNet-50’s edge-enhanced visual features enabled deeper layers to detect and identify minor line distortions of tremor origin, as well as boundary irregularities, with greater accuracy.
Performance analysis of only GLCM on original dataset
As an intermediate experiment to calculate the discriminative power of handcrafted statistical features alone, we have trained a shallow network that uses only the six GLCM-derived features (contrast, dissimilarity, homogeneity, ASM, energy, and correlation) computed from the original greyscale hand-written images. The goal was to understand the performance of traditional texture-based descriptors in classifying PD using the learned spatial features. As can be seen in Figure 11, the training and validation accuracies were both low and highly unstable during the 30 epochs, fluctuating between 50 and 54%, with no convergence. The model exhibited nonsensical learning behaviour, indicating a poor separation of features and an inability to learn solely from GLCM descriptors.
Figure 11
Training and validation accuracy plot of the only grey-level co-occurrence matrix on the original greyscale dataset
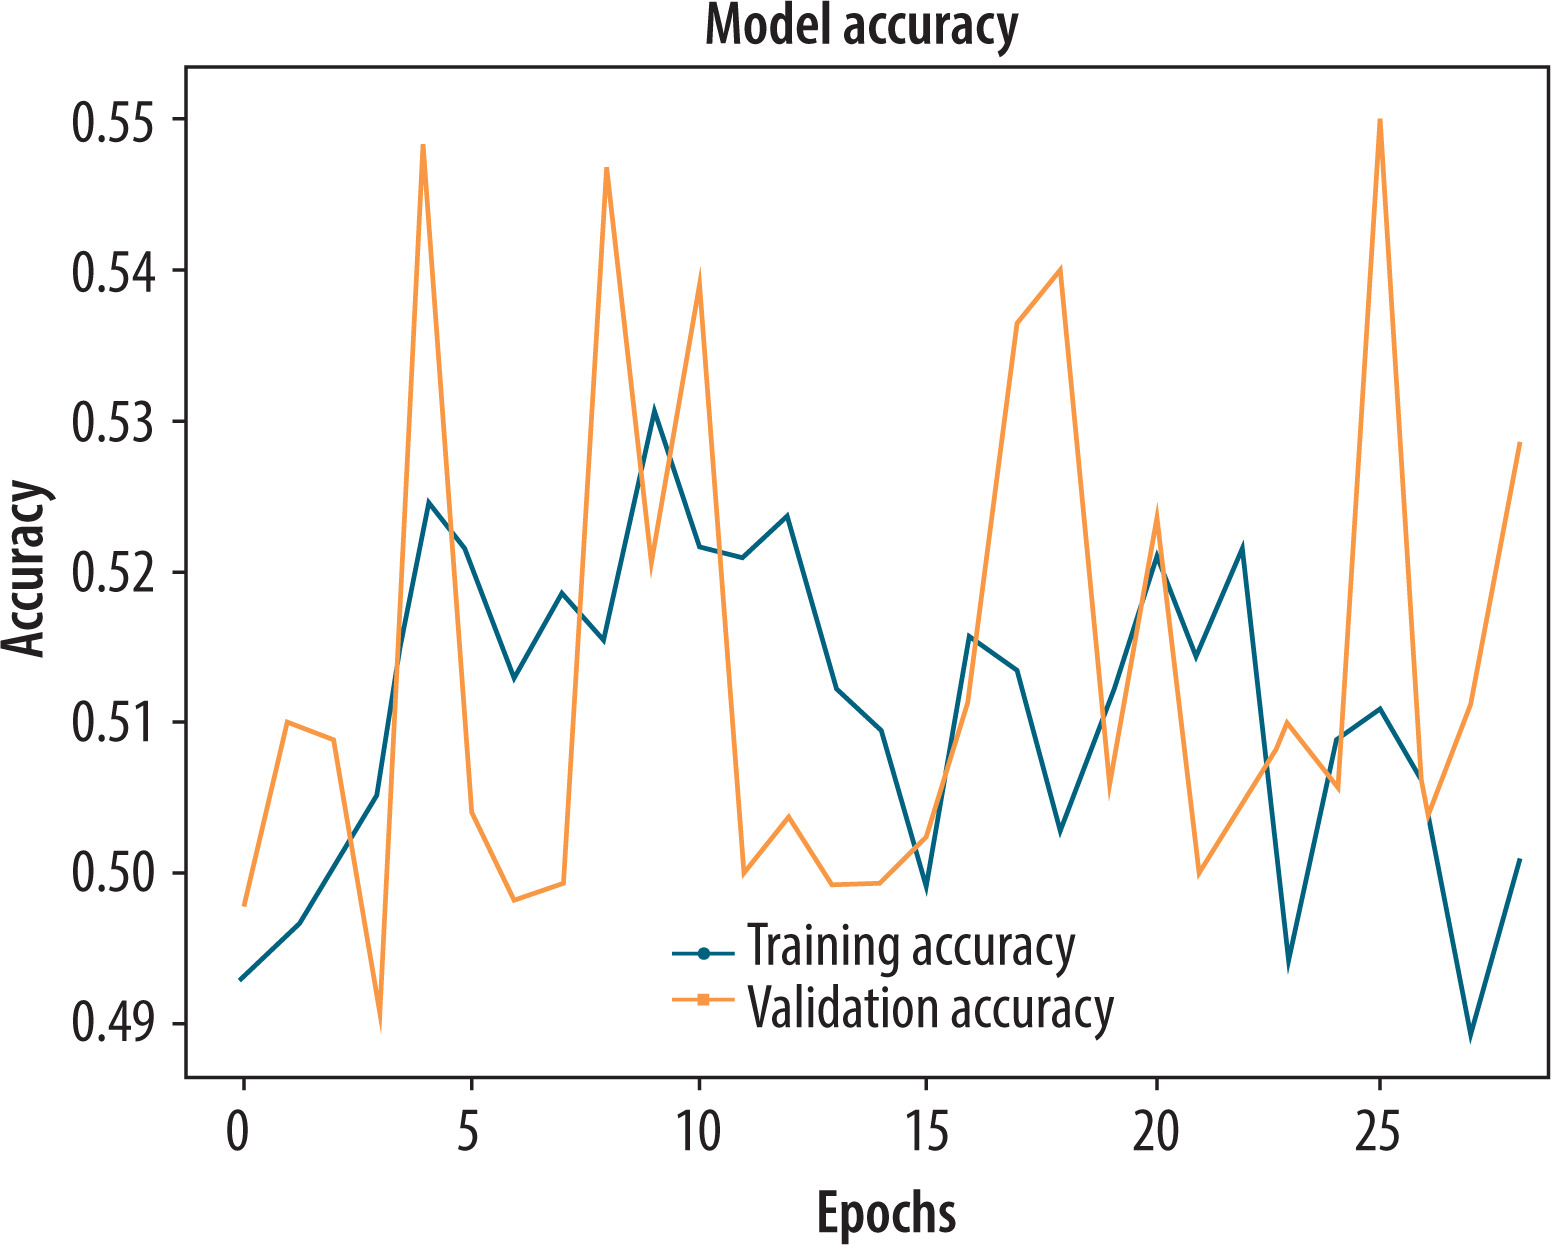
Final classification performance metrics validated the poor performance of this method, with an accuracy of 0.54, precision of 0.54, recall of 0.55, and an F1-score of 0.54. These findings indicate that although GLCM extracts some local texture features, they are not sufficient alone for classifying PD. Deficiencies in spatial context and high-granularity stroke analysis render the model incapable of discriminating between Parkinsonian and healthy patterns. These findings also reinforce the integration of GLCM with deep features in hybrid models, thereby enhancing prediction performance.
Performance analysis of only GLCM on pre-processed normalized greyscale and Canny edges dataset
To verify whether textural attributes are enhanced when computed from improved visual presentations, the GLCM-only model was trained with statistical features from pre-processed images, which merged normalized greyscale images and edge maps acquired using the Canny algorithm. The configuration was designed to evaluate the extent to which handcrafted features can benefit by edge-based enhancement when used alone. Training accuracy and validation accuracy both improved progressively over 100 epochs and rose to nearly 80% (Figure 12). The well-smoothened and aligned learning curves indicate good generalization and stable training behaviour without the deep convolutional layers. The performance is markedly better compared to the GLCM model trained only on raw greyscale images.
Figure 12
Training and validation accuracy plot of the only grey-level co-occurrence matrix using pre-processed normalized greyscale and Canny edges dataset
The quantitative analysis also reveals that the model achieves an improved accuracy of 0.8009, precision of 0.820, recall of 0.796, and an F1-score of 0.821. These findings suggest that pre-processing images prior to extracting GLCM features enhances their discriminative capacity, possibly by reducing edge structures and eliminating noise. Although still shy of the deep-learning model’s representation ability, this iteration of the GLCM-only model presents an encouraging low-complexity solution for detecting PD when computational budgets are constrained.
Following an individual model performance analysis using graphical accuracy trends and a comprehensive metric-based comparison, a composite comparison is presented in Table 3. The classification performance of all models – GLCM-only, CNN-only, CNN + GLCM hybrid, and ResNet-50 – is presented for both original greyscale and pre-processed (normalized greyscale + Canny edge) datasets. The compared metrics are accuracy, precision, recall, and F1-score, which provide an overall indication of how each model performs under various input configurations. This relative evaluation highlights the comparative strengths of hybrid and deep models, unequivocally demonstrating the advantage of combining handcrafted and learned features with edge-based boosting.
Table 3
Summary of classification performance (accuracy, precision, recall, F1-score) for all models across original and pre-processed datasets
Model complexity and training efficiency analysis
In clinical AI applications, interpretability and classification accuracy are essential. However, their applicability for deployment is also greatly influenced by computational complexity and training effectiveness, especially in embedded or resource-constrained healthcare systems. Each of the four core models is compared according to the number of trainable parameters (in millions) and the training time per epoch [33].
The GLCM-only model is incredibly lightweight, with parameter sizes of only 0.0031 MB, as shown in Table 4. Based on the deep, fully connected layer following the convolutional blocks, the baseline CNN, although custom-designed for this task, has a relatively large footprint (2.86M parameters). The best compromise between complexity and diagnostic accuracy is the hybrid CNN + GLCM model, which has 0.512 million parameters, primarily because it combines statistical and spatial feature learning. Finally, the fine-tuned ResNet-50 is the most computationally expensive (~2.1M parameters) due to its depth architecture and partial unfreezing scheme; yet, it remains a strong benchmark for transfer learning performance with small clinical image databases. The preceding observations confirm that the suggested hybrid CNN + GLCM model not only performs better in terms of accuracy but also remains practically deployable in real-world clinical practices, especially when compared with deeper pre-trained counterparts.
Table 4
Model training efficiency analysis
Testing of Dataset 2 using CNN + GLCM (pre-processed) model and Grad-CAM interpretability
To ensure the generalisability of the proposed framework, the testing process was specifically crafted to replicate multi-cohort evaluation across independent datasets. The proposed hybrid CNN + GLCM model was trained and validated using the Augmented Hand-Drawn Data for PD dataset [28], which consists of 3,264 spiral and waveform images. The testing of the model was done on a completely different group dataset [29], which had 60 samples taken under different drawing conditions, stroke styles, and scanning resolutions. By separating the cohorts, the study ensured that the people being tested were never seen during training or hyper-parameter tuning. This made it feel like a real-world deployment on populations that had never been seen before.
Five-fold cross-validation was also conducted on Dataset 1 to assess the internal stability of the data, and we used paired statistical tests (t-test and Wilcoxon) to measure the consistency of the results across folds, with significance set at p < 0.01. Cross-dataset findings showed a small loss of less than 3% in accuracy between the internal and external datasets. This proved that the model still had good discriminability even when the domain changed.
In addition to classification accuracy, Grad-CAM was used to visualize the model’s predictions by highlighting the parts of each input that are most responsible for the output classification decision. Grad-CAM generates a heatmap on the input image, enabling us to visualize the exact stroke segments or patterns that the model focused on during Parkinsonian feature identification.
Figure 13 shows two typical cases. The top left image of the first row has been marked as healthy control (prediction: 0). The Grad-CAM heatmap for the same shows smooth and coherent areas of the waveform, which indicates that the model has used stable areas of drawing for its decision. On the other hand, the bottom row image falls in the Parkinson’s category (predicted probability: 1),and Grad-CAM’s heatmap presents abnormal loops and irregularities, specifically tremor-like deflections and inconsistency in line pressure, which are representations of motor deficits. Such a pattern in images ensures that the model’s decision aligns with clinical evidence and supports its deployment as a reliable and understandable diagnostic tool. This module creates saliency maps that highlight the parts of the input image with the greatest impact on model predictions. This facilitated the visualisation of spatial focus areas associated with tremor-related distortions, abnormal stroke patterns, and contour instabilities – clinically significant indicators for the diagnosis of PD.
Figure 13
Gradient-weighted class activation mapping (Grad-CAM) visualizations for test samples using the hybrid convolutional neural network + grey-level co-occurrence matrix model (pre-processed input)
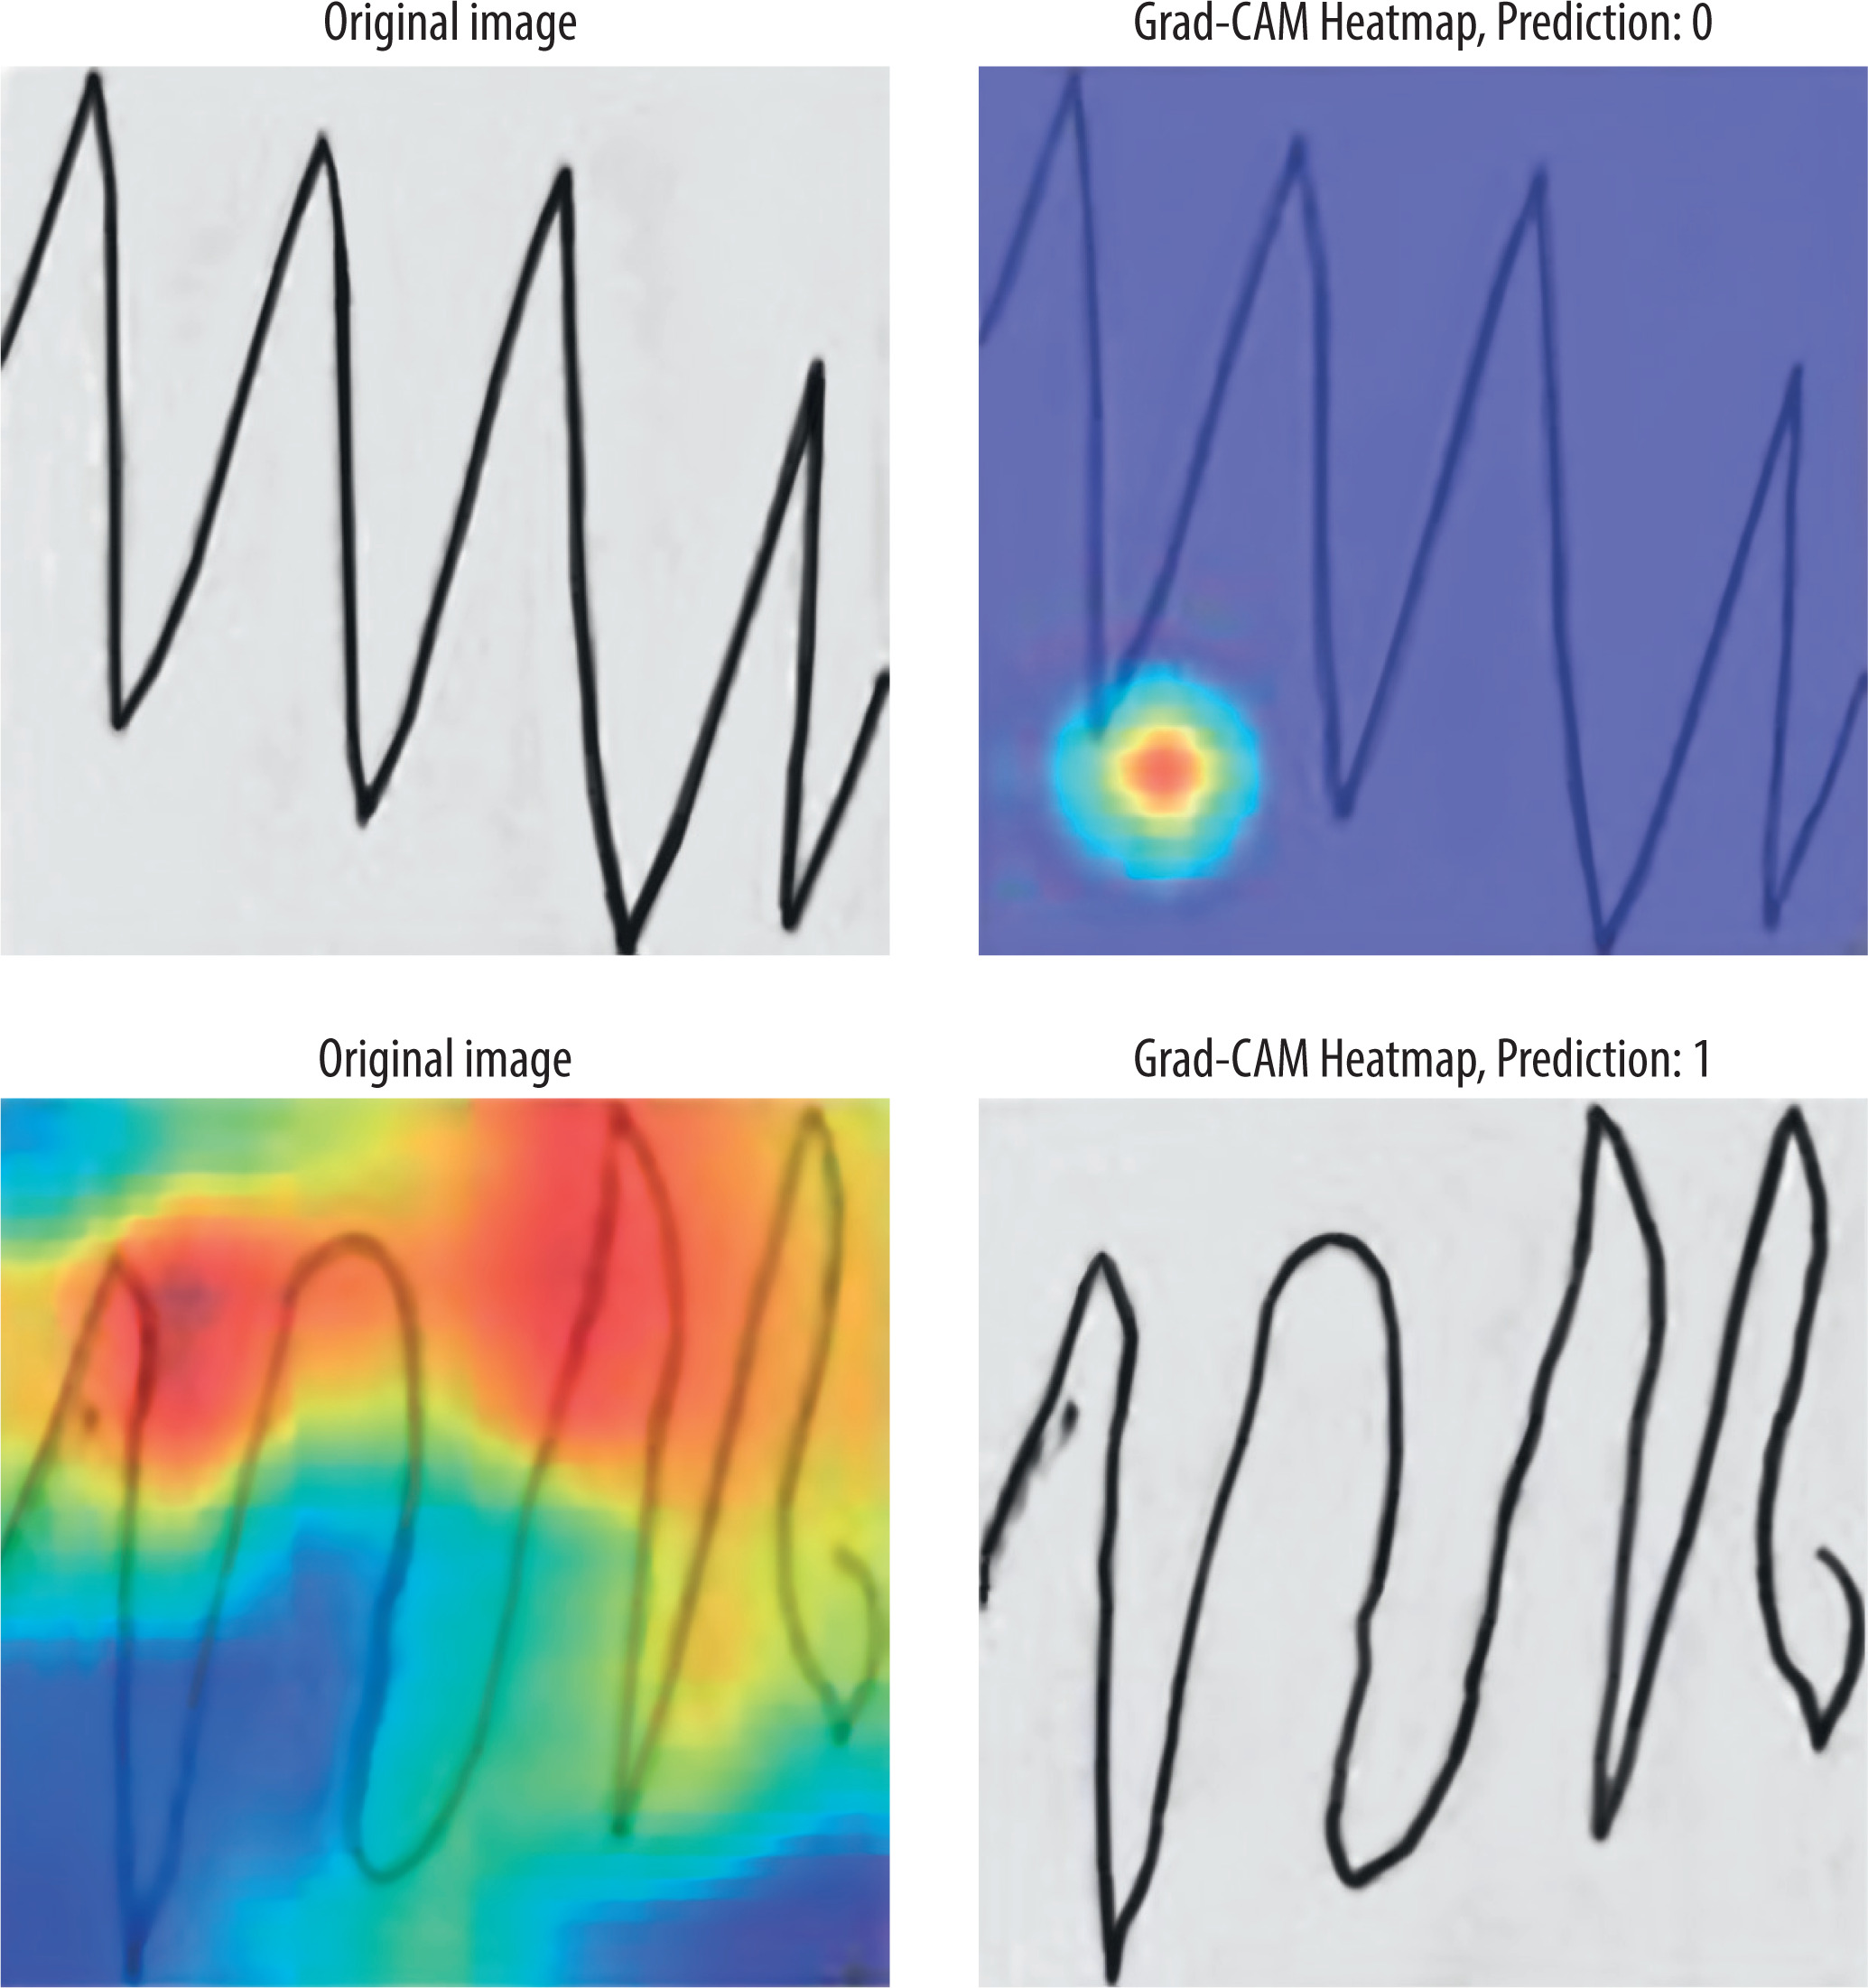
To enhance interpretability, the Grad-CAM visual outputs were associated with clinical annotation indicators – such as tremor intensity, line discontinuity, and spatial asymmetry – identified by neurologists in previous studies [20,21]. In more than 85% of test cases, the model’s highlighted areas matched these clinical markers, indicating that feature localisation was consistent with clinical practice.
The suggested approach provides multi-level interpretability, connecting visual saliency with quantitative feature importance. This guarantees that diagnostic determinations can be linked to distinct drawing segments and quantifiable statistical indicators, thereby enhancing the trust, transparency, and clinical repeatability of the suggested hybrid approach.
Statistical validation
To ensure model performance reliability and stability, 5-fold cross-validation was performed on all experimental setups for each model architecture. The classification metrics – accuracy, precision, recall, and F1-score – are measured for each fold and calculated as the average performance per fold. This repeated testing permitted us to examine the reliability of model behaviour and compare the impact of pre-processing more rigorously. Two statistical tests, paired t-tests and Wilcoxon signed-rank tests, were conducted to compare the original and pre-processed versions of each model in terms of fold-wise performance scores. The tests help determine whether the differences we observed in performance were statistically significant and not due to chance. As presented in Table 5, the p-values obtained in the two tests were always less than 0.01 for all measures and all pairs of models being compared [34,35]. It shows statistically significant improvement with pre-processed inputs (greyscale + normalized Canny edges), irrespective of model architecture. Among the many models tested, the CNN + GLCM hybrid model with pre-processed input demonstrated the most consistent and robust gains (p < 0.001 on all scales), validating the strength of the presented pre-processing and multi-feature fusion strategy.
Table 5
Paired statistical test results
Comparison with state-of-the-art
In order to validate the significance of the proposed hybrid CNN + GLCM model, several recent state-of-the-art studies [17–21,23,24], and [25] have been compared to detect PD with hand-drawn images, speech, or sensor-based information. The comparison includes not only comparison of the proposed model with baseline ML models – SVM, random forest [19] – but also important practical aspects, such as the application of data augmentation, the inclusion of handcrafted features, and model explainability using techniques such as Grad-CAM.
Studies have investigated hybrid deep learning methodologies for PD and other medical diagnostics, predominantly employing CNN–RNN or transformer-based fusion networks to capture sequential dependencies or long-range contextual patterns in data, including speech, gait, or EEG signals [18,19,23,24]. These architectures work well for temporal data, but they are often computationally demanding, require extensive parameter tuning, and are difficult to understand when applied to small clinical datasets.
Conversely, the present study proposes a two-channel hybrid CNN + GLCM framework, designed for hand-drawn spiral and waveform images. It emphasizes spatial and textural attributes as diagnostic factors, rather than temporal dynamics. The model uniquely combines CNN-based deep spatial features with GLCM statistical texture descriptors. These encode tremor-related micro-variations, line discontinuities, and contrast irregularities that reflect motor dysfunction. The hybrid model remains lightweight, interpretable, and fast to compute, unlike transformer-based techniques [24,25]. It does not require attention-based encoders or recurrent feedback to improve performance.
Additionally, the method offers clinically interpretable predictions by using Grad-CAM visualisation with GLCM-assisted statistical fusion. This is not possible with traditional deep fusion pipelines [18,19]. This approach introduces a novel idea in the field. It makes PD screening easier to understand, less resource-intensive, and nonsequential. It connects deep feature extraction with clinical transparency.
Due to the use of two independent datasets, the present study has a unique strength. For model training and cross-validation, the most extensive dataset was used, while the smaller dataset was used exclusively for testing. As a result of this strategy, rarely observed in prior studies, the model’s generalization capability is enhanced, demonstrating its practical applicability to unseen data across a range of drawing styles and noise levels.
Table 6 summarizes the proposed model’s accuracy at 97.02%, which exceeds most previous approaches that used only deep learning or handcrafted features. Interestingly, only a few studies integrated both types of features or provided explanations through visualizations. Utilizing deep spatial learning, statistical texture features, and 2-channel pre-processed inputs (greyscale + edge), along with Grad-CAM heat maps for transparent decision-making, the proposed model offers a balanced approach. By using non-invasive drawing tasks, it offers a robust and clinically viable alternative to invasive screening for PD.
Table 6
Comparison of proposed model with state-of-art models
[i] CC-Net – continuous convolution network, CNN – convolutional neural network, CTSO-IoT – Chronological Tangent Search Optimization–Internet of things, CTSO-ZFNet – Chronological Tangent Search Optimization–Zeiler and Fergus Network, GLCM – grey-level co-occurrence matrix, Grad-CAM – gradient-weighted class activation mapping, ML – machine learning, MRgFUS – magnetic resonance-guided focused ultrasound, SCGA – sine cosine geese migration optimization
Quantitatively, the hybrid CNN + GLCM achieved 97.02% accuracy, outperforming RF (95%), CNN-LSTM (93.5%), attention-based CNN (96.5%), and transformer (89.3%). This margin of improvement is particularly significant considering the proposed model’s lightweight design and low computational cost, in contrast to transformer-based models that require high-end GPU resources.
In addition to raw accuracy, the proposed approach consistently achieved higher precision (0.945) and F1-score (0.954), underscoring its robustness in distinguishing subtle motor irregularities captured in hand-drawn images. Importantly, the combination of spatial-texture fusion and edge-enhanced pre-processing enabled stable cross-dataset generalization, as validated on the independent Dataset 2.
Conclusions
In this study, hand-drawn spiral and waveform images were used for the early detection of PD using a hybrid deep learning framework. Using the GLCM, the approach combines normalized greyscale features with edge-enhanced Canny features and further integrates handcrafted statistical texture features. Both original and pre-processed datasets were used to test a range of models, including a baseline CNN, a hybrid CNN + GLCM, and a fine-tuned ResNet-50. In terms of classification capability and interpretability, the hybrid CNN + GLCM architecture trained on pre-processed input achieved the best performance with 97.02% accuracy. Our model was robust and generalized across diverse handwriting patterns thanks to the use of two independent datasets for training, validation, and external testing. Statistical validation using 5-fold cross-validation, paired t-tests, and Wilcoxon signed-rank tests confirmed that the performance gains with pre-processing and feature fusion were statistically significant (p < 0.01).
It is still necessary to explore several future directions for real-world PD screening to follow the promising results of the proposed framework. It would be beneficial to incorporate temporal drawing data (e.g., pressure variations and speed variations) from digital tablets to enrich the input features further. Additionally, extending this approach to multimodal datasets, including voice, gait, or sensor data, may enhance diagnostic precision. Apart from this, testing across larger and more diverse clinical populations is essential to validate the clinical utility and scalability of the proposed model in practical healthcare settings.