Introduction
Metabolic dysfunction-associated steatotic liver disease (MASLD) has become one of the most frequently discussed liver pathologies in recent years. In 2024, the issue of MASLD was raised at most major radiology conferences, such as the European Congress of Radiology (ECR) 2024 and the European Society of Gastrointestinal and Abdominal Radiology (ESGAR) 35th Annual Meeting and Postgraduate Course, where leading specialists presented the available diagnostic possibilities and encouraged participation in the fight against this growing problem.
It is estimated that MASLD, as a chronic disease, may affect about 30% of the world’s population, with a noticeable increase in cases in recent years [1,2]. Simple steatosis, non-alcoholic steatohepatitis, advanced fibrosis, cirrhosis, liver failure, and hepatocellular cancer are among the liver disorders that fall under the umbrella of MASLD, which is defined by an excessive buildup of fat in the hepatocytes. Cardiovascular disease is the leading cause of death of patients with MASLD, but an increasing risk of death from liver-related causes has also been found [3]. Currently, it is the second most common indication for liver transplants in the United States [4]. MASLD also correlates with an elevated risk of type 2 diabetes [5]. Due to the possibility of reducing the risk of death in this group of patients through early diagnosis, lifestyle changes, and implementation of appropriate therapy, more research is focusing on the need to implement or modify diagnostic algorithms to include MASLD.
Imaging diagnostic methods play a key role in the diagnosis and monitoring of MASLD. Thanks to the possibility of using modern methods of quantitative assessment of fibrosis and, above all, liver steatosis, combined with ultrasonography’s wide availability and low cost, ultrasonography is becoming a valuable tool that complements magnetic resonance imaging [6]. So far, most researchers have focused on developments in the non-invasive assessment of fibrosis in adult patients using ultrasound elastography. Although it has been stated that the degree of liver fibrosis is primarily linked to the prognosis of patients with MASLD, new research has called into question this notion and highlighted the crucial role that hepatic fat content plays as a prognostic indicator [7]. Until now, the degree of liver fibrosis has been used to assess the severity of MASLD, without considering the possible influence of simple steatosis. However, research shown that lowering the amount of fat in the liver may alleviate hepatic fibrosis and that advanced steatotic liver disease may be associated with faster fibrogenesis, increasing the risk of disease development [8]. Currently, it is possible to quantitatively assess the liver in several modalities; however, due to the framework of this article we will focus only on ultrasonography, which is the basis of our work.
For several years, commercially available tools have been available for noninvasive testing of liver stiffness and thus fibrosis. The topic is discussed exceptionally clearly in the European Federation of Societies for Ultrasound in Medicine and Biology guidelines from 2017, which, despite their age, remain a valuable source of knowledge on the subject [9]. Some devices can assess the degree of liver steatosis simultaneously or at different stages of the abdominal ultrasound examination. This is extremely useful due to the wide inter- and intraobserver variability of the previously used visual grading of hepatic steatosis [10]. One of the best-established methods for the quantitative assessment of liver steatosis is the controlled attenuation parameter (CAP), which can be assessed using a Fibroscan device (Echosens, France). However, this method requires a separate device and does not involve visual ultrasound assessment in B-mode. The need for easy and cheap quantitative assessment of liver steatosis is currently so great that it has led to the development of new devices dedicated solely to the assessment of this parameter, which in theory could be operated by technicians without requiring the involvement of physicians [11,12].
Many ultrasound device manufacturers have proposed several approaches to the quantitative assessment of liver steatosis, based on parameters such as the attenuation co-efficient, the backscatter coefficient, and the speed of sound. Some manufacturers enable simultaneous analysis of several of the above parameters, including the creation of new parameters, such as the ultrasound fat fraction proposed by Samsung or the ultrasound-derived fat fraction proposed by Siemens. Several factors influence the precision of attenuation estimation, including variations in backscattering, fluctuations in sound speed, the location of focus, the presence of imaging artifacts, the resolution of imaging, and the signal-to-noise ratio. Thanks to the efforts of experts from the World Federation for Ultrasound in Medicine and Biology (WFUMB), in 2024 we received new guidance on liver fat quantification in ultrasound [13]. This paper discusses in detail all commercially available methods for assessing the degree of liver steatosis and provides detailed instructions for their use.
Due to the emergence of new guidelines, and inspired by experts, we decided to introduce liver attenuation assessment, and thus steatosis degree, into the standard abdominal ultrasound examination protocol in our centre. This article analyses the impact of implementing this decision.
The main objective of the study was to assess whether extending the standard abdominal ultrasound protocol with quantitative liver assessment would increase the number of detected liver steatosis cases. The secondary objectives were to compare groups with detected liver steatosis based on visual assessment in B-mode and on liver attenuation assessment and to assess the cut-off point value of the attenuation coefficient at which fatty liver disease is detectable in B-mode.
Material and methods
This study was a retrospective analysis of the impact of including attenuation assessment in the standard abdominal ultrasound protocol on the detection of liver steatosis. The local Ethics Committee – the Komisja Bioetyczna Śląskiego Uniwersytetu Medycznego w Katowicach – waived the requirement to obtain ethical approval for this study.
Two investigators experienced in performing abdominal ultrasound and elastography examinations with 10 and 4 years of experience, respectively, decided to include the assessment of liver attenuation in the standard abdominal ultrasound examination protocol in May 2024. This study analysed the impact of this decision over the 3-month period from May to July 2024. All examinations were performed in the Department of Diagnostic Imaging, Provincial Specialist Hospital No. 5 St. Barbara’s in Sosnowiec, Poland.
A Fujifilm Arietta 850 device (FUJIFILM Medical Co., Ltd., Tokyo, Japan) with a convex C251 (1.8-5.0 MHz) probe was used. Visual evaluation of the liver in B-mode was performed using the manufacturer’s standard abdominal preset. The point shear wave elastography method, with simultaneous evaluation of the attenuation coefficient (iATT) was used. All examinations were performed in accordance with the WFUMB’s Guidelines/Guidance on Liver Multiparametric Ultrasound. Part 1: Update to 2018 Guidelines on Liver Ultrasound Elastography – 2024 and Guidelines/Guidance on Liver Multiparametric Ultrasound. Part 2: Guidance on Liver Fat Quantification – 2024 [13,14].
The standard protocol for the acquisition of liver stiffness measurement must be followed in accordance with the guidelines when the attenuation coefficient is obtained in conjunction with the measurement of liver stiffness. Patients fasted for 4 h and rested in a sitting position for 10 min before the examination. Then they were placed in a supine position with the right forearm held behind the head and the arm in maximum abduction (180° from the resting position) to widen the intercostal space. Measurements were taken with an intercostal approach at the location with the best acoustical window without shadowing caused by the lung or ribs. The transducer was perpendicular to the liver capsule during the measurement. The measurements were made at a standard depth set by the vendor with the upper edge of the measurement box at least 2 cm below the liver capsule. Blood vessels, bile ducts, and masses were avoided. Measurements were made during a breath-hold while breathing at neutral. Every measurement was made using separate images that were all acquired at the same location. Five attenuation measurements of the right liver lobe were performed for each patient, and the median values and the interquartile range to median ratio (IQR/M) of the acquisitions were reported. An example set of final measurements is shown in Figure 1.
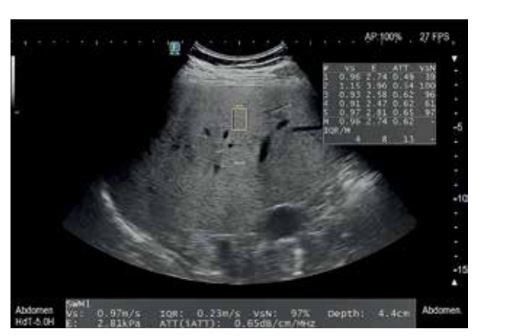
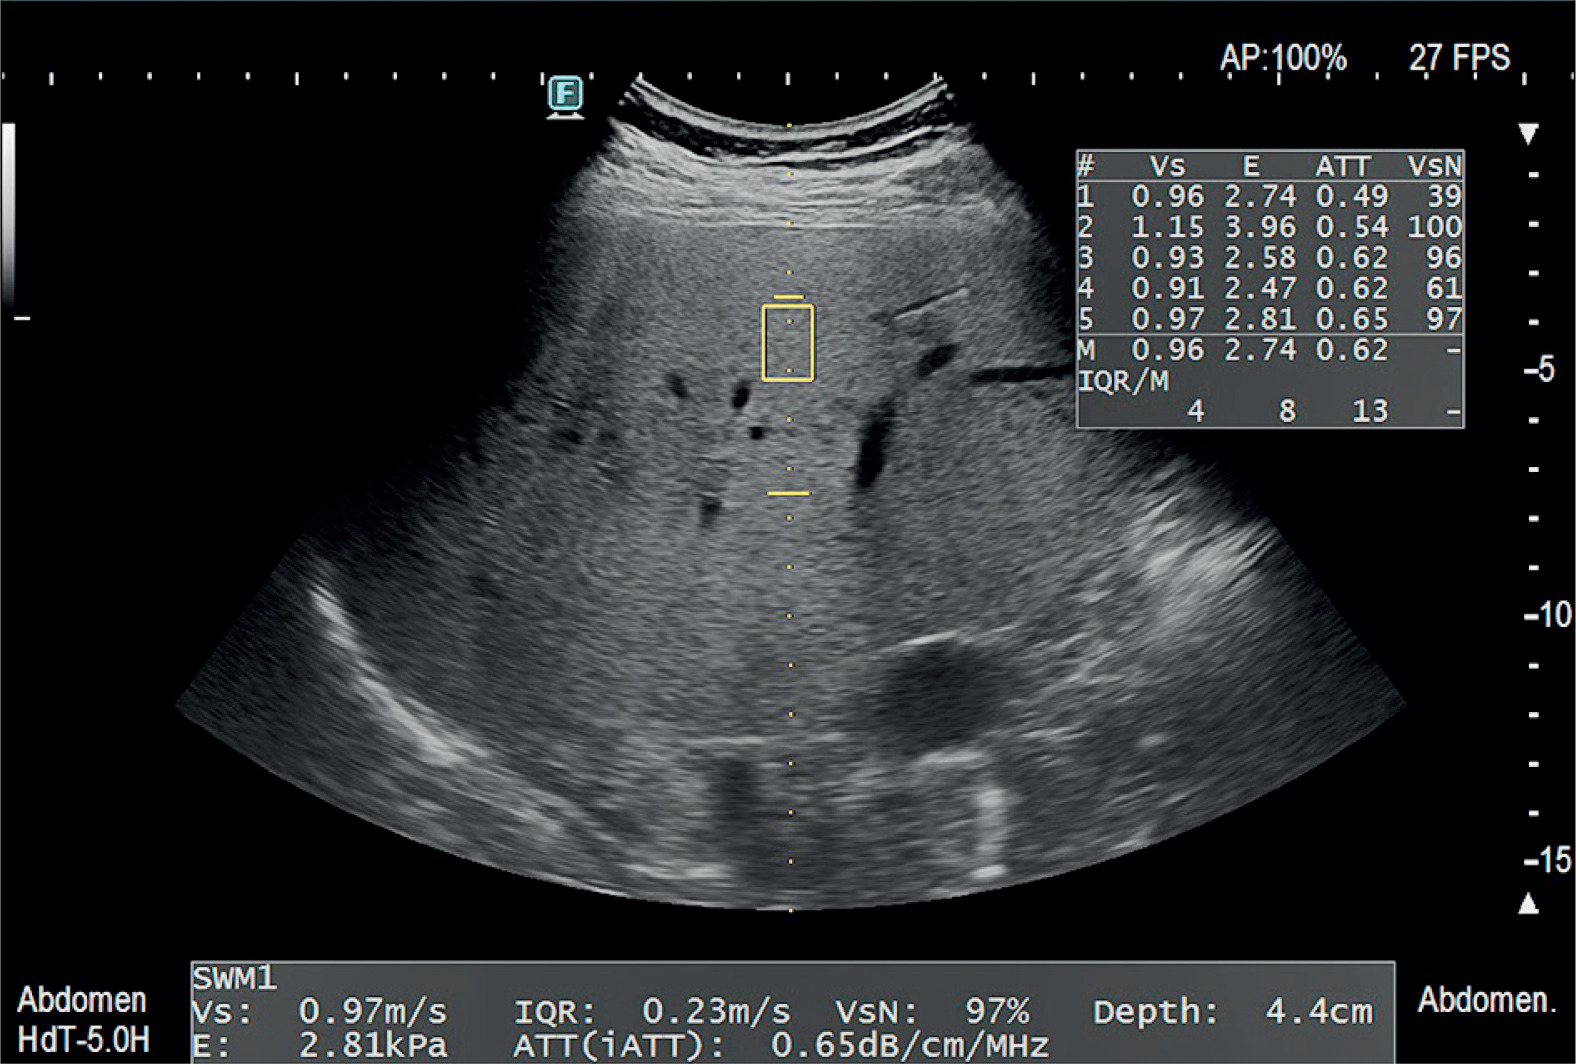
Figure 1
An example of an attenuation coefficient measurement using the iATT method with a Fujifilm Arietta 850 ultrasound
In August 2024, the obtained ultrasound results were collected and anonymised. Variables such as age, sex, liver size, median attenuation, and IQR/M were noted. Livers larger than 150 mm in the anteroposterior dimension were marked as enlarged. The adopted cut-off value of the quality indicator for attenuation measurement was an IQR/M < 15%. To assign degrees of steatosis based on the obtained attenuation values, the cut-off values provided by the manufacturer were used, based on the report by Koizumi et al. [15]. The cut-off values are presented in Table 1.
Table 1
ATT and iATT (dB/cm/MHz) attenuation measurement to estimate the extent of fatty liver using attenuation of propagated ultrasonic signal. ATT (or iATT) measured simultaneously with SWM
| Steatosis grades Cut-off | ATT* (iATT**) median (95% CI) dB/cm/MHz |
|---|---|
| S0 | 0.57 (0.54-0.60) |
| S > 1 | 0.58* (0.62**) |
| S1 | 0.63 (0.62-0.67) |
| S > 2 | 0.68* (0.67**) |
| S2 | 0.72 (0.56-0.76) |
| S > 3 | 0.72* (0.73**) |
| S3 | 0.87 (0.74-0.97) |
Independent assessment of liver hyperechogenicity compared to the kidney cortex visible in B-mode, as the earliest visible feature of liver steatosis, was performed after anonymising the patient data and blinding the investigators. In the single case of disagreement between the researchers regarding the assessment of liver hyperechogenicity, an independent blinded sonographer with 4 years of experience was asked to adjudicate. The stage of steatosis with Hamaguchi’s score was not assessed based on the B-mode images, due to the intention to assess only the presence or absence of steatosis features.
In the next step, a uniform control group was selected from abdominal ultrasound examinations performed by the same 2 researchers between February and April 2024. The control group was selected so as not to differ in terms of sex and age distribution from the study group. Referral data were not taken into account.
The data distribution was evaluated by assessing the collected values using descriptive statistics and a visual analysis of the charts. The normality of the distribution of variables was checked using the Kolmogorov-Smirnov, Lilliefors, and Shapiro-Wilk tests. To compare the collected results against the binary variables, Student’s t-test was used if the criteria were met, and the Mann-Whitney U test was used if they were not met. Differences in the distribution of numbers by sex between the groups were assessed using the Pearson χ2 test. A receiver operating characteristic (ROC) curve analysis was performed to assess what level of steatosis assessed by the attenuation method was visually detected by the researchers using the B-mode method.
Results
A total of 108 patients (65 females and 43 males) from the Silesia region of Poland were evaluated with an abdominal ultrasound protocol that included attenuation assessment. The average age of the study group was 64.31 ± 15.73 years. The detailed characteristics of the study and control groups are presented in Table 2.
Table 2
Characteristics of the study and control groups
Significantly more hepatic steatosis cases were diagnosed based on attenuation measurement compared to the diagnosis based on hyperechogenicity assessment in B-mode (p = 0.002).
Hyperechoic livers were significantly more often enlarged (p < 0.001), although this relationship was not seen for the attenuation-based evaluation of liver steatosis (p = 0.093).
We did not observe any significant difference in the occurrence of liver hyperechogenicity in relation to sex (p = 0.206). Similarly, no significantly higher incidence of steatosis based on attenuation was demonstrated in relation to sex (p = 0.136).
No significant difference was found in age between the sexes (p = 0.404) and between the patients with and without an enlarged liver (p = 0.862), those with hyperechoic and normoechoic liver observed in B-mode (p = 0.828), or between those with and without the presence of steatosis evaluated by the attenuation coefficient (p = 1.0).
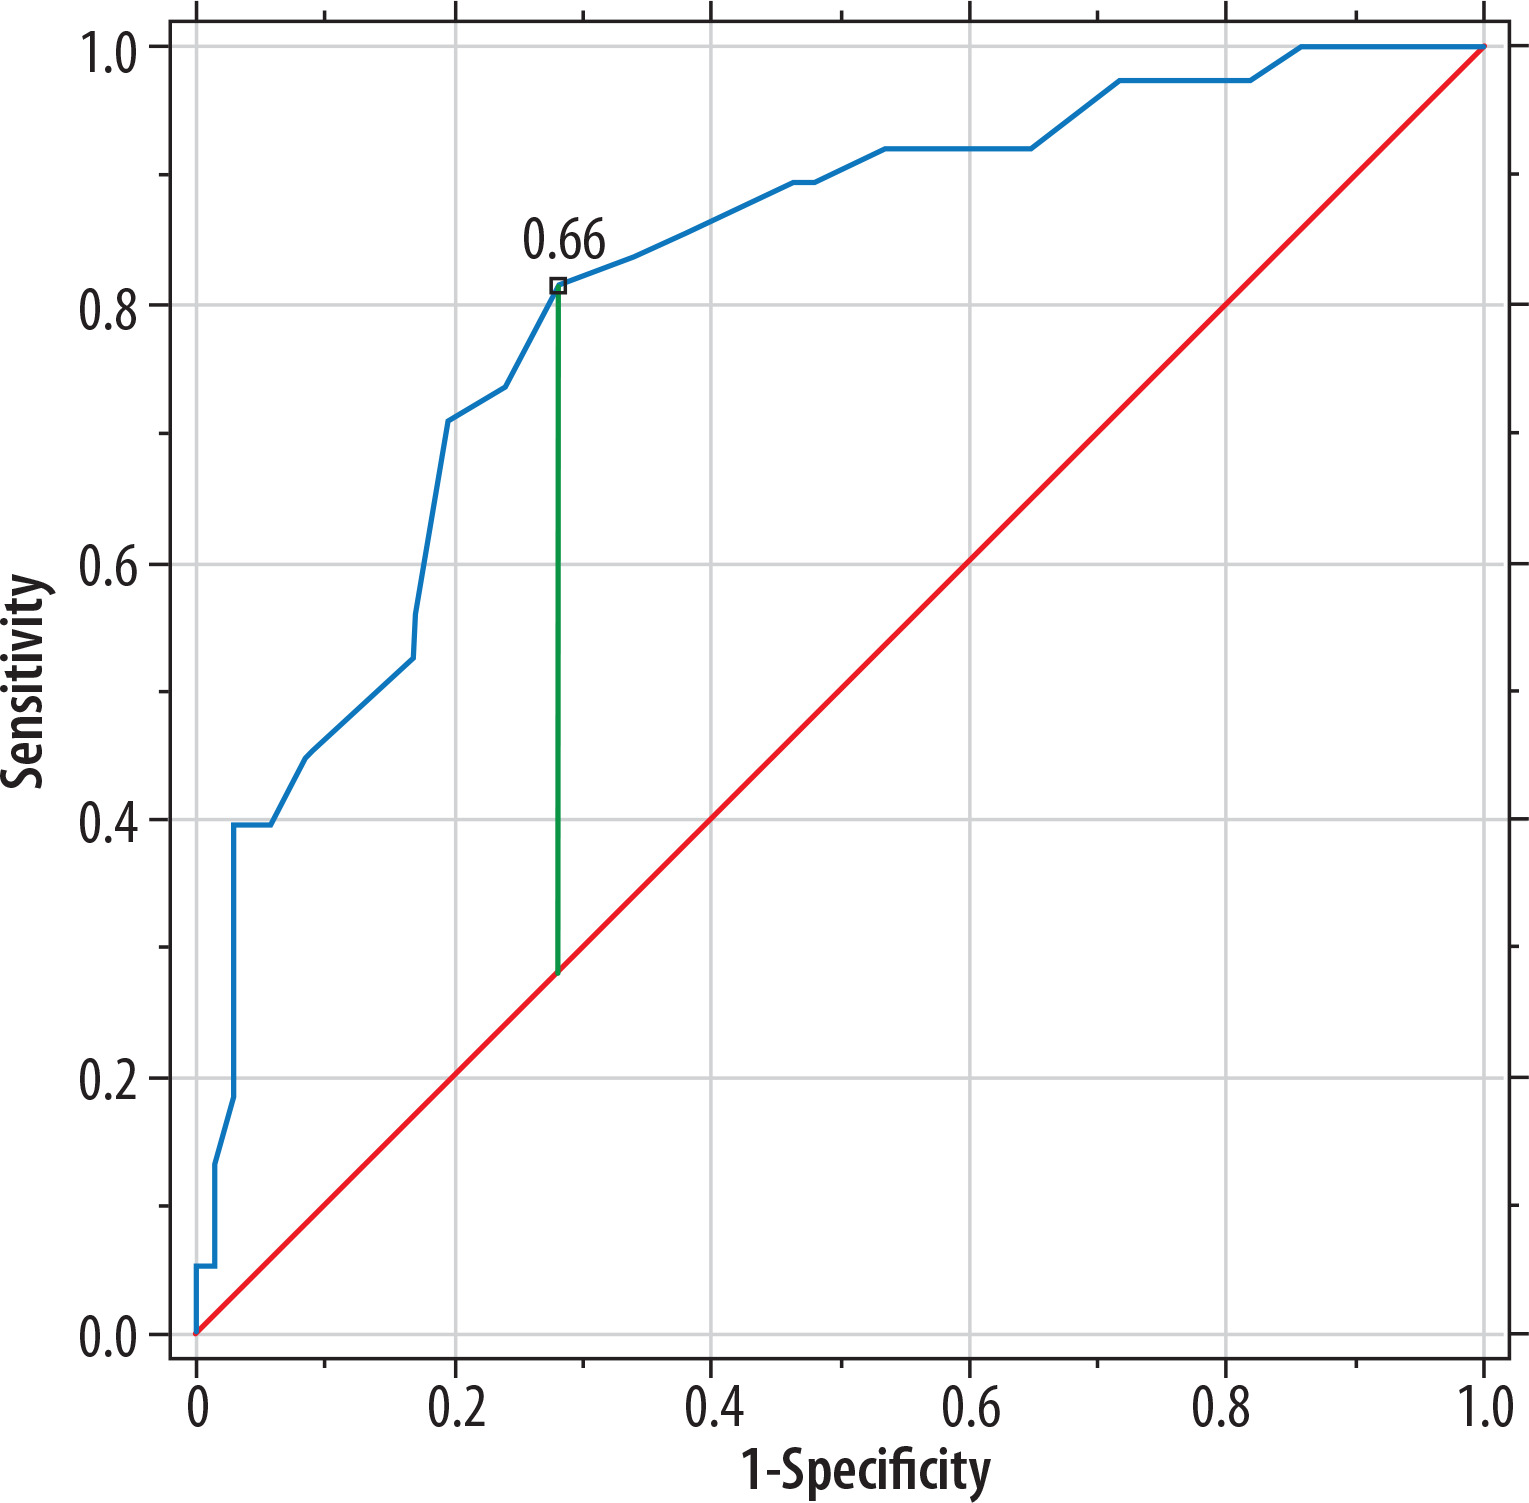
Using ROC curve analysis, an attempt was made to assess the cut-off point of the attenuation value at which the researchers detected liver hyperechogenicity. A cut-off value of 0.66 dB/cm/MHz with an area under the curve of 0.817 was obtained; the course of the curve is shown in Figure 2.
Discussion
Our results indicate that the quantitative assessment method based on the attenuation coefficient parameter allows for the detection of a larger number of patients with liver steatosis than qualitative assessment based on the B-mode. Recent reports, such as the work of Gbande et al. [16], show a good correlation between qualitative and quantitative assessment. Researchers have also verified the possibility of using multiparametric models based on a larger number of features visible in B-mode ultrasound examination of the liver, with good preliminary results [17]. However, the number of studies comparing qualitative and quantitative assessment in clinical practice in the context of the number of detected cases is relatively small. One current attempt to gather information on this topic is the critical literature review by Ezenwuba and Hynes [18] on the possibility of using qualitative and quantitative assessment methods in screening the paediatric population. In their opinion, quantitative ultrasound performs better than B-mode methods and demonstrates excellent performance; however, due to the number of studies and the problem of determining clear cut-off points for individual methods, further verification is needed before implementation in practice.
Given the many available methods for quantitative assessment of liver steatosis, the question arises as to which one to choose. Our work is based on the analysis of the attenuation coefficient; more precisely, the iATT method from Fujifilm. A recent work analysing the issue of choosing the optimal method is by Wang et al. [19], who compared the ultrasound-derived fat fraction, CAP, and hepatic/renal ratio in relation to magnetic resonance imaging proton density fat fraction as the gold standard. All the parameters analysed by these researchers were positively correlated with proton density fat fraction, and ultrasound-derived fat fraction exhibited the strongest correlation. Furthermore, ultrasound-derived fat fraction outperformed the CAP and the hepatic/renal ratio in the comparison of diagnostic efficacy among the different grades of hepatic steatosis. Unfortunately, iATT was not analysed in this work. At the time of writing this article, we found no work directly comparing the accuracy of iATT assessment with the ultrasound-derived fat fraction. However, Ferraioli et al. [20] demonstrated that results obtained using the ultrasound-derived fat fraction followed the same trend observed with iATT in terms of the repeatability (i.e. the precision) of the measurements, but no comparison of their accuracy was made. Although we do not have a reference for the accuracy of the iATT method used in our work compared to other ultrasound methods, we have confirmed its high compliance with the gold standard, which is magnetic resonance imaging-based proton density fat fraction. In a recent study, excellent repeatability and low fixed bias between iATT and MRI-PDFF were found, and it was determined that the only significant factor contributing to the disparity was a skin-to-capsula distance > 25 mm [21].
Current literature addresses the issues of diagnosis and treatment of MASLD, but despite being based on the same sources, subsequent authors present their own modified management schemes. A recently published paper by Kaylan Kerim and Sonali Paul provides an overview of the current guidelines [22]. They indicate the position of vibration-controlled transient elastography in the diagnosis and monitoring of MASLD, mainly as a complementary method to non-invasive serum tests. However, they claim that emerging data on shear wave elastography has not been well-validated, citing AASLD practice guidance on the clinical assessment and management of nonalcoholic fatty liver disease [5]. On the other hand, more recent EASL-EASD-EASO clinical practice guidelines on the management of metabolic dysfunction-associated steatotic liver disease indicate the validity of using various imaging methods as a noninvasive second-step evaluation method. Among the population screened with the fibrosis-4 index test, a complementary method may help in deciding on further treatment of patients with a result between 1.3 and 2.67, where vibration-controlled transient elastography, magnetic resonance elastography, shear wave elastography, and enhanced liver fibrosis are mentioned. One of the main reasons for using imaging techniques measuring mechanical properties and/or hepatic fat content is that their diagnostic accuracy is higher than standard liver enzyme testing [23].
Taking into account the wider range of available elastographic methods, the question arises about their selection and potential place in diagnostic and therapeutic procedures. The rapid development of available quantitative liver assessment tools causes problems with their broader validation and thus makes it difficult to reach a consensus on choosing the most beneficial one. The most established vibration-controlled transient elastography, commercially available in the form of the FibroScan device, seemed to lag behind new developments in ultrasound machines. However, it transpires that, due to its availability and ease of use, it can be used in several areas, such as universal screening or selected population screening. Its position also remains strong among guidelines, due to the number of scientific papers based on this method. According to a recent report by Elizabeth Williams and Raj Vuppalanchi, vibration-controlled transient elastography still plays pivotal roles in disease phenotyping risk prognostication and monitoring disease progression or treatment response [24]. However, it should be noted that emerging new devices like the Velacur (Sonic Incytes Medical Corp.) appear to be better than FibroScan for detecting liver fat, with similar outcomes for evaluating liver stiffness [25]. Consequently, it would appear logical to carry out more research comparing the greatest possible number of devices that are now on the market while utilising the gold standard MRI-PDFF as a reference.
MASLD or fibrosis screening has been shown to be cost-effective in the general population, including among those affected by type 2 diabetes, metabolic syndrome, and steatotic liver disease. Although this approach is not commonly used, there are indications that screening among patients with type 2 diabetes with abdominal ultrasonography followed by liver biopsy is not cost-effective. It may be difficult to extend cost-effectiveness findings to healthcare systems in European countries because most of the information was gathered in the US healthcare system [26-29].
The issue of interobserver agreement was not analysed in our study, but in view of the reports of excellent agreement in terms of interobserver reproducibility and the retrospective nature of our work, this direction did not seem worth pursuing [30]. In our study, we performed simultaneous measurements of liver stiffness and attenuation, but we did not analyse the relationship between these variables due to the proven lack of influence [31].
In the context of our work, it is worth noting that current guidelines state that avoiding the simultaneous acquisition of liver stiffness and fat measurement is preferred if a stand-alone attenuation coefficient setup is possible. Performing the measurements one after the other is better than doing them all at once [13]. Due to the equipment available in our setting, independent measurement of stiffness and attenuation was not possible, which potentially limits the value of our work.
We did not observe any significant differences in the features of liver steatosis observed in B-mode or in the attenuation coefficient in relation to age and sex, while such a relationship has been found in previous studies [32-34]. This difference may be the result of the relatively small range and older age of our study group.
We have proven that sonographers assess livers as hyperechoic from an attenuation level of 0.66 dB/cm/MHz. Effectively, this means that using only visual assessment in B-mode, we miss a significant number of patients with an S1 steatosis grade. We have not found any studies analysing this issue in the context of the iATT method. In this context, it is worth noting that the specific cut-off values for the attenuation coefficient have shown variation between different studies. This variability could be explained by discrepancies in the measuring procedure used in different studies, and by distinctions in the algorithms used by different manufacturers. It is also necessary to take into account the differences in the disease’s prevalence, inclusion criteria, and the characteristics of the cohorts under study [15,35]. The cut-off values in the quantitative fat assessment, provided by the manufacturer and implemented in our work, are based on the Japanese population. Liver fat content is dependent on both ethnicity and place of residence and related to genetic factors, lifestyle, and diet [36,37]. Unfortunately, at the time of writing this paper, there were no verified cut-off values of the attenuation coefficient for the Polish population.
One of the main limitations of our work is the lack of reference to the gold standard, which is currently the magnetic resonance imaging-based proton density fat fraction. In the future, we are considering undertaking a prospective analysis covering all patients who undergo abdominal MRI in our department with an assessment of the degree of liver steatosis both by MRI and complementary ultrasound with the attenuation coefficient measurement during the same visit.
Conclusions
Extending the standard abdominal ultrasound examination protocol with quantitative liver assessment increases the number of detected cases of liver steatosis. Relying solely on qualitative assessment of B-mode liver steatosis features results in missing a significant number of patients with an S1 steatosis grade. The inclusion of quantitative liver evaluation in everyday practice seems justified, despite current problems with selecting the optimal assessment method and the lack of population-specific cut-off values.