Introduction
Moyamoya disease (MMD) is a chronic, idiopathic, slowly progressive disease of cerebral vessels, wherein steno-occlusive changes occur in the terminal portion of at least one of the internal carotid arteries (ICAs) and its proximal branches with the formation of a characteristic abnormal network of vessels at the base of the brain, called moyamoya vessels [1,2]. Often MMD is associated with other conditions such as Down’s syndrome, sickle cell disease, neurofibromatosis-I, and cranial irradiation, which is referred to as moyamoya syndrome (MMS) or quasi-MMD [3]. MMD usually shows bimodal presentation, affecting children and adults, with the most common symptom overall being transient ischemic attacks or ischemic stroke [4-6].
Diverse modalities of imaging have been utilized for diagnosing MMD, with digital subtraction angiography (DSA) currently regarded as the gold standard for assessing and diagnosing MMD, despite its invasive nature. According to the 2021 Diagnostic Criteria of MMD, the diagnosis can be made based on the combined findings of magnetic resonance imaging (MRI) and magnetic resonance angiography (MRA) to detect steno-occlusive changes in the terminal segments of the bilateral/unilateral ICA, proximal anterior cerebral artery (ACA), and middle cerebral artery (MCA) [7].
Recently, a novel imaging technique has evolved for assessing vessel wall pathologies called vessel wall imaging (VWI). VWI using the black blood technique offers the advantage of producing high-resolution images with submillimeter voxel size and enables simultaneous visualization of both the vessel wall and its lumen [8,9]. The basic principle of VWI involves the suppression of cerebrospinal fluid around the vessels and blood within the vessel lumen for visualization of the vessel wall [10]. The novel technique of VWI has emerged as a valuable modality for distinguishing different intracranial vasculopathy based on distinct patterns of vessel wall thickening, remodeling, and vessel wall contrast enhancement (VWCE) [11].
A few of the recently conducted studies on the role of VWI in patients with MMD have revealed some interesting results. In a study conducted by Patzig et al. [12] in European patients, it was concluded that concentric VWCE was a common finding among European MMD patients; while a separate study on North American adult populations by Larson et al. [13] revealed that vessel wall enhancement and thickening were frequently observed in vascular proximal segments in patients with MMD.
The goal of this study was to precisely determine vessel wall changes such as vessel wall thickening and enhancement using high-resolution vessel wall imaging (HRVWI )in patients with MMD in a South East Asian cohort of patients and to compare the diagnostic effectiveness of time-of-flight (TOF) MRA and VWI in evaluating the extent of vascular involvement in patients diagnosed with MMD.
Material and methods
This observational study, approved by the institutional ethics committee, was conducted from January 2022 to June 2023. There was no patient follow-up. A total of 45 consecutive patients, either clinically suspected of MMD or with diagnosed MMD during follow-up, referred to our department for MRI evaluation, were scrutinized for inclusion and exclusion criteria and subsequently enrolled in our study. Our study encompassed patients of all age groups diagnosed with MMD according to the 2021 Revised Diagnostic Criteria, including cases of quasi-MMD or MMS, while excluding those who had previously undergone revascularization intervention, had a contrast allergy, or had contraindications for MRI.
Out of a total of 45 patients, two were excluded due to faulty acquisition or patient movements, and upon further assessment of imaging findings, three patients did not meet the diagnostic criteria for MMD (2021 revised version) and were therefore excluded. Consequently, the remaining 40 patients who met the diagnostic criteria on MRI and TOF MRA were included in our study. All cases underwent scanning using the 3T Philips Ingenia Koninklijke MRI System in Best, Netherlands; the 3T GE Discovery MR 750w in Norwalk, Connecticut, USA; and the 1.5 T Siemens Magnetom Aera System in Erlangen, Germany. Out of a total of 45 patients, only 3 patients underwent VWI on a 1.5 T MRI scanner; in the rest of the cases, images were acquired in a 3 T MRI scanner. High-resolution pre- and post-contrast VWI sequences (3D T1 FS) and TOF MRA were acquired in addition to the routine MRI sequences. The high-resolution 3D T1 black blood sequence used for magnetic resonance (MR) VWI varied by MRI vendor: CUBE for 3T GE, SPACE for 1.5T Siemens, and VISTA for 3T Philips. These sequences were optimized for HRVWI specific to each MRI system. The acquisition time for the VWI protocol was around 6-8 minutes, in addition to the time taken for routine MRI sequences. The contrast agent used forthe post-contrast VWI sequence was Dotarem (gadoterate meglumine), administered at a dosage of 0.1 mmol/kg body weight.
TOF MRA acquisition: The MRI protocols used for 3D TOF MRA were as follows:
on a 3 T Philips scanner: repetition time (TR) = 23 ms, echo time (TE) = 3.5 ms, flip angle = 18°, matrix = 500, field of view (FOV) = 200 mm, slice thickness = 1.3 mm, number of slices = 156;
on a 3 T GE scanner: TR = 32 ms, TE = 5.7 ms, flip angle = 20°, matrix = 384, FOV = 220 mm, slice thickness = 1 mm, number of slices = 20 per slab × 4 slabs;
on a 1.5 T Siemens scanner: TR = 32, TE = 7.15, flip angle = 19°, matrix = 256, FOV = 180 mm, slice thickness = 0.7 mm, number of slices = 44 per slab × 4 slabs.
VWI acquisition: The MRI protocols used for VWI (3D T1 FS) were as follows:
on a 3 T Philips scanner: TR = 400 ms, TE = 19 ms, flip angle = 90°, matrix = 240, FOV = 202 mm, slice thickness = 1 mm, number of slices = 200;
on a 3 T GE scanner: TR = 650 ms, TE = 13 ms, flip angle = 90°, matrix = 256, FOV = 220 mm, slice thickness = 0.7 mm, number of slices = 176;
on a 1.5 T Siemens scanner: TR = 600 ms, TE = 7.2 ms, flip angle = 90°, matrix = 256, FOV= 250 mm, slice thickness = 1 mm, number of slices = 192.
Image analysis
All of the enrolled patients underwent routine MRI brain sequences which included T1, T2, fluid-attenuated inversion recovery, susceptibility-weighted imaging, and diffusion-weighted imaging (DWI) and assessed for laterality of brain hemisphere involvement, presence of parenchymal changes in the form of infarcts/hemorrhage, territorial distribution of infarcts/hemorrhage, and lobar distribution of infarcts. Infarcts were further categorized into acute and chronic subtypes based on the presence or absence of high signal intensity on DWI. Acute infarcts displayed high signal intensity on DWI, while chronic infarcts typically showed low signal intensity on DWI along with gliosis and volume loss in the affected brain parenchyma.
We evaluated 11 vascular segments in each patient on TOF MRA and VWI. The vessels assessed in bilateral cerebral hemispheres were supraclinoid ICA (right and left), ICA terminus (right and left), M1 segment of MCA (right and left), A1 segment of ACA (right and left), P1 segment of posterior cerebral arteries (right and left) and distal half of basilar artery. The standard criteria used for assessment of each steno-occlusive lesion was derived from the scoring scheme with 3 grades provided by Yamada et al. [14,15] as follows: “Normal”: no abnormalities observed in the lumen of the vascular segment; “Stenotic” indicated a focal narrowing of the lumen, suggesting a partial blockage or constriction in that segment; “Occluded” indicated the absence or discontinuity of the lumen, demonstrating a complete blockage or closure of the vascular segment. Accordingly, each of the 11 vascular segments was categorized as normal, stenotic, or occluded based on the extent of the vascular lumen blockage. Since DSA was not conducted for our study subjects, the grading of severity of MMD for each cerebral hemisphere was performed using the TOF MRA grading developed by Houkin et al. [16].
The collaterals were also categorized into “none,” “mild,” or “marked” according to grading provided by Yamada et al. [15]. “None” indicated the absence of collaterals, “mild” indicated the presence of a small vascular network localized in the basal ganglia, with the medullary arteries not being depicted or visible, and “marked” indicated the presence of a large vascular network that extended above the basal ganglia, and the medullary arteries were depicted and visible.
The assessment of VWI findings was carried out by two experienced radiologists (SV and SD, with 14 years and 5 years of experience, respectively). Each of the 11 vascular segments was evaluated on multiplanar images on pre- and post-contrast VWI sequences and was carefully examined to determine the presence of vessel wall thickening, vessel wall enhancement, and their pattern. The pattern of vessel wall thickening was categorized into concentric, eccentric, or no wall thickening [17]. Concentric wall thickening referred to a uniform increase in vessel wall thickness that extended circumferentially around the vessel, and the width of the thinnest segment was > 50% of the width of the thickest segment. On the other hand, eccentric wall thickening described a non-uniform distribution of vessel wall thickening, and the thinnest segment of the vessel wall was less than 50% of the thickest segment. The enhancement of the involved vessel wall segment was graded into 3 categories as follows: Grade 0: no detectable enhancement of the vessel wall on post-contrast T1 images; Grade 1: mild enhancement. The signal intensity of the enhanced vessel wall is lower than that of the pituitary infundibulum; Grade 2: strong enhancement. The signal intensity of the contrast-enhanced vessel wall is either similar to or greater than that of the pituitary infundibulum [17,18].
Statistical analysis
Interobserver agreement regarding individual arterial enhancement on VWI was assessed through the application of Cohen’s κ statistics. In cases of conflicting results, both observers re-evaluated them, and a final consensus was reached. The steno-occlusive changes in the vascular segments on TOF MRA were correlated with the grade of VWCE, and statistical analysis was performed using the χ2 test or Fisher’s exact test. Comparative analysis was performed between the total number of abnormal vascular segments on TOF MRA and the total number of abnormal vascular segments on VWI. The information was entered into a Microsoft Excel spreadsheet, and the analysis was conducted using IBM SPSS Statistics, version 26.0. Statistical significance was determined by a two-tailed p-value of less than 0.05 and a 95% confidence interval.
Results
Demographic and clinical data are shown in Table 1. All cases of idiopathic MMD and quasi-MMD were assessed for the presence of parenchymal findings, i.e., infarcts and hemorrhage. A total of 39 patients (97.5%) were found to have infarcts, while only one patient (2.5%) had intracerebral hemorrhage. Table 2 provides concise information regarding parenchymal imaging findings, laterality of cerebral hemisphere involvement, territorial distribution of infarcts, and the types of infarcts in the enrolled study subjects.
Table 1
Demographic and clinical data (N = 40)
Table 2
Neuroimaging findings
TOF MRA findings
A total of 11 vascular segments were evaluated on TOF MRA in each patient to determine the presence of steno-occlusive changes according to the grades provided by Yamada et al. [15]. The overall number of vascular segments assessed across the study population was calculated as 40 × 11, resulting in a total of 440 segments. Out of these segments, 304 (69.1%) vascular segments exhibited steno-occlusive lesions, with 171 (38.8%) categorized as stenotic and 133 (30.2%) classified as occluded, as shown in Table 3.
Table 3
Time-of-flight magnetic resonance angiography (MRA) and vessel wall imaging (VWI) findings
The total number of steno-occlusive segments on TOF MRA ranged from 3 to 11. Unilateral vascular segment involvement was observed in 5 patients (12.5%) and bilateral vascular segment involvement on TOF MRA was observed in 35 patients (87.5%). The severity of MMD in each cerebral hemisphere was assessed on the basis of TOF MRA grading provided by Houkin et al. [16], being graded as 0 to 4, as shown in Table 4. This grading system correlates well with Suzuki and Takaku’s angiographic staging [1]. As our study did not involve the use of invasive DSA, the severity of vascular involvement was determined based on TOF MRA findings and categorized into grades 0 to 4. Our results showed that the majority of patients exhibited grade 2 (35%) and grade 3 (35%) severity on the right side of the cerebral hemisphere. On the left side, grade 2 severity was more prevalent, observed in 45% of the subjects.
Table 4
. Houkin et al. [16] time-of-flight magnetic resonance angiography (MRA) grading of severity of moyamoya syndrome in each cerebral hemisphere
VWI findings
Vessel wall thickening and enhancement were found in 97.5% of cases. All of the involved vascular segments showed smooth concentric enhancement, with a maximum number of cases (77.5%) showing grade 1 overall VWCE and 20% of the cases showing grade 2 overall VWCE. We found a significant correlation between the grade of vessel wall enhancement and TOF MRA findings (p < 0.0001), with 74.4% of stenotic and 72.2% of the occluded vascular segments showing grade 1 VWCE. The VWCE was more prevalent in stenotic arteries as compared to occluded arterial segments.
VWI vs TOF MRA (Figures 1-4)
The total vascular segments were labeled as ‘normal’ and ‘abnormal’ on TOF MRA and VWI, respectively. These normal and abnormal vascular segments were further assessed based on the presence or absence of vessel wall findings, namely vessel wall thickening and contrast enhancement. Vascular segments that showed a normal lumen and no vessel wall thickening or contrast enhancement were labeled as ‘normal’ on VWI. All other vascular segments with an abnormal lumen (either stenotic or occluded) and showing vessel wall thickening and contrast enhancement were categorized as ‘abnormal’ on VWI. A comparison was made between the total number of normal and abnormal vascular segments on TOF MRA and VWI (Table 3). VWI demonstrated the involvement of a greater number of vascular segments compared to TOF MRA, as shown in bar chart 1. The total number of abnormal vascular segments detected on TOF MRA was 304 (69.09%), while VWI detected a total of 358 (81.3%) abnormal vascular segments (Table 3). An average of 3 additional abnormal vascular segments in the anterior circulation and 9.33 abnormal vascular segments in the posterior circulation were detected using VWI compared to TOF MRA.
Figure 1
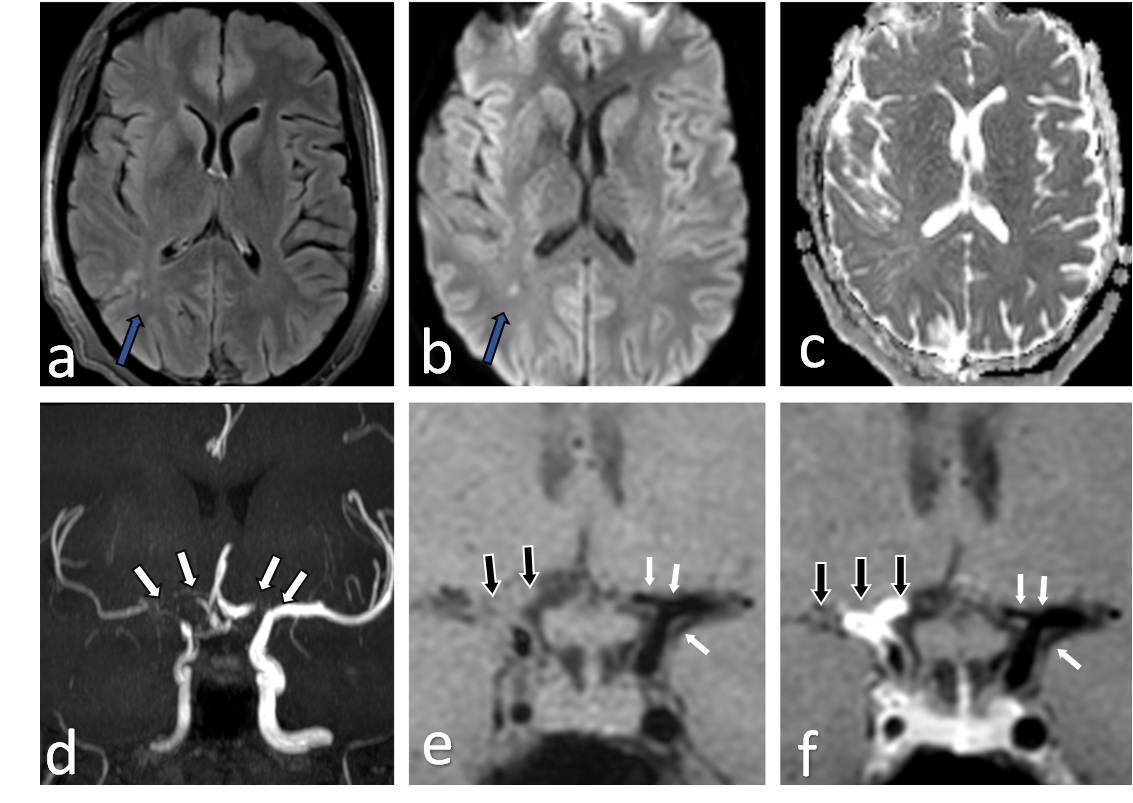
Fourty one-year-old female presenting with young stroke. Axial fluid-attenuated inversion recovery (FLAIR) (A), axial diffusion-weighted imaging (B) and axial view apparent diffusion coefficient map (C) image showing few foci of non-diffusion restricting FLAIR hyperintense signal intensity in right parieto-temporal lobe (white arrows in A and B). Coronal anterior maximum intensity projection time-of-flight magnetic resonance angiography (MRA) image (D) shows stenotic right supraclinoid internal carotid artery (ICA), right middle cerebral artery (MCA) with occluded right terminus ICA and right anterior cerebral artery (ACA) and also stenotic left terminus ICA (white arrows in D). Coronal pre-contrast vessel wall imaging (VWI) (E) and coronal post contrast VWI (F) showing vessel wall thickening (black arrows in E) and grade 2 concentric enhancement of right supraclinoid, terminus ICA, right MCA and ACA (black arrows in F). Grade 1 concentric enhancement also noted in left supraclinoid, terminus ICA and left ACA (white arrows in E and F)
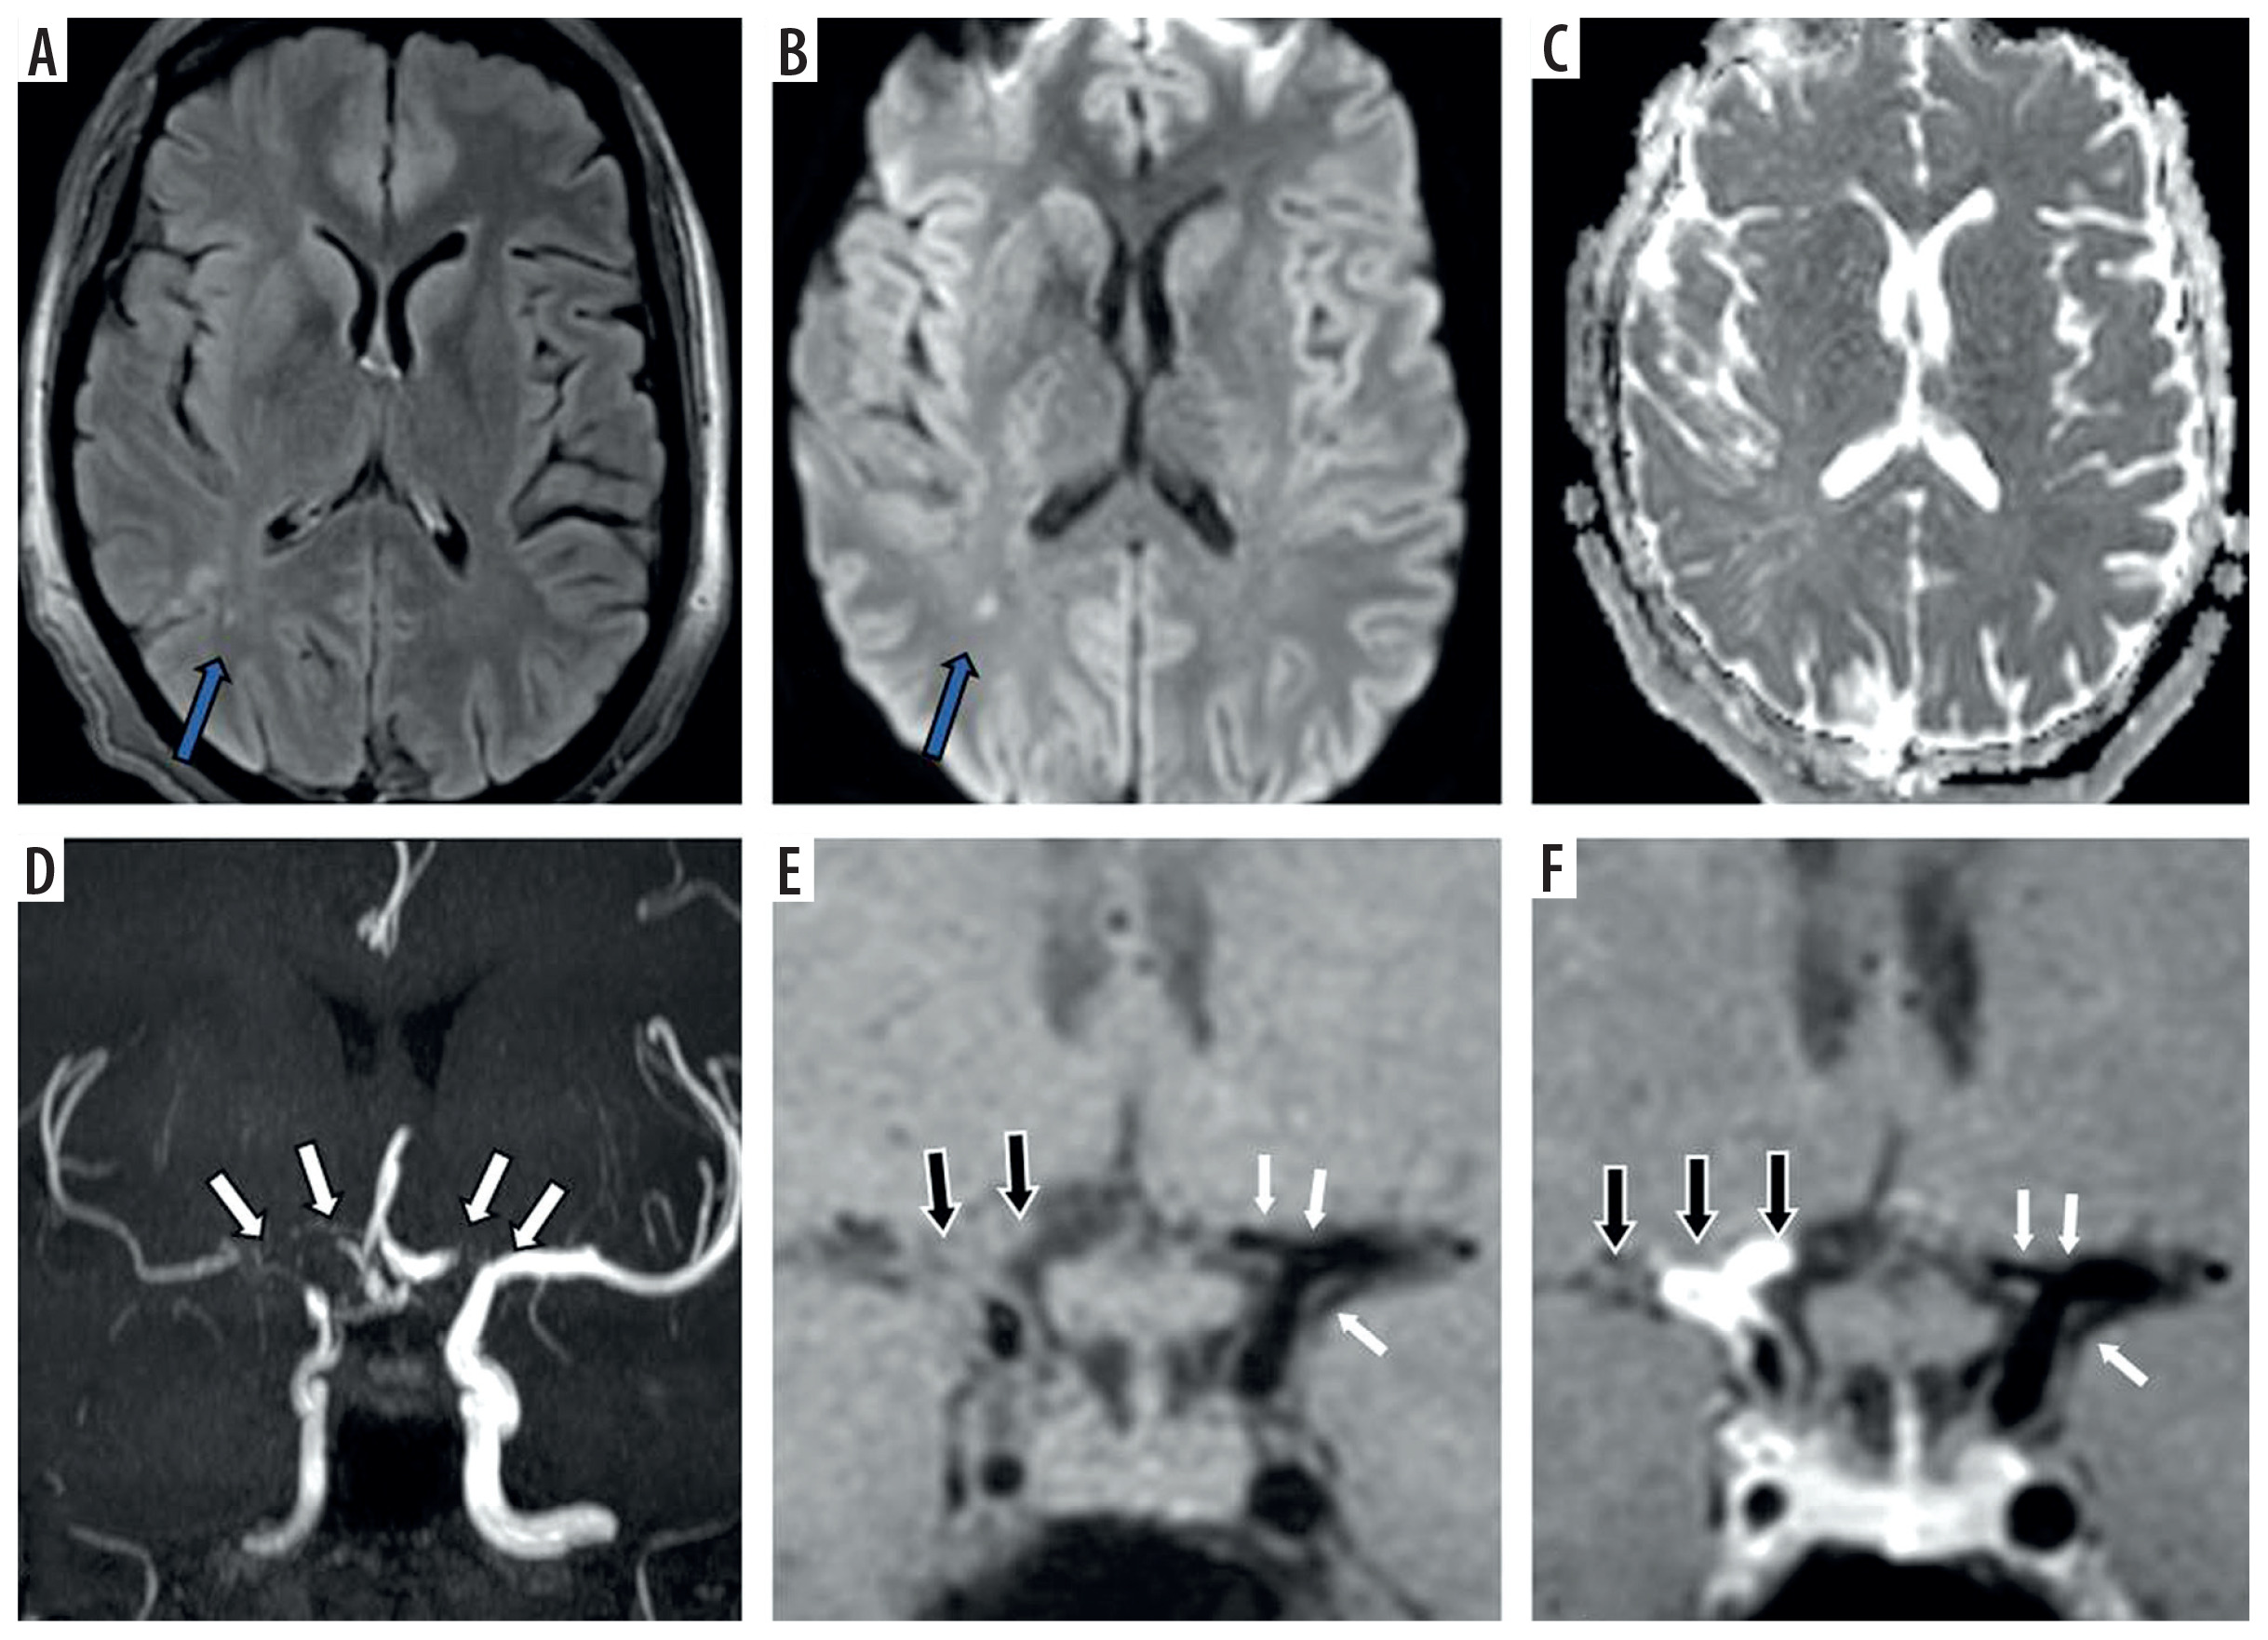
Figure 2
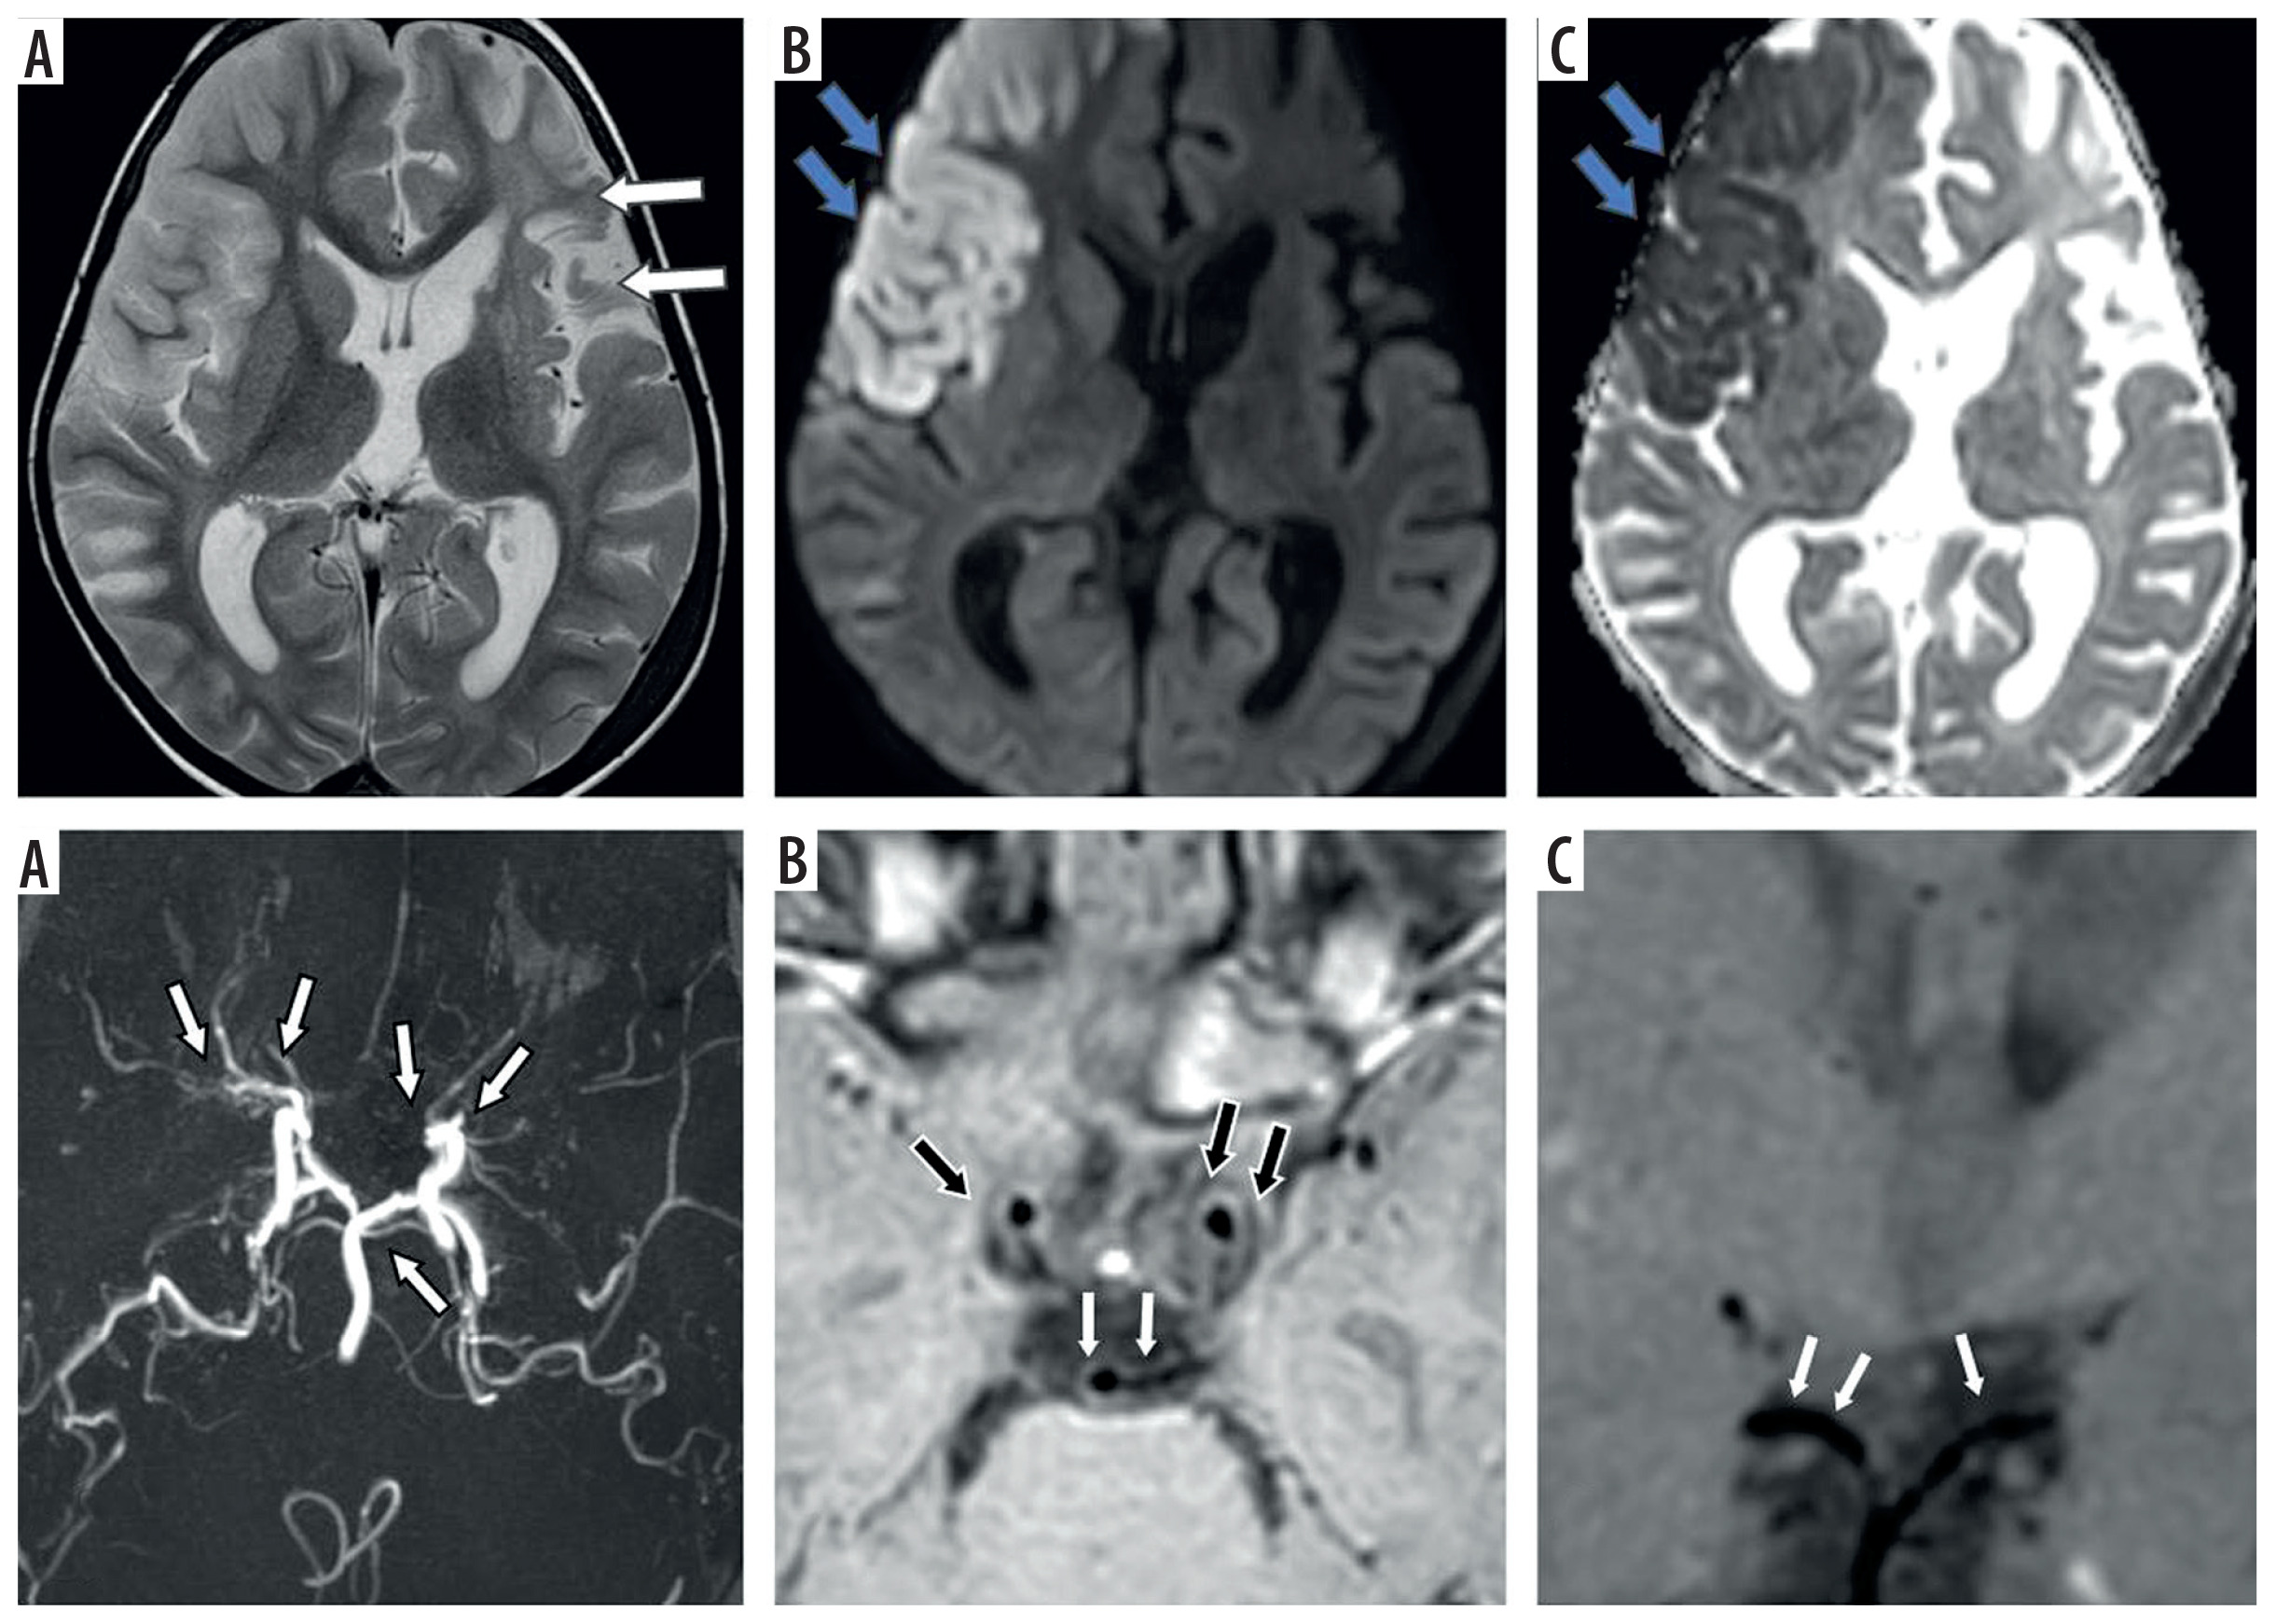
Fifteen-year-old female presenting with right sided hemiparesis. Axial T2 (A), axial diffusion-weighted imaging (B) and axial apparent diffusion coefficient map (C) images show volume loss with mild encephalomalacia in left parieto-occipital region (white arrows in A) along with few areas of diffusion restriction in left temporo-occipital region (blue arrows in B and C). Coronal anterior view maximum intensity projection time-of-flight magnetic resonance angiography (MRA) image (D) shows stenotic left supraclinoid internal carotid artery (ICA) with occluded left terminus ICA and left middle cerebral artery (MCA) (white arrows in D). Coronal post-contrast vessel wall imaging (VWI) (E) and axial post-contrast VWI (F) showing vessel wall thickening and grade 1 concentric enhancement of left supraclinoid, terminus ICA, left MCA and anterior cerebral artery (black arrows in E and F). Grade 1 concentric enhancement is also noted in right supraclinoid, terminus ICA and right MCA (white arrows in E and F)
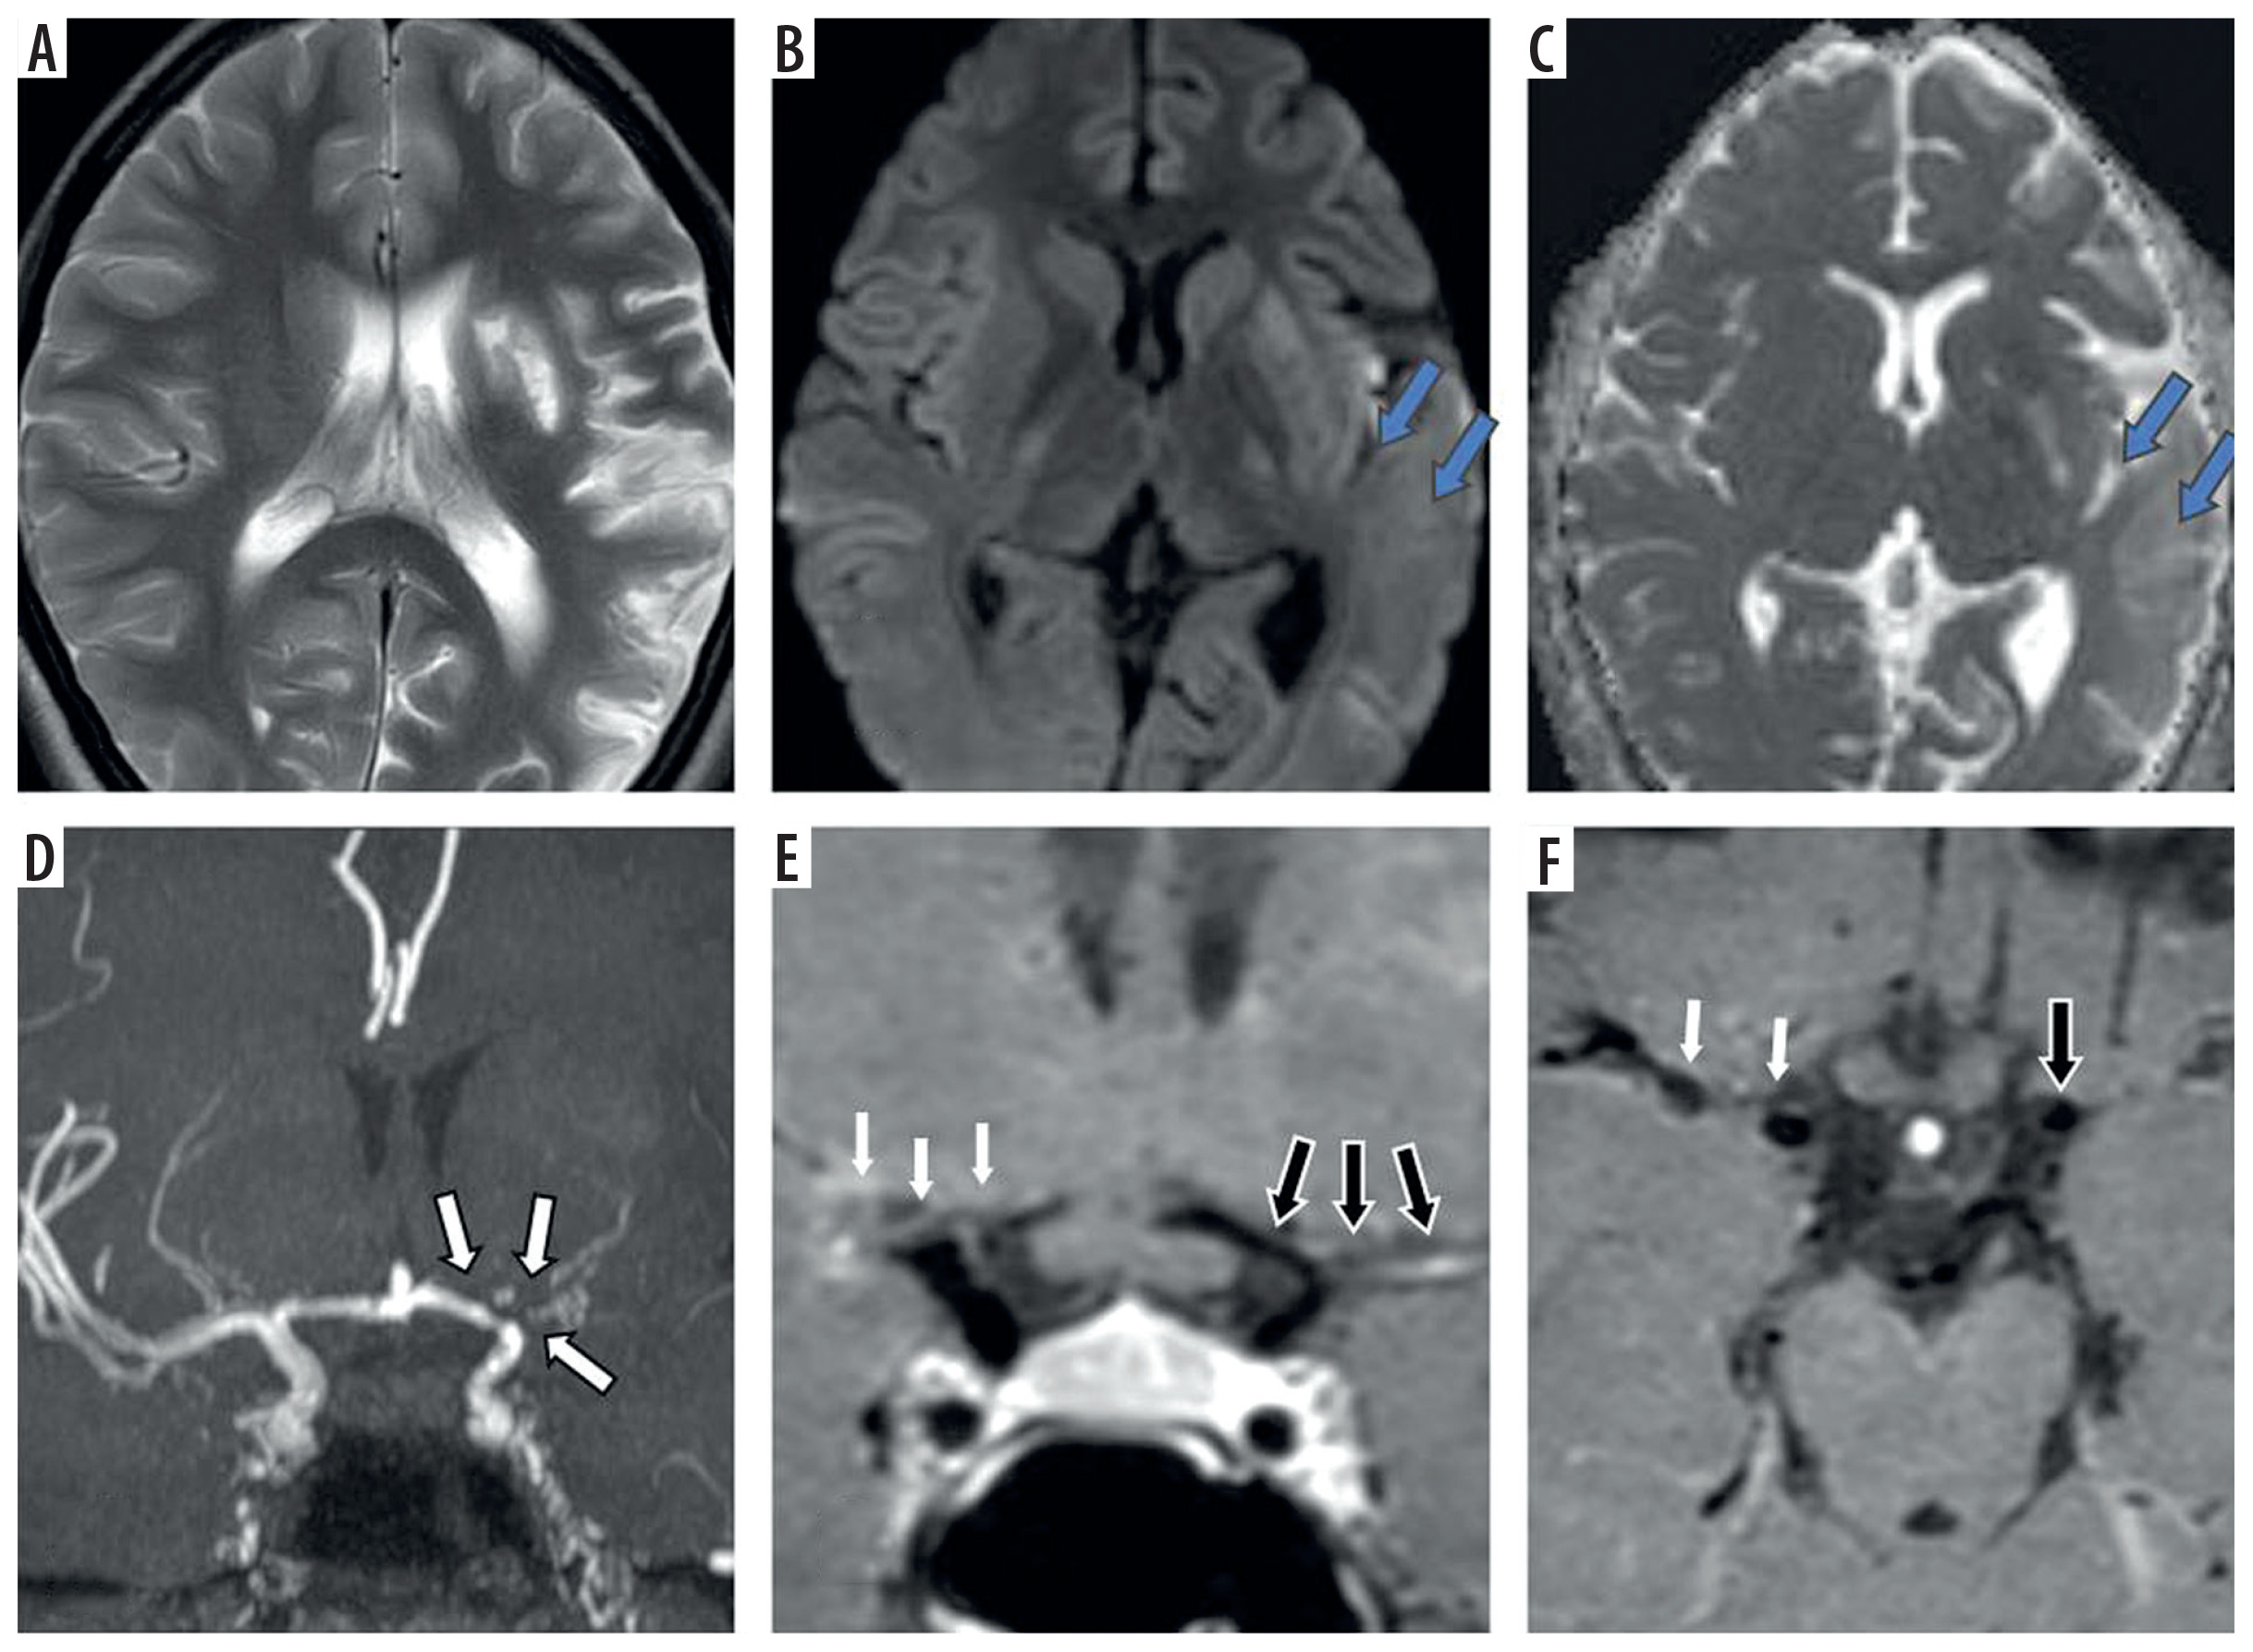
Figure 3
Three-year-old female presenting with right sided hemiparesis for 2 months with recurrent right focal seizures. Axial T2 (A), axial diffusion-weighted imaging (B) and axial apparent diffusion coefficient map (C) images show volume loss in right fronto-parietal region (white arrows in A) with a few foci of diffusion restriction in left parieto-temporal region with cortical diffusion restriction in left frontal lobe (blue arrows in B and C). Coronal anterior view maximum intensity projection time-of-flight magnetic resonance angiography (MRA) image (D) shows stenotic right supraclinoid internal carotid artery (ICA), right terminus ICA, right anterior cerebral artery (ACA) and right middle cerebral artery (MCA) and also left supraclinoid ICA (white arrows in D). Coronal oblique post-contrast vessel wall imaging (VWI) (E) and axial post-contrast VWI (F) showing vessel wall thickening and grade 1 concentric enhancement of right supraclinoid, terminus ICA, right MCA and ACA (black arrows in E and F). Grade 1 concentric enhancement is also noted in left supraclinoid, terminus ICA and left MCA and ACA (white arrows in E and F)
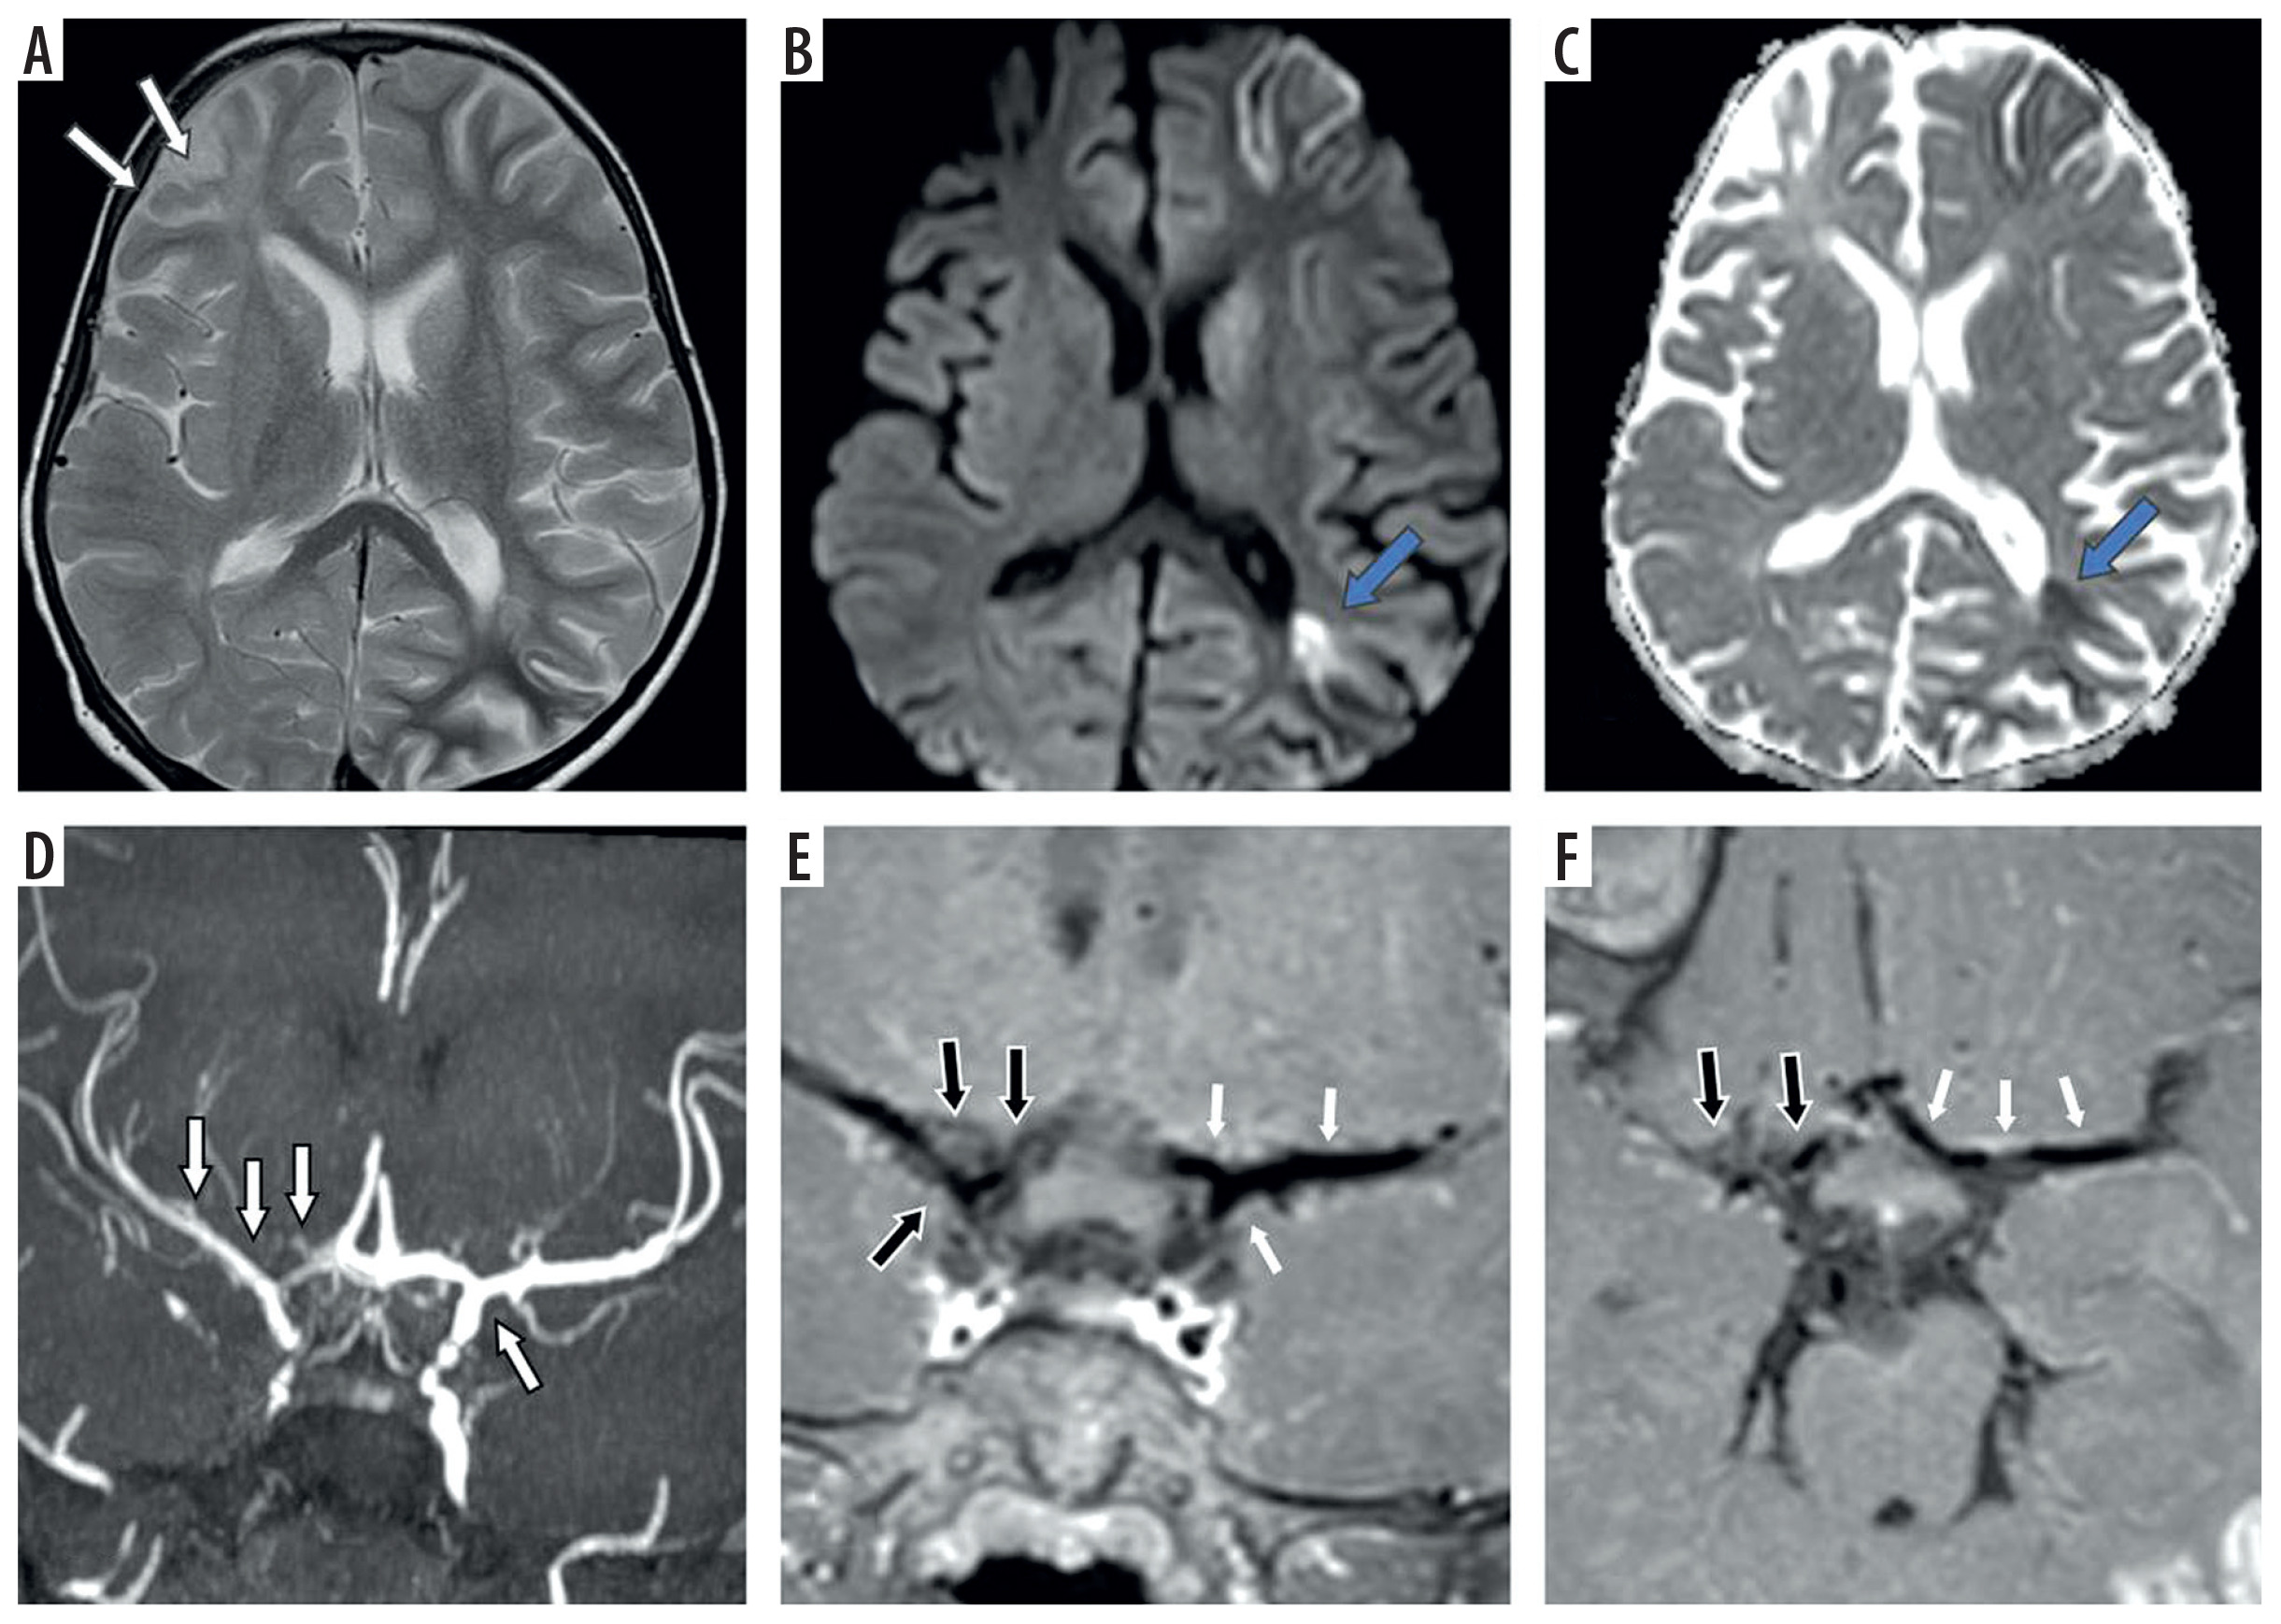
Figure 4
Two-year-old female presenting with left hemiparesis and seizures. Axial T2 (A), axial diffusion-weighted imaging (DWI) (B) and axial apparent diffusion coefficient (ADC) map (C) images show volume loss with encephalomalacic changes in left fronto-parietal region (white arrows in A) along with acute infarct involving right fronto-parietal lobe with diffusion restriction (blue arrows in B and C). Axial maximum intensity projection time-of-flight magnetic resonance angiography (MRA) image (D) shows stenotic bilateral supraclinoid internal carotid artery (ICA), right terminus ICA, occluded left terminus ICA, B/L anterior cerebral artery (ACA), B/L middle cerebral artery (MCA) with normal B/L posterior cerebral artery (PCA) and distal basilar artery (BA) (white arrows in D). Axial (E) and coronal post-contrast vessel wall imaging (VWI) (F) showing vessel wall thickening and grade 1 concentric enhancement of B/L supraclinoid ICAs (black arrows in E) with grade 1 concentric enhancement in bilateral PCA and distal BA (small white arrows in E and F)
Discussion
TOF MRA has been established as a crucial modality for the diagnosis of MMD [7]. A total of 440 vascular segments were assessed on MRA for the presence of steno-occlusive changes.
VWI was performed to analyze the characteristics of the vessel wall in patients with MMD. This encompassed the evaluation of vessel wall thickening and enhancement, their pattern, and the grading of VWCE in the 11 vascular segments as observed on TOF MRA. Thus, a total of 440 vascular segments were also assessed on VWI. Among all the patients studied, we observed positive vessel wall findings in nearly all cases, with 39 patients exhibiting concentric vessel wall thickening and enhancement across a range of vascular segments (0-11). The median interquartile range (IQR) for the total number of vascular segments showing VWCE was 8. The involved vessel wall segments predominantly exhibited smooth concentric enhancement, categorized as grade 0, 1, or 2 [13,17,18]. Only one patient showed no VWCE (grade 0), while the majority of patients (n = 31, 77.5%) displayed grade 1 VWCE, and 8 (20%) patients exhibited grade 2 VWCE. The distribution of vascular segments exhibiting vessel wall findings corresponded closely to the pattern observed on TOF MRA. Notably, VWI identified a higher proportion of abnormal vascular segments (approximately 11.8%) in the posterior circulation as compared to TOF MRA. This suggests that the posterior circulation may be involved in a significant number of cases, even when TOF MRA findings appear normal in the posterior circulation vascular segments.
A strong correlation was found between vessel wall enhancement grade and TOF MRA findings. The results revealed a significant association between these two variables, with a p-value less than 0.001. Among the stenotic vascular segments observed on TOF MRA, 127 (74.3%) exhibited grade 1 VWCE; similarly, among the of the stenotic vascular segments and 13 (9.8%) of the occluded vascular segments on TOF MRA exhibited grade 2 VWCE. This suggests a higher level of enhancement in the vessel wall of these segments compared to those with grade 1 VWCE. Overall, these findings indicate that there is a clear relationship between the vessel wall enhancement grade and the TOF MRA findings. The majority of stenotic and occluded vascular segments exhibited grade 1 VWCE, with a smaller proportion showing grade 2 VWCE [12]. This suggests that vessel wall enhancement may provide additional information about the severity and extent of stenosis or occlusion observed on TOF MRA [19,20].
Multiple other studies have investigated the role of VWI in MMD, highlighting its clinical significance in evaluating disease activity and progression. A consistent finding across multiple studies is the strong association between VWCE and markers of disease activity. Patzig et al. [12] observed a higher prevalence of diffusion-restricted lesions in steno-occlusive segments showing VWCE, suggesting an elevated risk of ischemic events. Lu et al. [20] further demonstrated that both the presence and progression of VWCE at baseline were significantly associated with rapid arterial narrowing and an increased likelihood of future strokes. Similarly, Kathuveetil et al. [9] reported a clear relationship between vessel wall enhancement, thickening, and short-term ischemic events. Collectively, these studies point to VWCE as a promising imaging biomarker for disease activity and prognosis in MMD. Despite these insights, a direct comparative analysis between TOF MRA and VWI in assessing the extent and distribution of vascular involvement in MMD has not been conducted – an unmet gap that serves as the foundation for our current study.
The comparative analysis between TOF MRA and VWI findings yielded noteworthy results. Out of the total vascular segments examined, 304 (69.09%) were identified as abnormal on TOF MRA, whereas VWI detected 358 (81.4%) abnormal vascular segments. This indicates that approximately 11.8% of the vascular segments labeled as normal on TOF MRA exhibited abnormal vessel wall characteristics on VWI, indicating the presence of underlying disease activity despite appearing normal in terms of lumen structure on TOF MRA. Similar trends were observed when comparing the two imaging techniques for each of the 11 vascular segments. Specifically, during the assessment of anterior circulation segments, on average, an additional 3 abnormal vascular segments were detected using VWI as compared to TOF MRA. However, when evaluating posterior circulation, VWI outperformed TOF MRA by detecting an average of 9.33 extra abnormal vascular segments. This demonstrates that VWI is highly efficient and superior in detecting the involvement of the posterior circulation compared to TOF MRA. This could be due to the possibility that mild mural pathological changes are not detectable in luminal angiography studies.
Overall, VWI identified a greater number of abnormal vascular segments compared to TOF MRA. This indicates that VWI is more sensitive in detecting vascular disease activity, particularly in the posterior circulation. These findings emphasize the superior diagnostic capabilities of VWI in assessing vascular pathologies beyond what is evident from TOF MRA images alone.
Limitations
Our study consisted of a single-time assessment, wherein all enrolled patients underwent MRI. No additional follow-up was conducted in our study to evaluate disease progression over time, including any potential changes in the extent of vascular involvement and VWI findings. The assessment of vessel wall characteristics was challenging in occluded vascular segments. Also, we observed cases where vessel wall thickening and enhancement were observed in the posterior circulation with no apparent parenchymal signal changes in corresponding territories, and there remains a gap in understanding the significance of VWCE in the posterior circulation and the underlying pathophysiological mechanism.
Conclusions
This study demonstrated the consistent presence of concentric smooth vessel wall thickening and enhancement in 97.5% of evaluated patients with MMD. VWI identified vessel wall abnormalities in a significant number of normal-appearing vascular segments on TOF MRA (~11.8%), and it detected a higher number of abnormal vascular segments, particularly in the posterior circulation, and exhibited superior efficiency compared to TOF MRA in evaluating the degree and extent of vascular involvement. Therefore, the incorporation of VWI into standard MRI protocols has the potential to serve as a vital tool in assessing the extent and severity of involvement of vascular segments in individuals diagnosed with MMD.