Introduction
Lung cancer is a leading cause of cancer-related mortality worldwide [1,2]. Management strategies are highly stage-dependent, making accurate pretreatment staging essential. Positron emission tomography (PET) using 18-fluorodeoxyglucose (18-FDG) combined with computed tomography (CT), referred to as positron emission tomography- computed tomography (PET-CT), is the key imaging modality for the mediastinal staging of lung cancer [3,4]. Despite its superior diagnostic performance, PET-CT is susceptible to false-negative (FN) and false-positive (FP) results, which may negatively affect therapeutic decision-making. FN results compromise the negative predictive value by failing to detect mediastinal (N2) lymph node disease, potentially leading to inappropriate primary surgical treatment. Conversely, FP results diminish the positive predictive value, risking overstaging and the unnecessary exclusion of curative surgery-based treatments. Prior studies using small cohorts have reported conflicting results. This study aimed to identify factors associated with FN and FP PET-CT results in a large patient cohort using standardised imaging and pathological protocols for consistent results.
Material and methods
The study complies with the Declaration of Helsinki (2013) [5] and was approved by the relevant Ethics Committee. Patient consent was not required because the analysis included de-identified data obtained from medical records.
Clinical questions: What are the risks of FN and FP PET-CT results in the mediastinal staging of lung cancer? Which factors are associated with the FN and FP results?
This retrospective cohort study analysed data sourced from a prospective database.
Location: Department of Thoracic Surgery, John Paul II Hospital, Cracow, Poland.
Characteristic of patients
Consecutive patients with lung cancer who underwent complete resection were included. Inclusion criteria were as follows: age > 18 years; clinical stage I-IVA (including only oligometastatic stage IV cases); preoperative staging with PET-CT, endobronchial ultrasound (EBUS), and endoscopic ultrasound (EUS); and curative anatomical lung resection. Patient data used for analysis included sex, age, body mass index (BMI), tumour histological type and grade, lobar location of the primary tumour, disease stage assessed separately by CT, PET-CT, and combined EBUS and EUS (referred to as combined ultrasound or compression ultrasound [CUS]), and SUVmax values of the primary tumour and lymph nodes, both intrapulmonary (N1) and mediastinal (N2).
Intervention
The preoperative diagnostic workup included PET-CT, bronchoscopy, EBUS, and EUS for all patients. PET-CT imaging was performed using a Discovery 690 scanner (General Electric HealthCare, Chicago, Illinois, USA) with a weight-based 18-FDG dose calculation of 3-4 MBq/kg and an upper blood glucose limit of 11 mmol/l. The protocol included CT attenuation correction imaging and lung window reconstruction (80-210 mA, 3.75-mm section thickness, and 0.8-second gantry rotation speed). Whole-body PET-CT (2.5-mm section thickness) was performed using non-attenuation-corrected (NAC) and measured attenuation-corrected (MAC) images and the Q.Clear algorithm. The reconstructions used were Q.Clear, SharpIR, Q.AC, and VUE Point HD. The SUVmax was calculated using PET Odyssey software. Each study was independently assessed by a radiologist and nuclear medicine specialist.
CUS procedures were conducted by endoscopists experienced in tracheobronchial and esophagogastric endoscopy. Samples from each lymph node station were prepared separately, and cytological smears were fixed in 96% ethanol. CUS procedures have been detailed elsewhere [6].
Lung resections were performed by certified thoracic surgeons with standard lymph node dissection according to the European Society of Thoracic Surgeons guidelines. Dissected nodal stations included the following: right side (2R, 4R, 3A, 7, 8, and 9); left side (5, 6, 7, 8, and 9) [7].
Lymph nodes from each station were dissected separately, fixed in 10% buffered formalin, and labelled. Cytological and histological specimens were examined by an experienced lung pathologist using standard light microscopy images with haematoxylin and eosin staining.
Endpoints
The primary endpoints were FN and FP results of CUS. Additional analyses examined associations between these results and clinical characteristics, including patient age, sex, BMI, tumour histological type and grade, lobar location of the primary tumour, disease stage assessed separately using CT, PET-CT, and CUS, SUVmax of the primary tumour, SUVmax of N1 lymph nodes, and SUVmax of N2 lymph nodes.
Statistical analysis
Statistical software (StatSoft version 13.5 PL; StatSoft, Tulsa, Oklahoma, USA) was used for the analyses. Uni- and multivariate logistic regression models identified the factors associated with false-negative and false-positive PET-CT results in mediastinal lymph nodes. Odds ratios (ORs) with 95% confidence intervals (CI) were calculated for factors such as sex, age, BMI, grade, SUVmax, tumour location, tumour histological type, and CT- and PET-CT-based stage. Statistical significance was set at p < 0.05.
Results
Data from 781 patients were analysed, and the characteristics of the study population are presented in Table 1. Regarding mediastinal lymph node involvement, PET-CT results included 43 false-negative (8%, 43/540), 173 falsepositive (71.8%, 173/241), 497 true-negative (92%, 497/540), and 68 true-positive results (28.2%, 68/241).
Table 1
Characteristics of the study group
[i] ADN – adenocarcinoma, ASC – adeno-squamous carcinoma, BMI – body mass index, CT – computed tomography, LCC – large-cell carcinoma, LCE – left central, LLL – left lower lobe, LUL – left upper lobe, OTH – other histological types, PET – positron-emission tomography, RCE – right central, RLL – right lower lobe, RML – right middle lobe, RUL – right upper lobe, SCC – squamous-cell carcinoma, T SUV – standarised uptake value of primary tumour
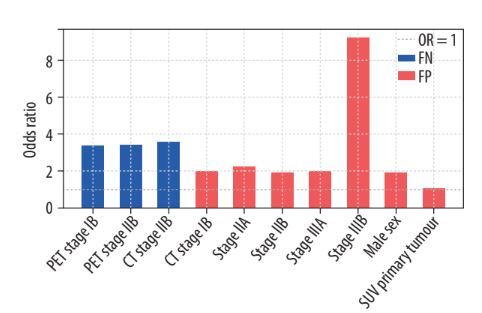
Logistic regression analysis showed a significantly higher risk of FN PET-CT results in patients with a PET-CT-based stage IB and IIB and CT-based stage IIB. The risk of FN results was significantly smaller with PET-CT-based stage IIIA. Compared with PET-CT-based stage IA, the OR for stage IB, IIB, and IIIA were 3.36, 3.42, and 0.17, respectively (p = 0.002-0.015). For CT-based stage IIB, the OR was 3.56 (p = 0.008). No significant association was found between the risk of FN results of PET-CT and other CT-based stages and the following factors: sex (p = 0.245), age (p = 0.684), BMI (p = 0.575), tumour histological type (p: 0.119-0.932) and grade (p = 0.339), lobar location of the primary tumour (p: 0.178-0.667), SUVmax values of the primary tumour (p = 0.956), N2 lymph nodes (p = 0.249), and N1 lymph nodes (p = 0.795) (Table 2).
Table 2
Association between clinical characteristics and false-negative results of positron emission tomography in detecting N2 disease
| Characteristic | OR (95% CI) | p-value |
|---|---|---|
| Sex | 0.688 (0.366-1.293) | 0.245 |
| Age | 1.007 (0.970-1.046) | 0.684 |
| BMI | 0.980 (0.915-1.050) | 0.575 |
| Grade | 1.206 (0.820-1.774) | 0.339 |
| SUVT | 0.998 (0.956-1.042) | 0.956 |
| SUVN2 | 0.105 (0.002-4.852) | 0.249 |
| SUVN1 | 1.015 (0.906-1.137) | 0.795 |
| Primary tumour location* | ||
| RML | 1.266 (0.523-3.061) | 0.559 |
| RLL | 0.973 (0.255-1.771) | 0.422 |
| RC | 0.633 (0.078-5.087) | 0.667 |
| LUL | 2.040 (0.721-5.767) | 0.178 |
| LLL | 1.255 (0.491-3.210) | 0.634 |
| Primary tumour location, right lung vs. left lung | 1.278 (0.682-2.395) | 0.443 |
| Primary tumour location, lower lobes vs. upper lobes | 0.806 (0.388-1.675) | 0.564 |
| Histological type# | ||
| ADN | 1.709 (0.870-3.356) | 0.119 |
| OTH | 0.961 (0.393-2.350) | 0.932 |
| CT stage$ | ||
| IB | 2.331 (0.848-7.274) | 0.077 |
| IIA | 2.484 (0.848-7.274) | 0.097 |
| IIB | 3.563 (1.385-9.161) | 0.008 |
| IIIA | 1.021 (0.207-5.035) | 0.979 |
| PET stage$ | ||
| IB | 3.360 (1.257-8.981) | 0.002 |
| IIA | 5.581 (1.840-16.928) | 0.107 |
| IIB | 3.421 (1.264-9.256) | 0.015 |
| IIIA | 0.174 (0.020-1.463) | 0.015 |
ADN – adenocarcinoma, BMI – body mass index, CI – confidence interval, CT – computed tomography, LLL – left lower lobe, LUL – left upper lobe, OR – odds ratio, OTH – other histological types, PET – positron-emission tomography, RCE – right central, RLL – right lower lobe, RML – right middle lobe, SUVN1 – standardised uptake value of hilar and intrapulmonary lymph nodes, SUVN2 – standardised uptake value of mediastinal lymph nodes, SUVT – standardised uptake value of primary tumour
Analysis of the risk of FP PET-CT results showed a significant association with male sex (OR = 1.925, p = 0.001), SUVmax of the primary tumour (OR = 1.055, p < 0.001), SUVmax of N2 nodes (OR = 0.859, p < 0.001), SUVmax of N1 nodes (OR = 0.937, p = 0.043), adenocarcinoma histology (OR = 0.489, p = 0.013), and CT-based stage of the disease (OR for stage IB, IIA, IIB, IIIA, and IIIB: 1.995, 2.212, 1.928, 1.969, and 9.220, respectively; p: 0.001-0.019). No significant association was found between the risk of FP PET-CT results and age (p = 0.526), BMI (p = 0.217), tumour grade (p = 0.360), or lobar location of the primary tumour (p: 0.280-0.939) (Figure 1, Table 3).
Table 3
Association between clinical characteristics and false-positive results of positron emission tomography in detecting N2 disease
| Characteristic | OR (95% CI) | p-value |
|---|---|---|
| Male sex | 1.925 (1.290-2.872) | 0.001 |
| Age | 1.006 (0.986-1.027) | 0.526 |
| BMI | 0.976 (0.940-1.014) | 0.217 |
| Grade | 1.102 (0.894-1.357) | 0.360 |
| SUVT | 1.055 (1.030-1.080) | < 0.001 |
| SUVN2 | 0.859 (0.792-0.932) | < 0.001 |
| SUVN1 | 0.937 (0.880-0.998) | 0.043 |
| Primary tumour location* | ||
| RML | 1.116 (0.685-1.817) | 0.657 |
| RLL | 0.982 (0.617-1.562) | 0.939 |
| RC | 0.687 (0.249-1.892) | 0.468 |
| LUL | 1.250 (0.648-2.409) | 0.505 |
| LLL | 0.734 (0.418-1.287) | 0.280 |
| Primary tumour location, right lung vs. left lung | 1.120 (0.798-1.572) | 0.509 |
| Primary tumour location, lower lobes vs. upper lobes | 1.181 (0.781-1.784) | 0.428 |
| Histological type# | ||
| ADN | 0.489 (0.321-0.744) | 0.013 |
| OTH | 0.629 (0.442-1.083) | 0.963 |
| CT stage$ | ||
| IB | 1.995 (1.118-3.560) | 0.019 |
| IIA | 2.212 (1.156-4.236) | 0.016 |
| IIB | 1.928 (1.185-3.136) | 0.008 |
| IIIA | 1.969 (1.154-3.359) | 0.012 |
| IIIB | 9.220 (3.512-24.207) | < 0.001 |
ADN – adenocarcinoma, BMI – body mass index, CI – confidence interval, CT – computed tomography, LLL – left lower lobe, LUL – left upper lobe, OR – odds ratio, OTH – other histological types, PET – positron-emission tomography, RCE – right central, RLL – right lower lobe, RML – right middle lobe, SUVN1 – standardised uptake value of hilar and intrapulmonary lymph nodes, SUVN2 – standardised uptake value of mediastinal lymph nodes, SUVT – standardised uptake value of primary tumour
Discussion
This study, analysed the largest cohort to date, evaluating factors influencing FN and FP PET-CT results in the diagnosis of mediastinal lymph node metastasis of lung cancer.
The FN and FP result rates in our study were consistent with those reported in prior studies [8-12].
Logistic regression analysis showed that FN PET-CT results concerning the mediastinal lymph nodes were strongly associated with advanced PET-CT-based stages. In stages IB and IIB, the odds ratio of the FN result was more than 3 times larger than that of stage IA. In addition, the OR for the CT-based IIB stage was more than 3 times larger. However, the PET-CT-based stage IIIA OR was not clinically significant (OR = 0.17, 95% CI: 0.02-1.46). Other factors, such as sex, age, BMI, histological tumour type and grade, lobar location of the primary tumour, SUVmax of the primary tumour, N2 lymph nodes, and N1 lymph nodes, showed no significant impact on FN PET-CT results. These results clarify conflicting results reported from previous studies. Some studies identified an association between higher primary tumour SUVmax values and FN rates [8,10-12], whereas others found a correlation with lower SUVmax values [13,14]. Similarly, adenocarcinoma histology has been linked to both high and low FN rates [8,10,11]. Other statistically significant factors included tumour differentiation, tumour location, and tumour size. The smaller sample sizes of these studies (n: 112-388) may have been insufficient for reliable subgroup analyses.
Regarding FP PET-CT results, significant associations were identified with male sex (OR = 1.93), adenocarcinoma histology, and CT-based stage of the disease. There was also a correlation between the SUVmax of the primary tumour and those of the N2 and N1 nodes; however, the difference was not significant (OR: 1.06, 0.86, and 0.94, respectively). The analysis showed no correlation between age, BMI, tumour grade, and lobar location of the primary tumour.
Notably, male sex as a risk factor for FP PET-CT results has not been previously reported. Other factors, such as adenocarcinoma type and SUVmax of the primary tumour, have been mentioned by some authors in the context of FP results [13]. Furthermore, some authors found a correlation between a lower SUVmax of the primary tumour and a higher FP rate, which was not observed in our study [11,12].
These conflicting outcomes, both in terms of FP and FN results, may be due to the much smaller numbers of patients included in the published studies [8-14].
The strength of our study is the analysis of 781 patients, which, to the best of our knowledge, is the largest cohort published to date. This large sample size enhanced the statistical power and reliability of the findings, particularly regarding the subgroup analysis. Standardised imaging and pathological protocols across all patients reduced variability and increased the consistency and reliability of the results. Comprehensive preoperative diagnostic workups, including PET-CT, bronchoscopy, EBUS, and EUS, ensured accurate initial staging and robust evaluations of PET-CT performance.
Logistic regression models were employed to identify the factors associated with FN and FP PET-CT results. Both uni- and multivariate models were constructed to provide a thorough analysis of the potential influencing factors. These findings have clinical implications and potentially improve the interpretation of PET-CT results in the mediastinal staging of non-small cell lung cancer. This could lead to more accurate staging and, consequently, more appropriate treatment decisions.
The main limitations of this study were its retrospective design and single-institution cohort, which may not fully represent the diversity in patient demographics, disease characteristics, and treatment practices across different healthcare settings and populations. Further prospective studies with larger and more diverse patient cohorts are needed to validate these findings and identify additional factors affecting PET-CT performance.
Conclusions
False-negative PET-CT results for mediastinal lymph node involvement are more likely in patients with PET-CT-based stages IB and IIB and CT-based stage IIB. An increased risk of false-positive PET-CT results can be expected in men, with higher SUVmax values of the primary tumour, and a more advanced CT-based stage of the disease.