Introduction
The increasing use of cross-sectional imaging, particularly computed tomography (CT), has led to a rise in the incidental detection of small renal masses (SRMs), defined as localised renal masses less than 4 cm in diameter [1]. While 20-30% of these masses are benign, the remaining 70-80% are malignant, with renal cell carcinoma (RCC) being the most common, including its clear cell (ccRCC), papillary (pRCC), and chromophobe (chRCC) subtypes [2]. The ability to differentiate between benign and malignant SRMs, as well as to predict their histologic subtype and grade, remains a challenge, often requiring invasive procedures such as biopsy or even unnecessary surgical intervention [3]. This issue is further compounded by the overlap in imaging features between benign conditions, such as renal oncocytomas (RO), angiomyolipoma (AML), papillary adenoma (PA), and RCCs, particularly its conventional subtype [4]. Current imaging modalities, such as multiphase contrast-enhanced CT (MCECT), have shown some utility in distinguishing between these entities, but reliable differentiation is often difficult [5]. For instance, ROs typically appear as hypervascular, homogeneous masses with well-defined margins on CT, but these features overlap significantly with those of RCC [6]. Moreover, even though a central stellate scar is often cited as characteristic of RO, it is not pathognomonic and can be seen in necrotic areas of RCC [7].
A significant diagnostic challenge is the timely detection of malignant renal cysts, particularly those classified as Bosniak IIF, because there are no clear criteria to determine when such lesions require surgical treatment rather than observation, given their borderline status with category III. This differential diagnosis becomes especially challenging when the lesion size is ≤ 4 cm.
However, recent studies suggest that MCECT, which evaluates the enhancement characteristics of SRMs over multiple phases, can provide more accurate differentiation [8]. Specifically, the measurement of signal intensity (SI) at different phases, such as the native non-contrast (NCP), corticomedullary (CMP), nephrographic (NP), and excretory (EP) phases, offers insight into the vascularity and texture of the tumour, which can be indicative of malignancy or benignancy [9,10]. Further advances in the application of CT in SRM characterisation have involved the calculation of the tumour-to-cortex signal intensity (TCSI) ratio, which has shown promise in differentiating malignant from benign tumours, particularly in small solid renal masses [11].
These approaches, especially when combined with advanced imaging processing techniques like texture analysis and machine learning, enable the development of predictive models that do not rely on subjective assessment alone [12,13]. However, machine learning techniques, while promising, are currently limited by their complexity and the time-consuming nature of training the models. Moreover, they remain clinically unavailable in most real-world settings due to the need for large datasets, high computational power, and specialised expertise for their implementation [14,15].
This study aimed to assess the role of multiphase CT in evaluating SRMs by measuring SI and the TCSI ratio to differentiate benign from malignant solid and cystic renal lesions and predict RCC histologic subtypes and grades.
Material and methods
Compliance with ethical standards
This retrospective study was approved by the Local Bioethical Committee. All procedures adhered to the ethical guidelines set by the institutional and national research committees, in compliance with the principles of the 1964 Helsinki Declaration and its subsequent revisions, or equivalent ethical standards. Written informed consent was obtained from all patients for participation in the study. The authors declare no conflicts of interest. The study was conducted between 2015 and 2024.
Study population
Among 181 patients with solid and cystic SRMs, there were 112 men (61.86%) and 69 women (38.14%). The mean age was 57.20 ± 8.11 years, ranging from 36 to 74 years. The mean age for men was 57.72 ± 5.45 years, and for women, 56.89 ± 6.11 years. Lesions were slightly more common in the left kidney, affecting 97 patients (53.87%), compared to 84 patients (46.13%) with right kidney involvement. No statistically significant differences in clinical characteristics were observed between the groups and subgroups of patients (p > 0.05). The inclusion criteria for the study were as follows: adult patients; renal solid or cystic lesion size ≤ 4 cm in the largest dimension according to imaging studies, in solid SRMs only cases with verified diagnoses based on postoperative histopathological findings, and the absence of contraindications for contract-enhanced multiphase CT (such as allergy to contrast agents, severe renal or hepatic insufficiency, claustrophobia, and pregnancy). Patients with urinary tract infections or bilateral or multiple renal lesions were excluded from the study. Prior to inclusion, no patient had undergone biopsy or any treatment for a renal tumour.
Pathomorphological evaluation
The WHO classification was used for the pathologic classification. Due to the sample size, ISUP grades I and II were combined as well-differentiated tumours, while grades III and IV were grouped as poorly differentiated tumours. The TNM Classification of Malignant Tumours by the Union for International Cancer Control was applied for RCC and UTUC staging.
Solid small renal masses
The study analysed 110 cases of pathologically verified (by partial or radical nephrectomy) solid SRMs, including 79 cases of RCC (71.8%), further classified into 48 cases of ccRCC (43.6%), 16 cases of pRCC (14.5%), and 15 cases of chRCC (13.6%). Additionally, 10 cases of upper urinary tract urothelial carcinoma (UTUC) located in the renal pelvis (9.1%) were enrolled. According to the TNM classification and histopathological findings, all patients with RCC were classified as pT1aN0M0 (Stage I), and all patients with UTUC of the renal pelvis were classified as pT1N0M0 (Stage I). There were also 21 cases of benign renal tumours (19.1%), comprising 9 cases of RO (8.2%), 7 cases of AML (6.4%), and 5 cases of PA (4.5%).
Cystic small renal masses
The study involved 71 cases of cystic SRMs. The indication for MCECT of the abdomen in patients with simple renal cysts (Bosniak categories I and II) was the presence of radiologically uncertain findings on prior ultrasound or MRI. All Bosniak IIF cysts included in the study were monitored for at least one year (mean follow-up: 1.2 years) using cross-sectional imaging with contrast enhancement. During this period, these cysts developed radiologically suspicious or definitive signs of malignancy (e.g. thickened septa or walls, increased contrast enhancement), prompting surgical intervention and subsequent pathological analysis. All patients with Bosniak III or IV renal cysts also underwent surgical treatment, with study inclusion requiring histopathological confirmation.
Among Bosniak category IIF cysts, 8 cases (50%) were benign and 8 cases (50%) were RCC. For Bosniak category III cysts, 25 cases (78.13%) were RCC, one case (3.13%) was a cystic variant of fat-poor AML, 3 cases (9.38%) were oncocytomas with a pronounced cystic component, 2 cases (6.25%) were cystic nephromas, and one case (3.13%) was a renal leiomyoma with a pronounced cystic component. Among Bosniak category IV cysts, 28 cases (90.32%) were RCC, one case (3.23%) was a cystic variant of fat-poor AML, one case (3.23%) was a cystic form of oncocytoma, and one case (3.23%) was a metanephric adenoma with a significant cystic component. In total, across Bosniak category III and IV cysts, 53 cases (83.33%) were RCC and 10 cases (16.67%) were benign tumours. Based on TNM classification and histopathological analysis, all cystic RCC cases were staged as pT1aN0M0 (Stage I) and identified as the conventional histological subtype.
CT examination
In all cases, abdominal MCECT was performed, using a BrightSpeed 16 multislice CT scanner (General Electric®, USA). Studies were conducted with the patient in the supine position, using a spiral method in the craniocaudal direction. Patients were instructed to hold their breath during CT scans to minimise motion artifacts. The scanning protocol adhered to the manufacturer’s guidelines, utilising the following parameters: spiral density = 5.0 mm, pitch = 1.375: 1, speed = 27.50 mm/rotation, interval = 5.0 mm, gantry tilt angle = 80.0°, FOV = 46 × 46 cm, kV = 130, mA = 350, and total dose: 20-30 mSv. The total examination time was 10-20 min. MCECT was performed, capturing images in 4 phases: NCP, CMP, NP, and EP. The CMP was defined as bright enhancement of the renal cortex with minimal enhancement of the renal medulla and was obtained after a delay of 35-40 s following contrast injection. The NP was defined as homogeneous enhancement of both the renal cortex and medulla without contrast excretion into the collecting system and was performed after a delay of 70-75 s. The EP, defined by the excretion of contrast into the collecting system, was performed with a delay of 8-10 min. The contrast medium, either iopromide or iohexol, was administered intravenously at a dose of 1-1.2 ml per kg of body weight using an 18-gauge needle inserted into the antecubital vein. The injection was performed with a semi-automated power injector Dual Shot alpha 7 (Nemoto®, Japan) at a flow rate of 3 ml/s, followed by 40 ml of saline solution. No adverse reactions to the contrast medium were observed in any patient. The examinations were performed after patients fasted and consumed 1.5 litres of fluid in preparation for the scan. All CT images were transmitted to a picture archiving and communication system (PACS) for interpretation on workstations.
CT image analysis
In all SRMs, detailed topographic characterisation of the tumour lesion was performed, including the determination of tumour size, maximal lesion diameter (cm), shape, position, margins (well-defined/irregular), pole (upper/middle/lower), location (exophytic/endophytic), presence of a central scar, necrotic areas, nodular contrast enhancement, poorly defined margins, cystic components, high vascularity, calcifications, macroscopic fat, angular interface sign, multicentric growth, vascular invasion, and perirenal fat invasion. Additionally, the assessment included invasion of the collecting system/renal sinus, extension into surrounding tissues (including the adrenal gland), size and extent of tumour thrombus in the renal and inferior vena cava, and the status of regional lymph nodes. All features were independently evaluated by 2 reviewers with extensive experience in urogenital radiology, who were blinded to the histological subtype of the tumour.
The SI values of SRMs and normal renal cortex from each phase of MCECT were analysed across all groups and subgroups, and the TCSI ratio was derived from these measurements using the following methodology: on anatomically corresponding pre-contrast images and those obtained during the CMP, NP, and EP, a region of interest (ROI) was carefully placed over the tumour area, following its contour precisely (excluding areas of necrosis or cystic inclusions in solid tumours). The tissue attenuation of the lesion was recorded in Hounsfield units (HU). In cases of pronounced tumour heterogeneity, the ROI was placed over the area with the highest attenuation. To characterise renal cystic lesions, the Bosniak classification of cystic renal masses was used, which served as the basis for determining the cyst category [16].
For cysts categorized as Bosniak I, II, and IIF, the ROI was placed over the cyst, meticulously following its contour. For cysts in Bosniak categories III and IV, additional measurements were taken for the tissue component (thickened septa, walls) by positioning the ROI over the area with the highest attenuation. Thus, 3 measurements were conducted for each tumour, and the arithmetic mean was calculated based on these values. The TCSI ratio was calculated as the ratio of the SI of the tumour to the SI of the normal renal cortex of the contralateral kidney. For this purpose, an ROI with an average diameter of 1.5 ± 0.5 cm was placed over a symmetrical region of healthy renal cortex in the contralateral kidney, and measurements were conducted in the same manner as for the tumour for each CT phase. For the CT data processing RadiAnt DICOM Viewer (https://www.radiantviewer.com) was used.
Reference values
A reference values of imaging biomarkers were used, obtained from individuals without clinical or imaging signs of kidney pathology based on clinical and imaging studies (complete blood count, urinalysis, blood biochemistry for urea and creatinine levels, and renal ultrasound). These individuals (n = 30) were examined due to suspected extrarenal abdominal pathology, which was not confirmed radiologically. The abdominal scanning protocol, intravenous contrast agent, dosage, and timing parameters of the scanning phases were identical to those used for CT diagnosis of renal tumours. The mean age of the reference group was 53.67 ± 8.64 years (ranging 37-69 years).
Statistical analysis
Descriptive statistics were used to summarise the patients’ baseline demographic characteristics and tumour characteristics. Comparisons between the categorical variables were tested using the Pearson chi-square or Fisher exact probability test. The normality of the distribution was tested using the Shapiro-Wilk test. Differences in imaging marker values across groups and subgroups of patients were calculated using the one-way analysis of variance (ANOVA) procedure. The area under the curve (AUC), along with the 95% confidence interval (CI), was calculated through ROC analysis to assess the predictive performance of the models in distinguishing malignant from benign masses. The critical level of statistical significance for the null hypothesis was accepted as < 0.05. Statistical analysis was performed using SPSS v.22 software.
Results
Distinguishing between malignant and benign solid small renal masses
The mean size of the solid SRMs was 3.16 ± 0.55 cm (ranging 1.90-3.90 cm). The mean tumour size in patients with RCC was 3.18 ± 0.52 cm (ranging 2.0-3.90 cm), in patients with UTUC of the renal pelvis was 3.07 ± 0.58 cm (ranging 1.95-3.70 cm), and in patients with benign renal tumours was 3.12 ± 0.66 cm (ranging 2.0-3.90 cm). There were no statistically significant differences in renal lesion size among the groups and subgroups of patients (p > 0.05).
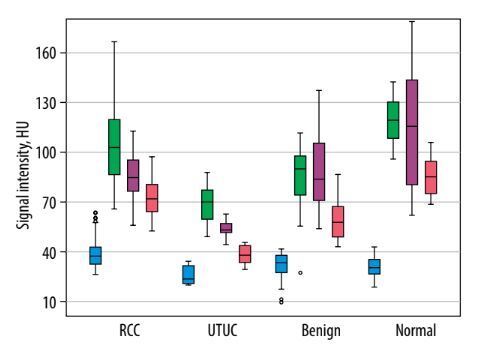
Analysis of tumour SI on pre-contrast CT images showed significant differences in mean SI values between RCC and UTUC of the renal pelvis (p < 0.001) and between UTUC and benign renal tumours (p = 0.028). In contrast, no significant difference was observed between RCC and benign SRMs (p = 0.236). Comparison of SRM SI on CT images during the CMP revealed statistically significant differences between RCC and both the UTUC group (p < 0.001) and the benign tumour group (p = 0.001). However, the mean SI values for UTUC of the renal pelvis and benign tumours did not differ significantly from each other (p = 0.168), although both were significantly different from the SI of the reference group (p < 0.001). When evaluating the mean SI values within groups with renal lesions on CT images during the NP, no significant difference was identified between the RCC and benign SRM subgroups (p = 0.952). In all other comparisons, a statistically significant difference was recorded. Unexpectedly, significant differences in the mean SRM SI on CT images during the EP were observed between all groups (p < 0.001) (Table 1, Figure 1).
Table 1
Mean attenuation values of small renal masses on computed tomography images across phases
Figure 1
Boxplot of the attenuation values for malignant and benign small renal masses during the phases of computed tomography
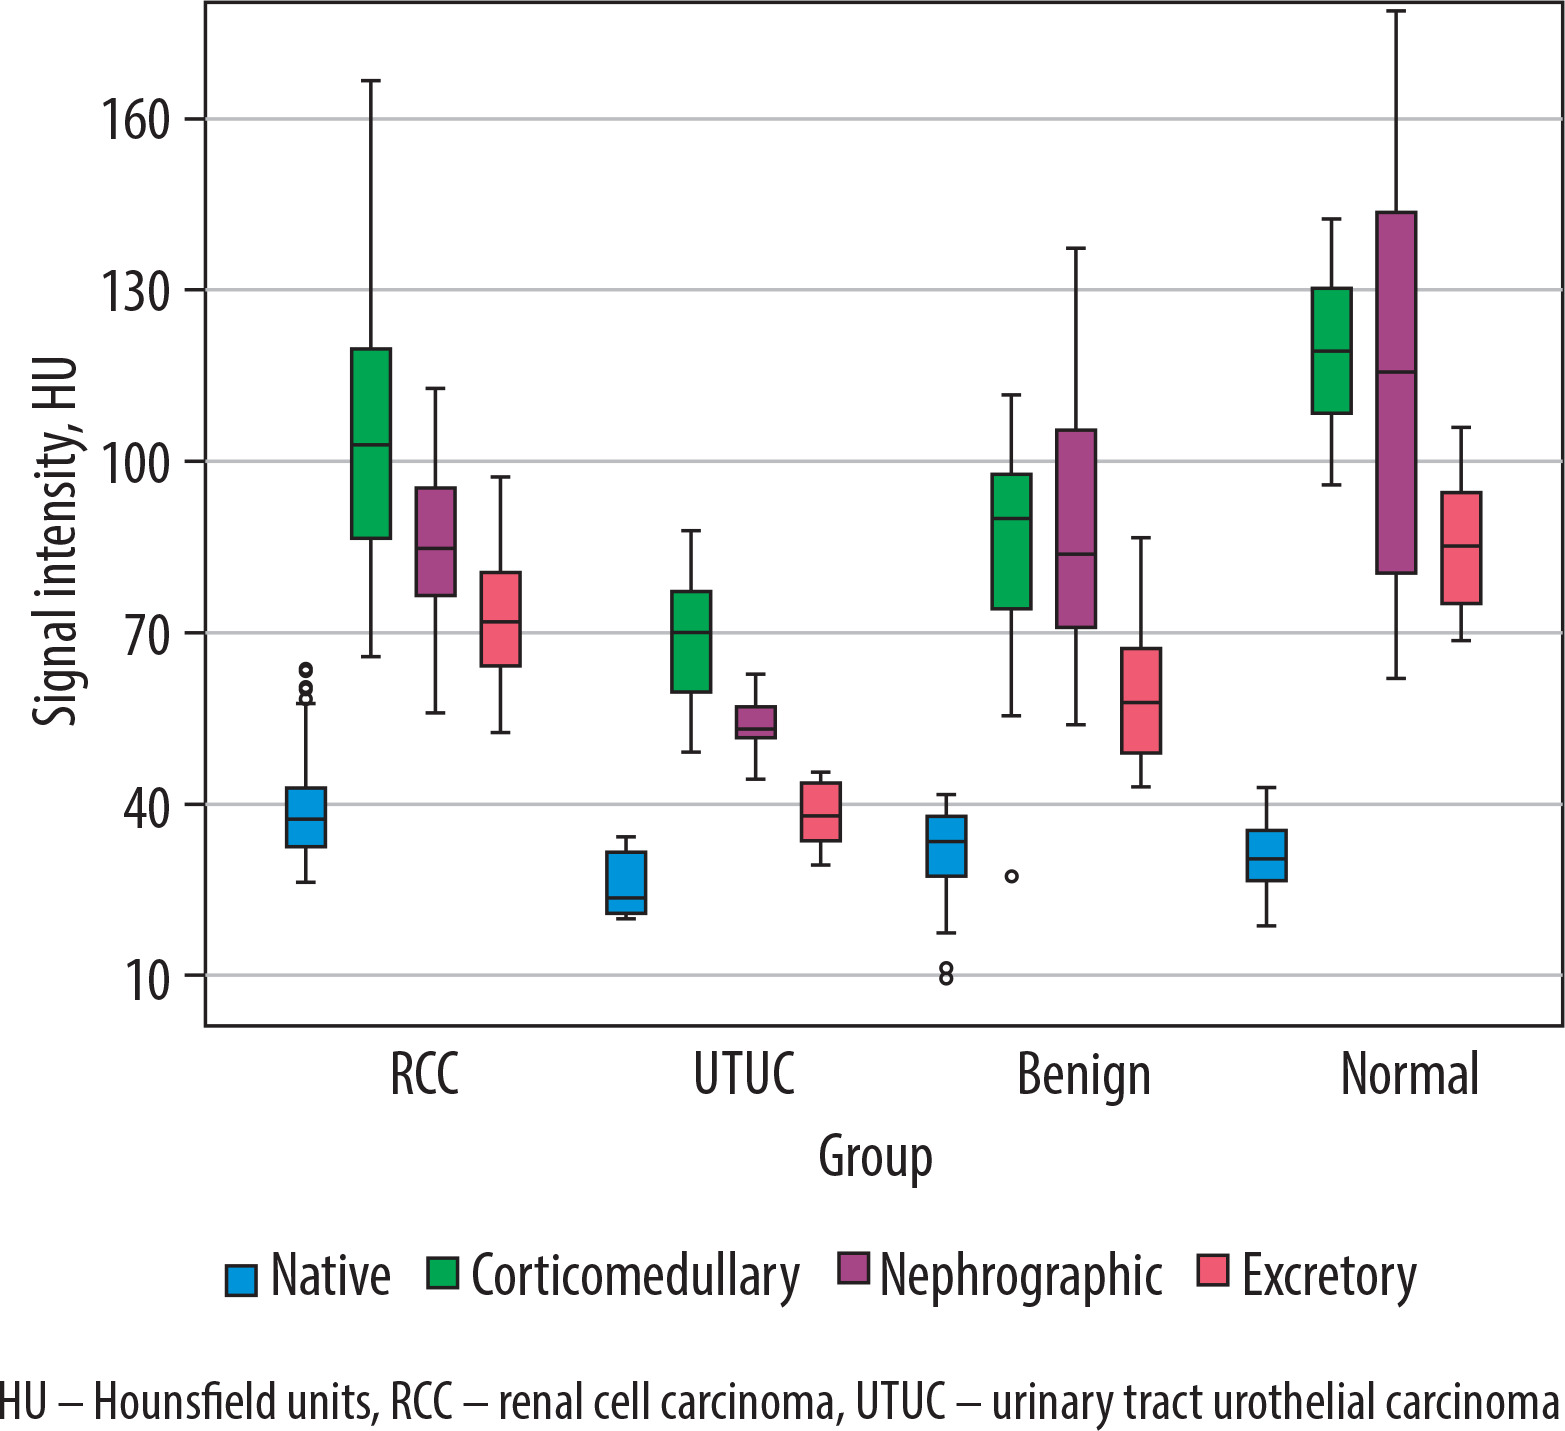
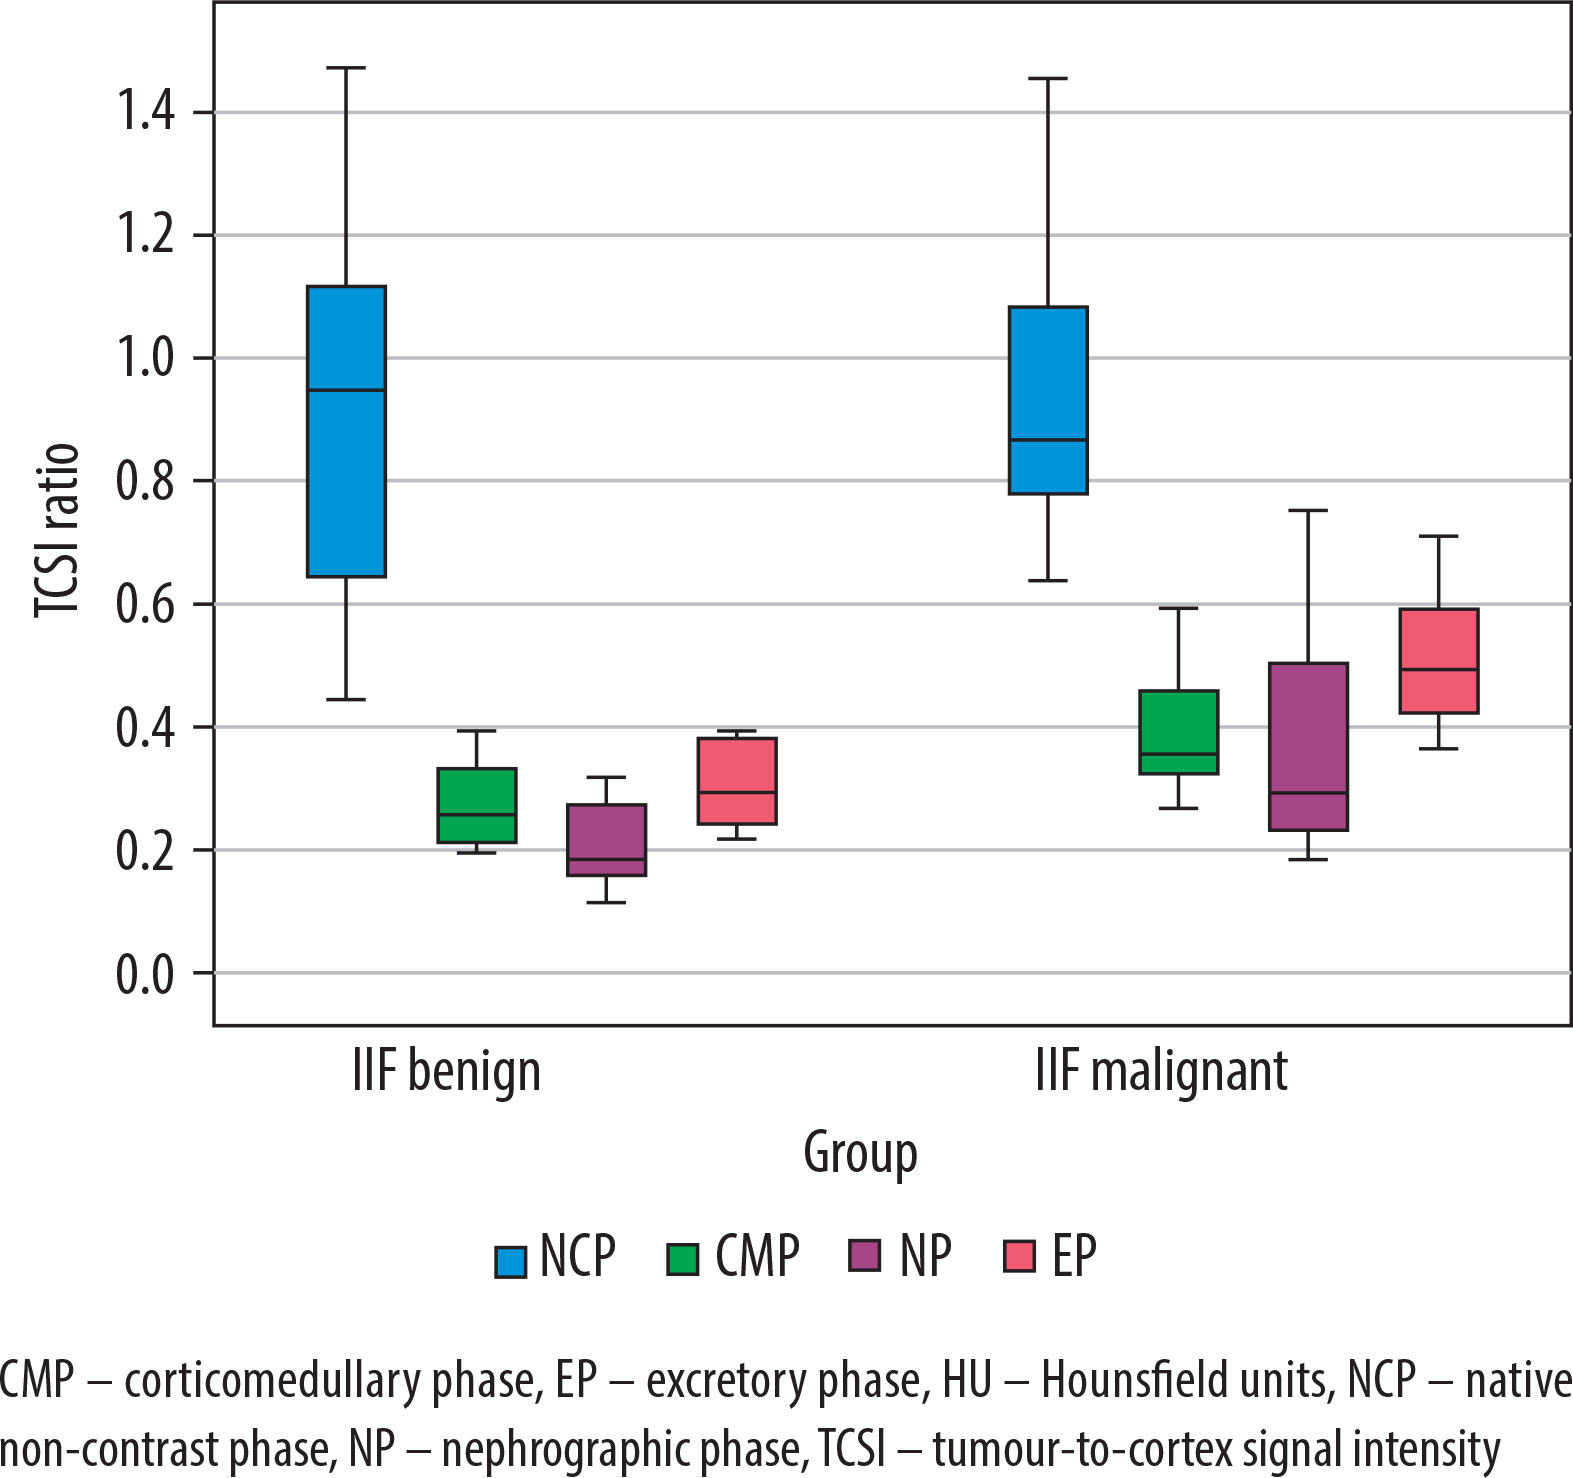
The subsequent analysis focused on calculating the TCSI ratio across patient groups. The mean TCSI ratio obtained from NCP CT images revealed significant differences between RCC and UTUC of the renal pelvis (p = 0.001) and RCC and benign renal tumours (p = 0.032). However, no significant difference was found between the UTUC and benign renal tumour groups (p = 0.328). During the CMP, the mean TCSI ratio for RCC differed significantly from both the UTUC of the renal pelvis and benign renal tumour groups (p < 0.001). However, no significant difference was observed between RCC and benign tumours (p = 0.311). On NP CT images, a significant difference in the mean TCSI ratio was identified between RCC and the UTUC of the renal pelvis group (p = 0.026). Conversely, no significant difference was found between RCC and benign SRMs (p = 0.993). A significant difference was also noted between the UTUC of the renal pelvis group and benign SRMs (p = 0.043). In the EF phase, statistically significant differences in the mean TCSI ratio were observed across all groups (Table 2, Figure 2).
Table 2
Mean tumour-to-cortex signal intensity ratio of small renal masses on computed tomography images across phases
Figure 2
Boxplot of the tumour-to-cortex signal intensity ratio values for malignant and benign small renal masses during the phases of computed tomography
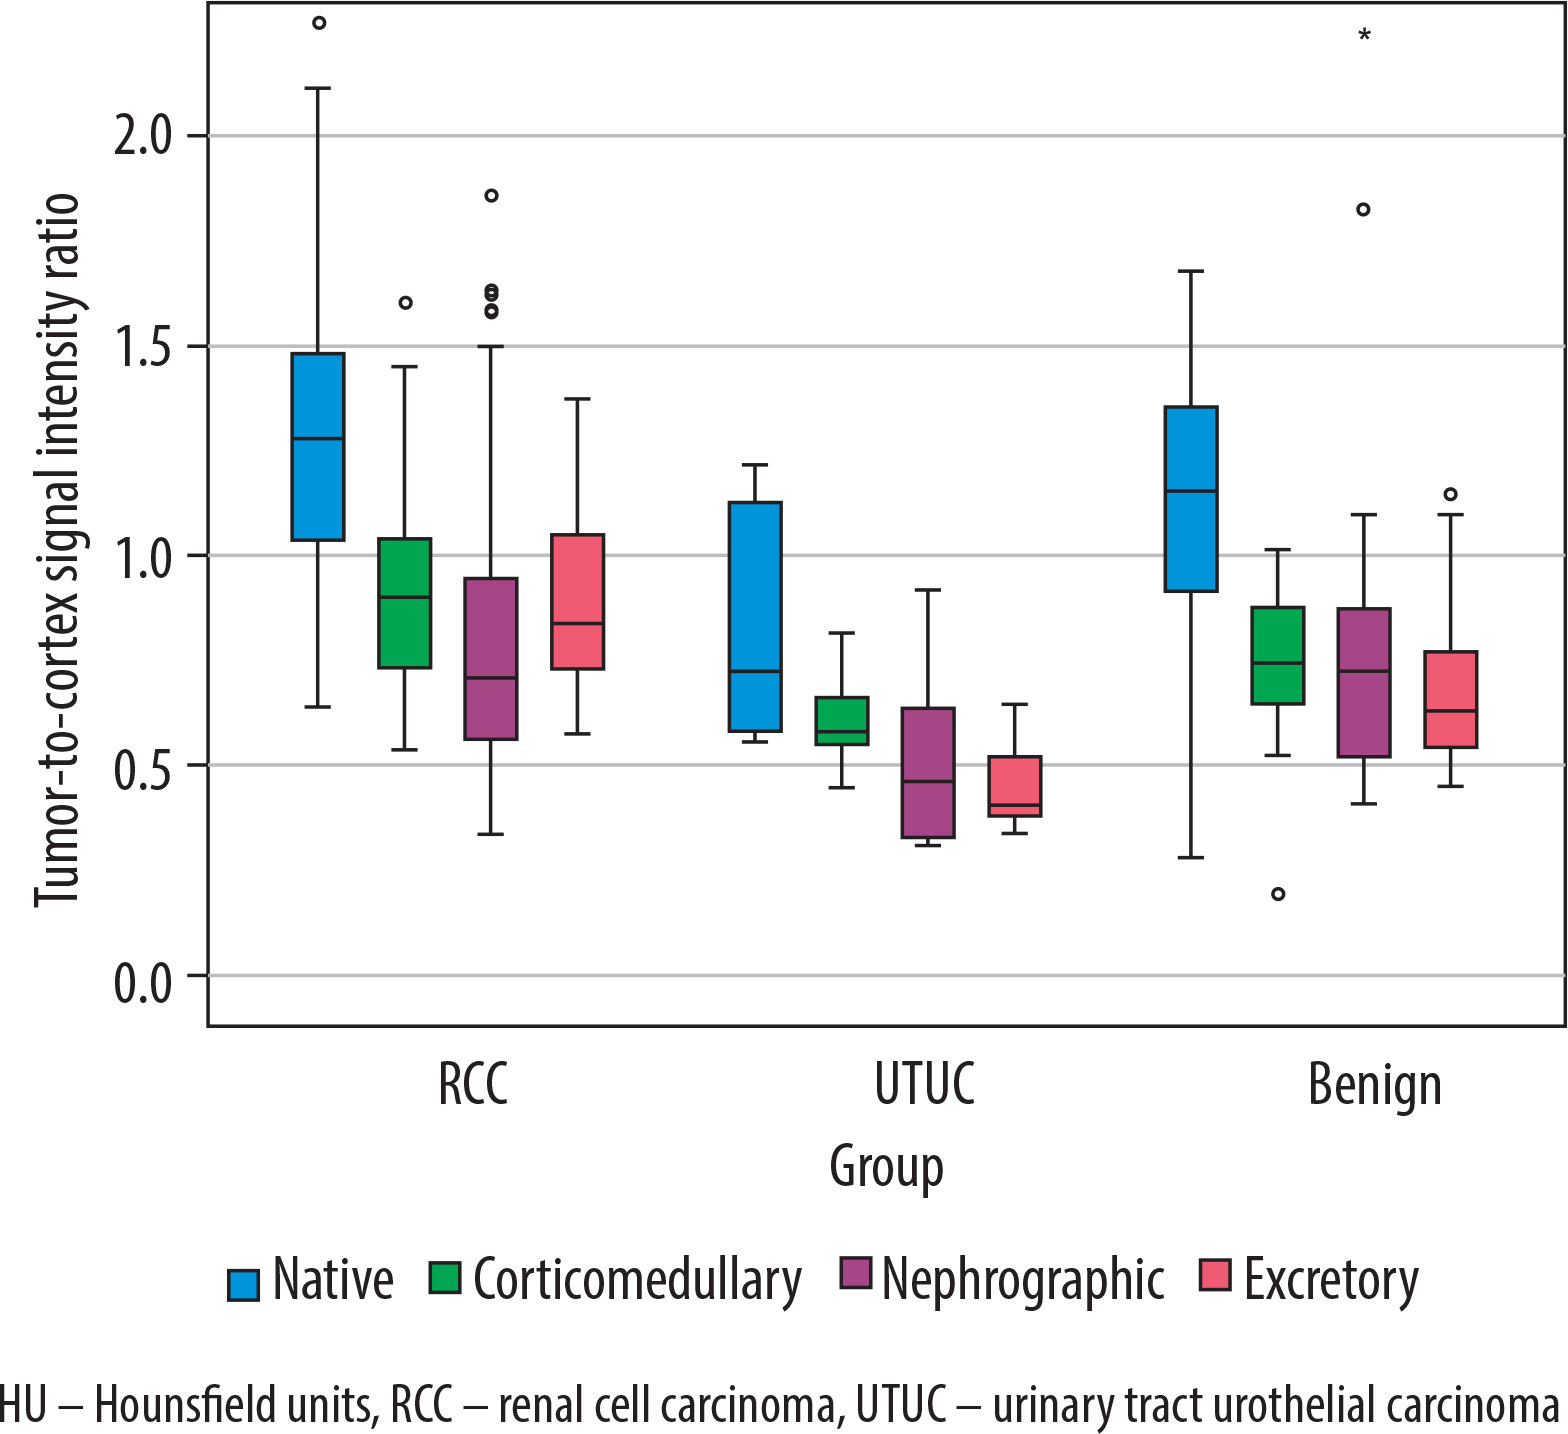
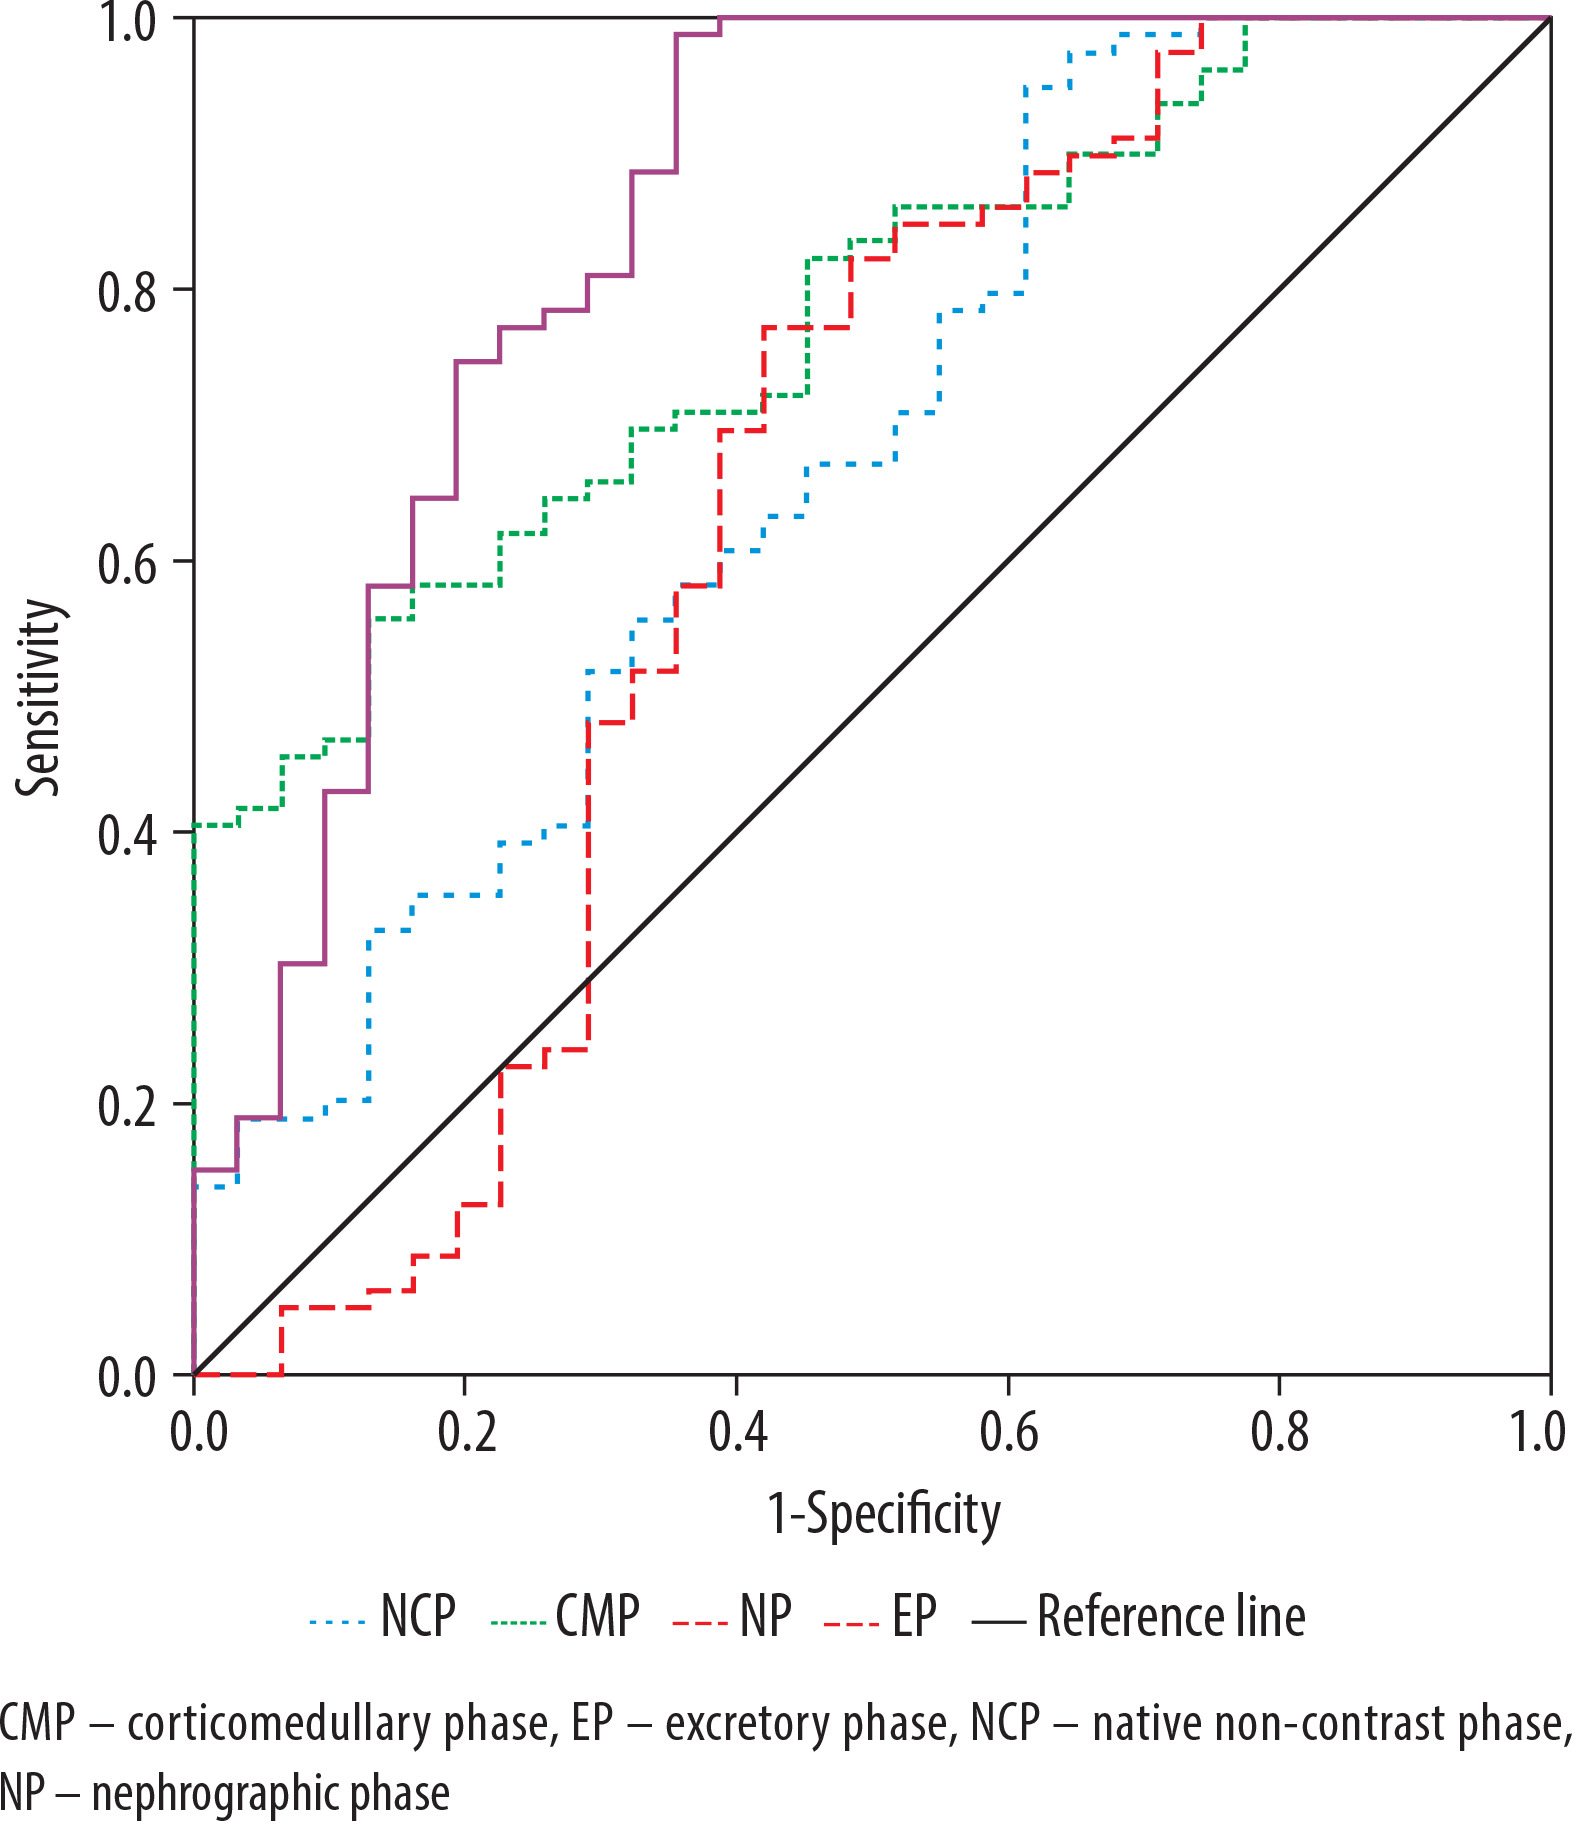
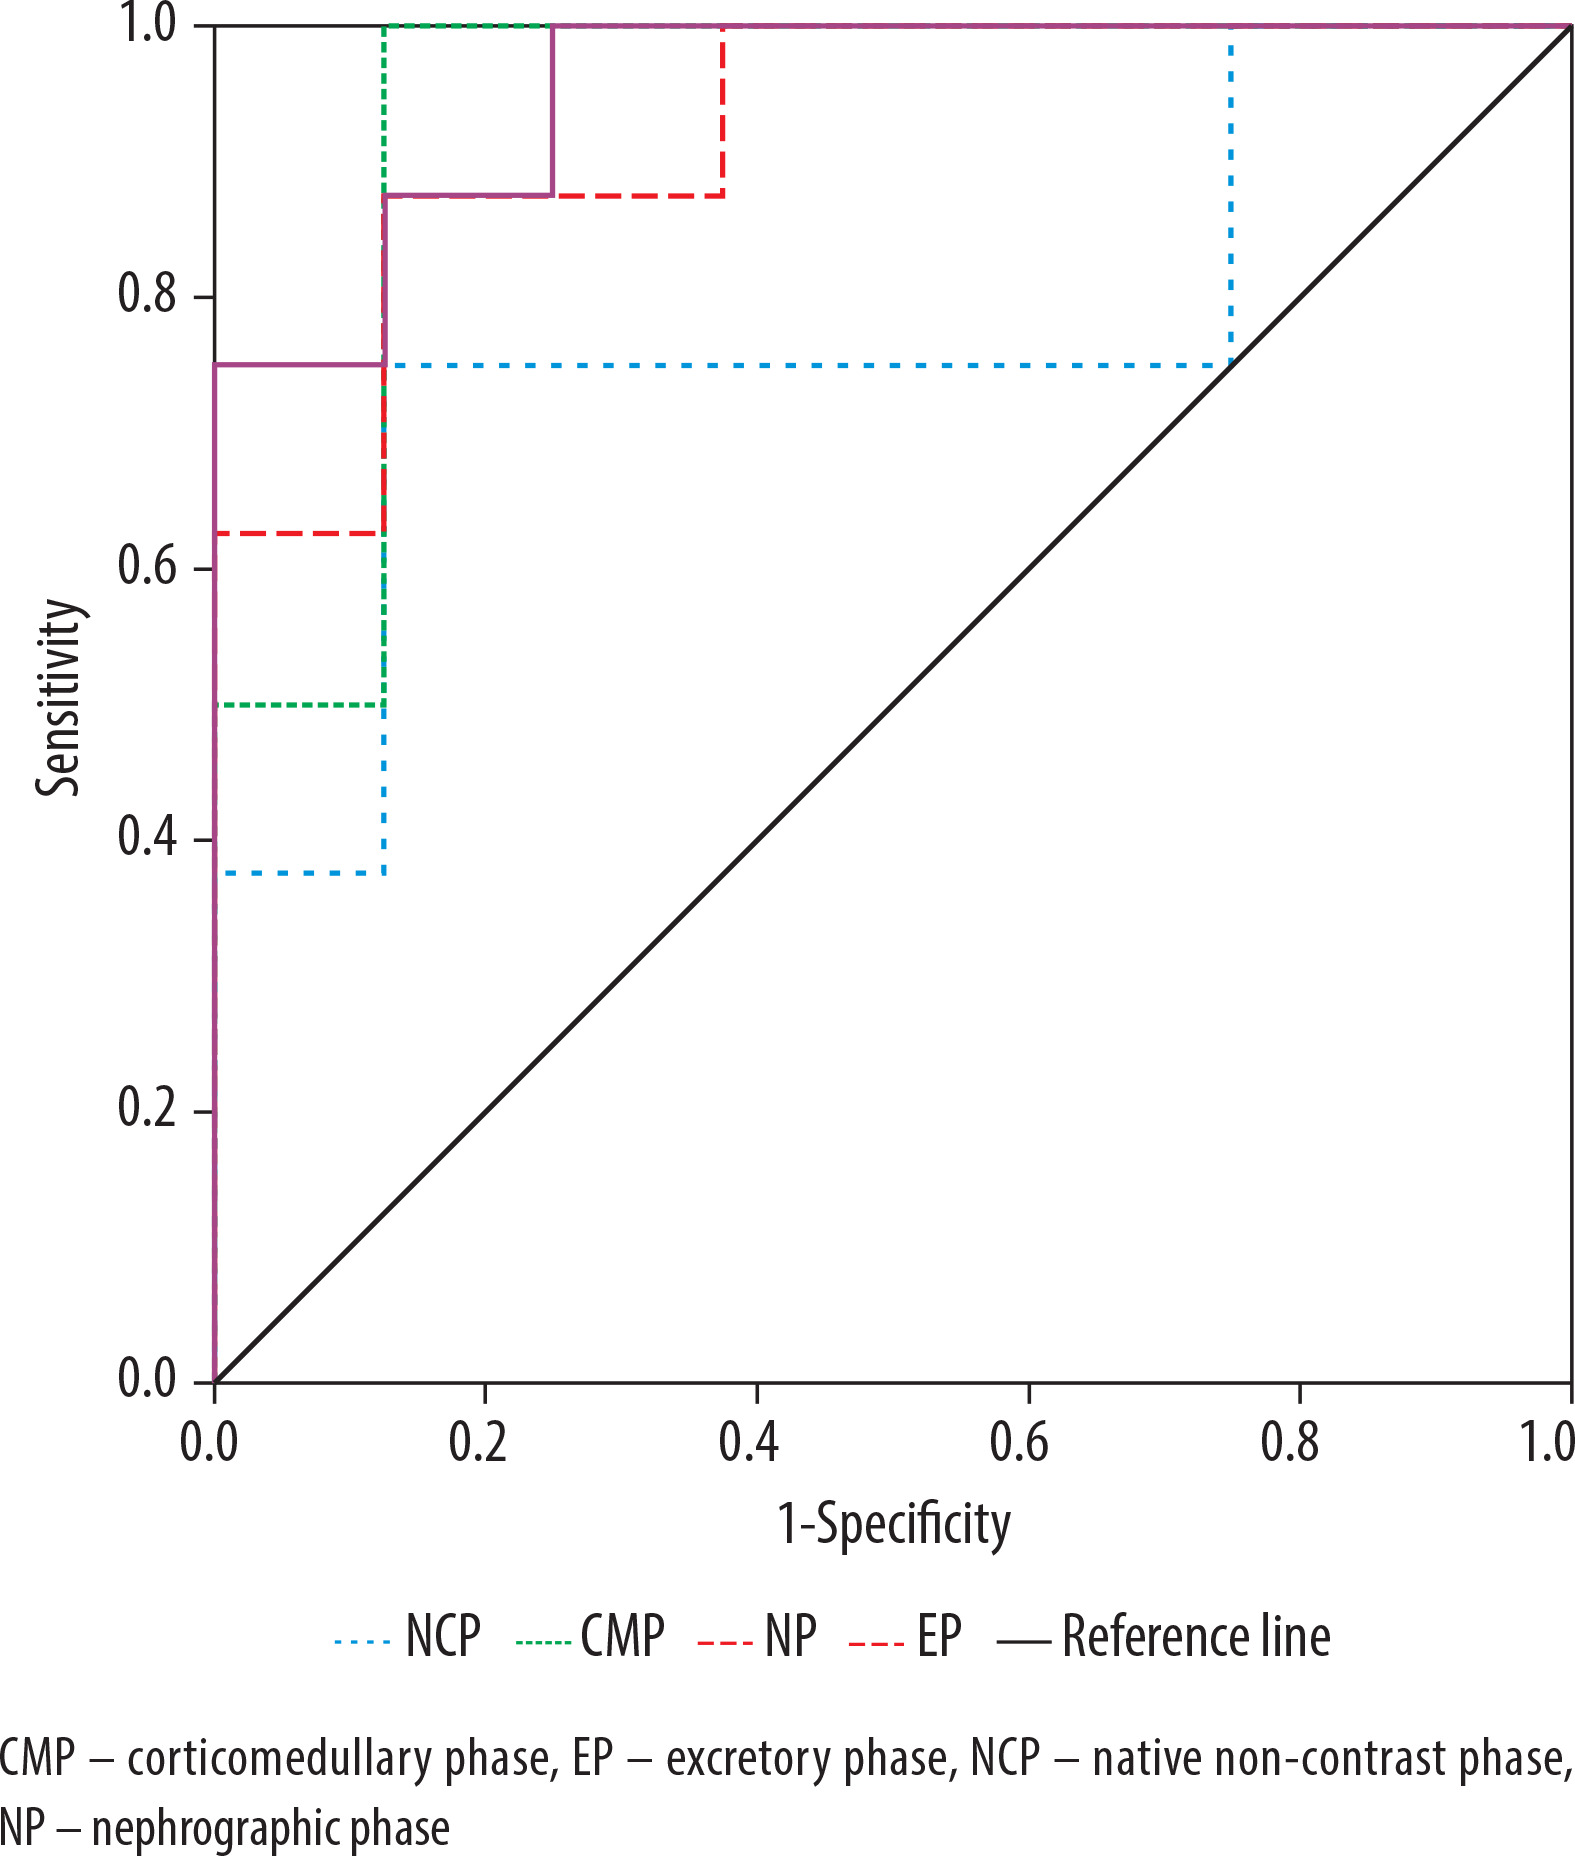
ROC analysis demonstrated that, among the CT-based imaging biomarkers, the renal lesion SI measured from the CT excretory phase was the most effective in differentiating RCC from other SRMs. At a threshold value of 52.29 HU, it achieved a sensitivity of 100%, a specificity of 61.3%, and an AUC of 0.848 (p < 0.001). The TCSI ratio did not show any advantage over SI in this context (Figure 3).
Figure 3
ROC curves for differentiating renal cell carcinoma from other small renal masses constructed based on tumour attenuation values
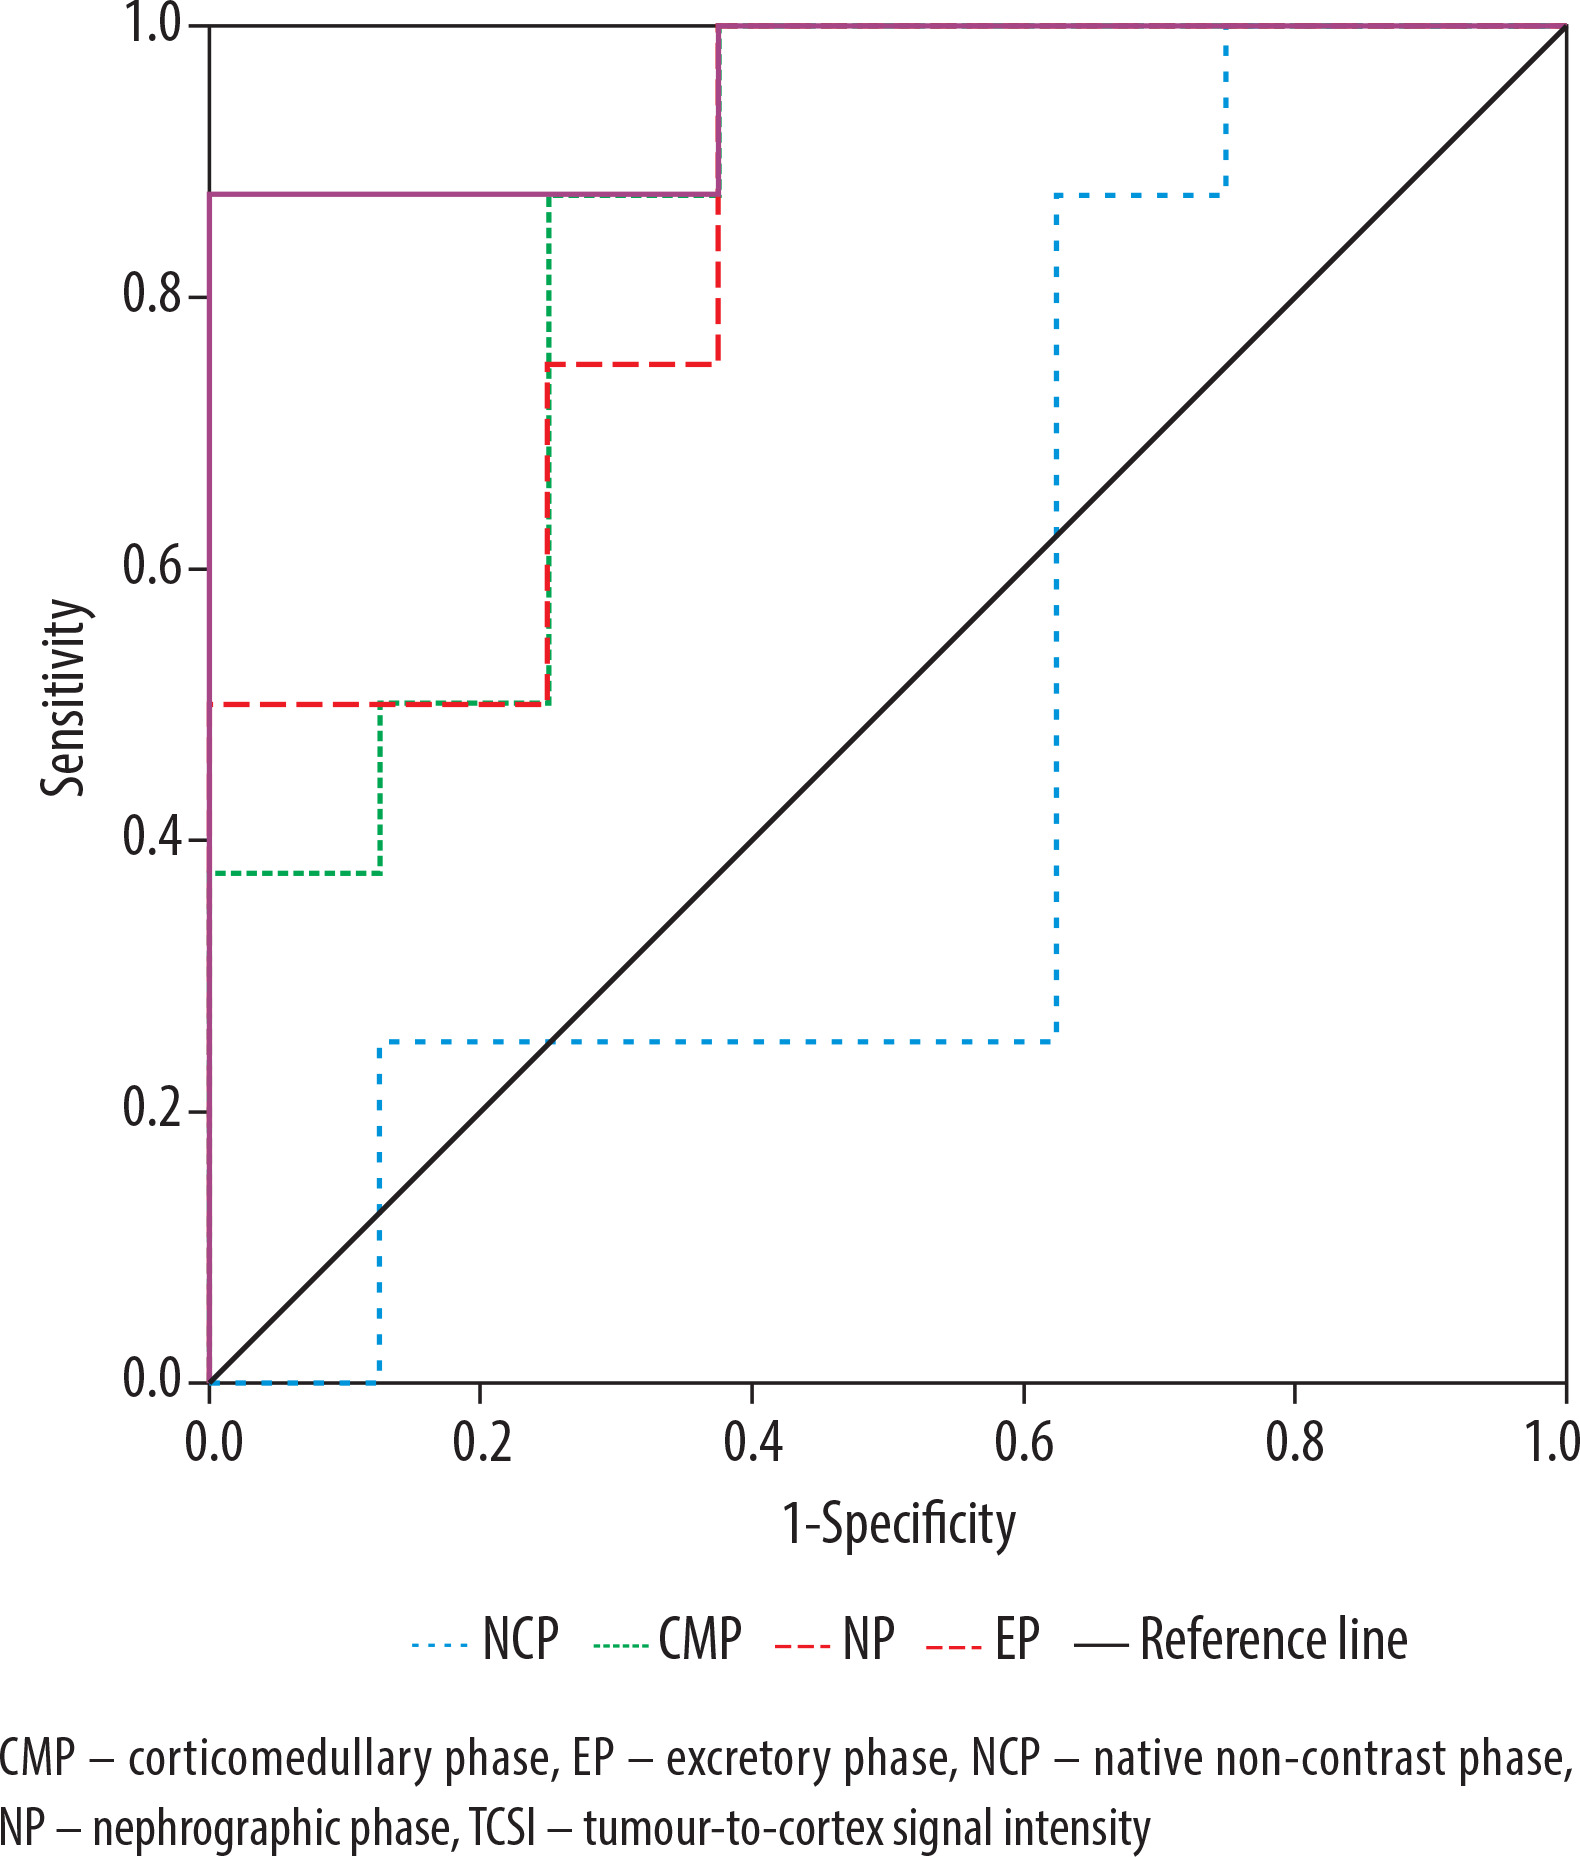
For distinguishing RCC from benign SRMs, the most effective parameter was the TCSI ratio obtained from CT excretory phase. With a threshold value of 0.63, it provided a sensitivity of 88.6%, a specificity of 52.4%, and an AUC of 0.763 (p < 0.001) (Figure 4).
Differentiating between solid renal cell carcinoma histologic subtypes
When comparing NCP CT images across RCC histological subtypes, ccRCC had significantly higher mean SI than pRCC (p = 0.044) and chRCC (p = 0.032). No significant difference was observed between pRCC and chRCC (p = 0.987). On CMP images, ccRCC exhibited the widest SI range, significantly differing from chRCC (p = 0.006) but not from pRCC (p = 0.641). pRCC and chRCC also showed significant differences (p = 0.004). The lower SI in chRCC may reflect reduced vascularity. In the NP, ccRCC had significantly higher mean SI compared to pRCC (p = 0.002). However, no significant differences were found between ccRCC and chRCC (p = 0.329) or between pRCC and chRCC (p = 0.220). In the EP, mean SI values showed no significant differences across RCC subtypes (p > 0.05) (Table 3).
Table 3
Mean signal intensity of small renal masses on computed tomography images across phases for clear cell, papillary, and chromophobe renal cell carcinoma
On NCP CT images, the highest mean TCSI ratio was observed in ccRCC and the lowest in chRCC, with no significant differences between subgroups (p > 0.05). On CMP images, pRCC had the highest mean TCSI ratio and chRCC the lowest. While no differences were found between ccRCC and pRCC (p = 0.465) or ccRCC and chRCC (p = 0.069), chRCC differed significantly from pRCC (p = 0.017). In the NP, ccRCC showed the highest mean TCSI ratio and pRCC the lowest, with no significant differences among subgroups (p > 0.05). On EP images, no significant differences in mean TCSI ratio were observed among ccRCC, pRCC, and chRCC (p > 0.05) (Table 4).
Table 4
Mean tumour-to-cortex signal intensity ratio on computed tomography images across phases for clear cell, papillary, and chromophobe renal cell carcinoma
Across all biomarkers, for SRMs, differentiating ccRCC from non-ccRCC was statistically reliable only using tumour SI from nephrographic phase CT images, with sensitivity 75.0%, specificity 51.6%, and AUC 0.725 (p = 0.001) at a threshold of 79.39 HU. The best differentiation of pRCC from chRCC was achieved during the CMP, with a tumour SI threshold of 90.57 HU, sensitivity 100%, specificity 66.7%, and AUC 0.933 (p < 0.001).
Differentiating solid renal cell carcinoma grades
On pre-contrast CT images, low-grade ccRCC had significantly higher SI compared to high-grade ccRCC (p < 0.001). No significant differences were observed between low- and high-grade pRCC (p = 0.996). Given the lack of prognostic relevance of ISUP grade in chRCC, SI analysis for this subtype is not included. During the CMP, low-grade ccRCC again showed significantly higher SI compared to high-grade ccRCC (p < 0.001), with no differences between pRCC grades (p = 0.908). In the NP, low-grade ccRCC exhibited higher SI than high-grade ccRCC (p < 0.001), while pRCC grades showed no differences (p = 0.976). In the EP, no significant differences were found between low- and high-grade ccRCC (p = 0.164) or between pRCC grades (p = 0.999).
No significant differences in mean TCSI ratios were observed on pre-contrast CT images between low- and high-grade ccRCC (p = 0.139) or pRCC subgroups (p = 0.243). On CMP images, ccRCC with low ISUP grade had significantly higher TCSI ratios than high-grade ccRCC (p < 0.001), while no differences were found between pRCC subgroups (p = 0.906). In the NP and EP phases, no significant differences in mean TCSI ratios were observed between ccRCC (p = 0.267 and p = 0.163, respectively) or pRCC subgroups (p = 0.485 and p = 0.998, respectively). Table 5 presents the mean SI and TCSI ratios across CT phases for conventional RCC with high and low ISUP grades.
Table 5
Mean SI and TCSI ratios on computed tomography images across phases for conventional renal cell carcinoma with high and low ISUP grades
For differentiating low- from high-grade conventional RCC in SRMs, the highest effectiveness was achieved using SI with a threshold of 89.67 HU measured during the nephrographic phase. This method demonstrated a sensitivity of 90.2%, specificity of 86.4%, and an AUC of 0.901 (p < 0.001) (Figures 5 and 6). None of the investigated CT-based imaging biomarkers provided sufficient accuracy or statistical significance for differentiating low- from high-grade papillary RCC in tumours ≤ 4 cm.
Figure 5
Multiphase CT findings of 57-year-old patient: axial projection revealed an exophytic SRM in the lower pole of the right kidney, measuring 3.90 × 3.84 × 3.81 cm. The ROI placed over the tumour. A) Corticomedullary phase: SI = 156.32 HU, TCSI ratio = 0.77. B) Nephrographic phase: SI = 94.32 HU, TCSI ratio = 0.75. C) Excretory phase: SI = 68.12 HU, TCSI ratio = 0.85. The patient underwent partial nephrectomy. Pathologic diagnosis: clear cell RCC, pT1aN0M0, ISUP grade III
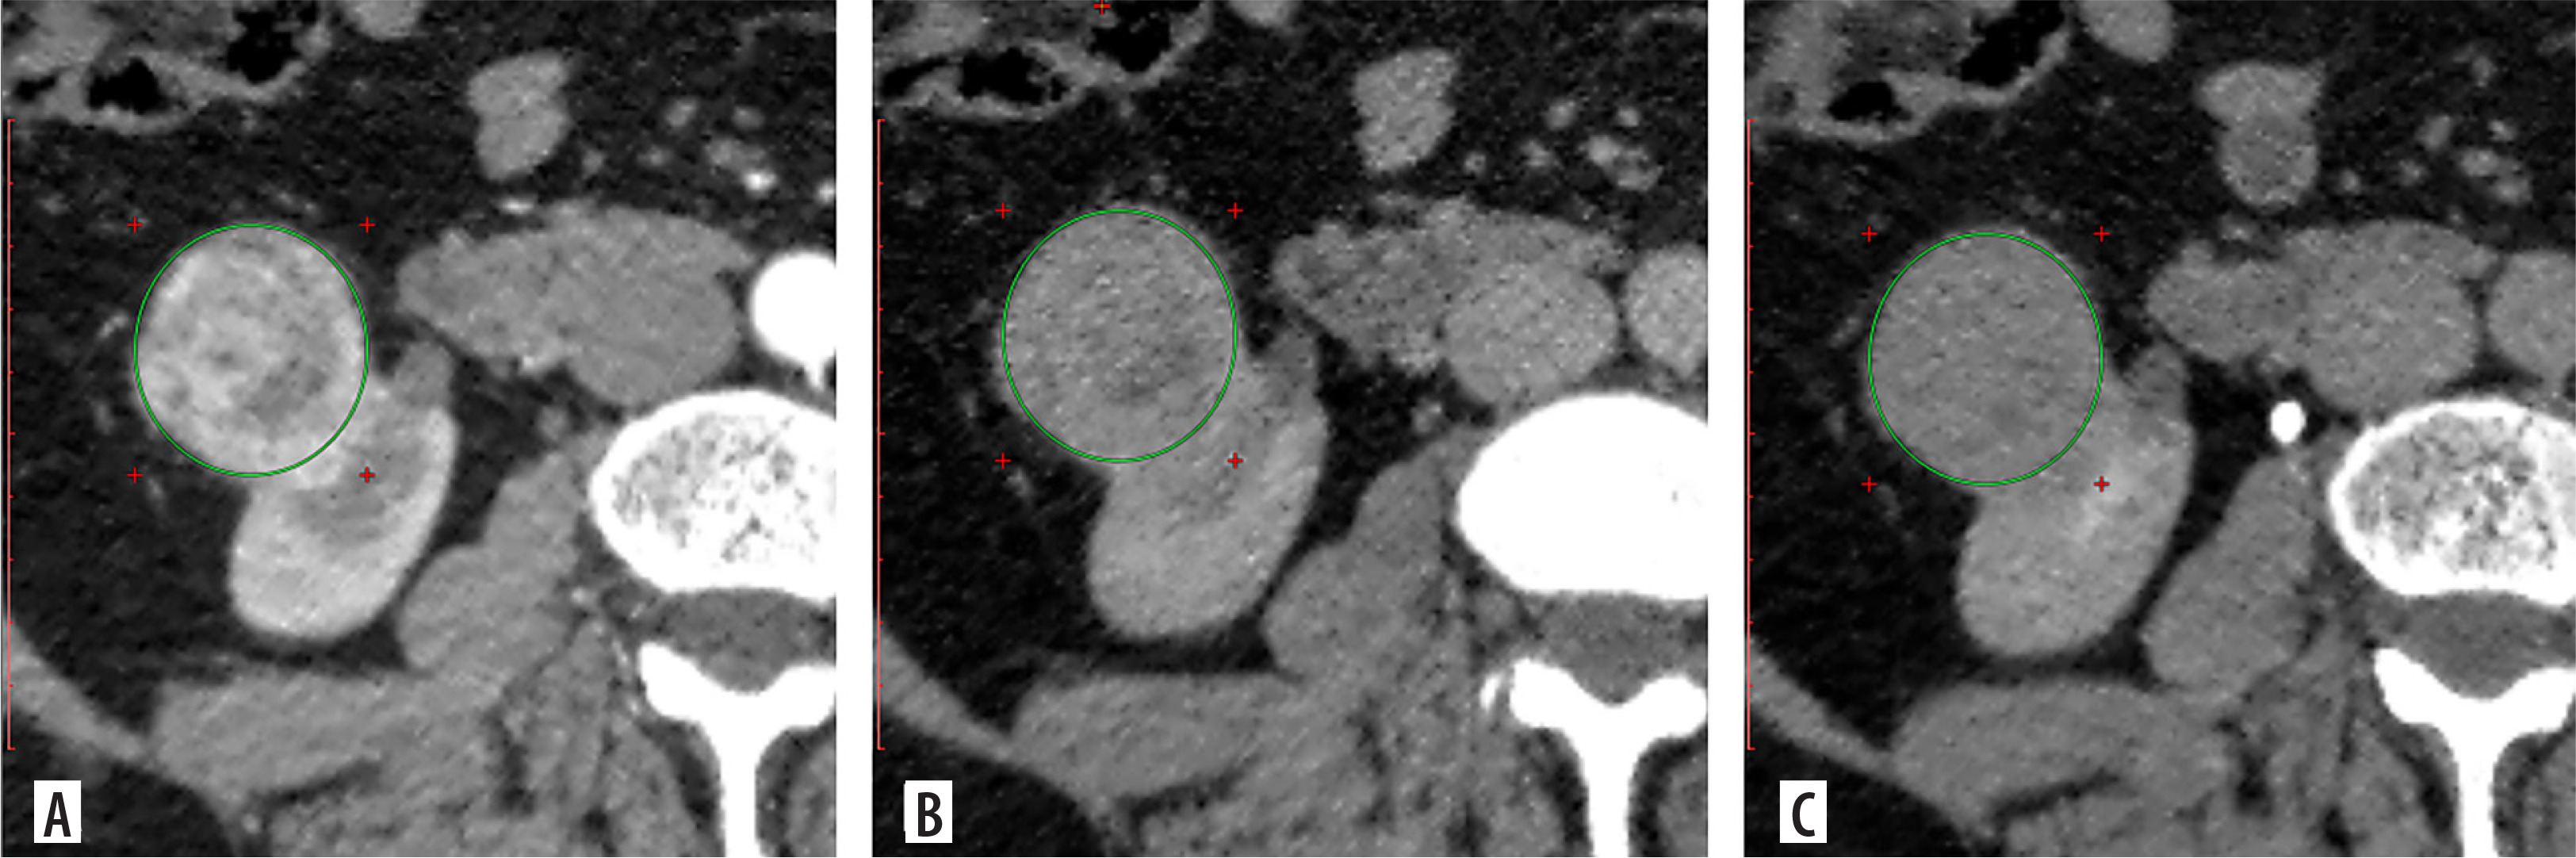
Figure 6
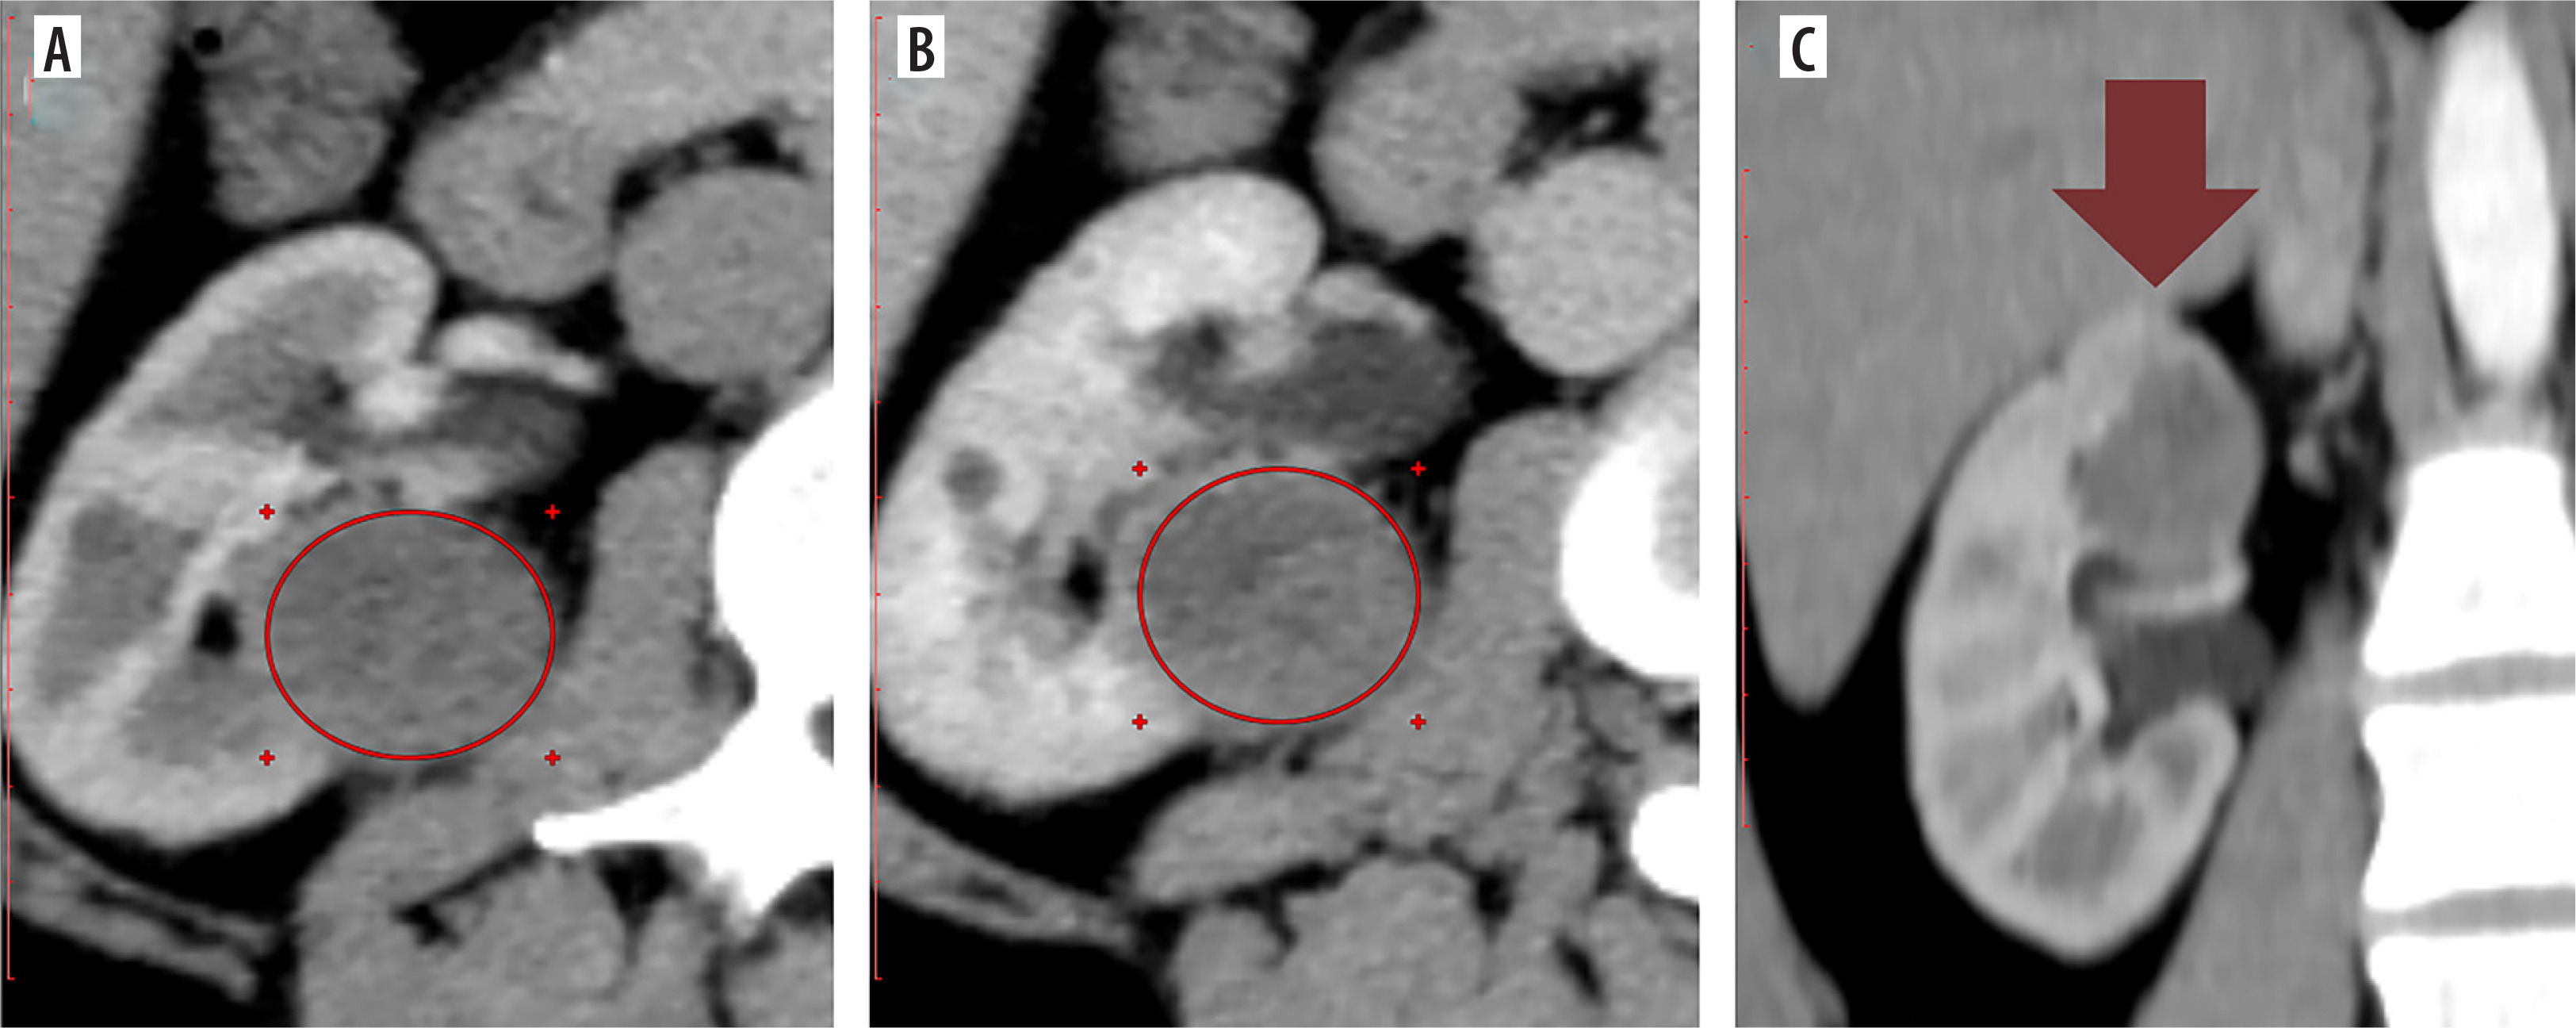
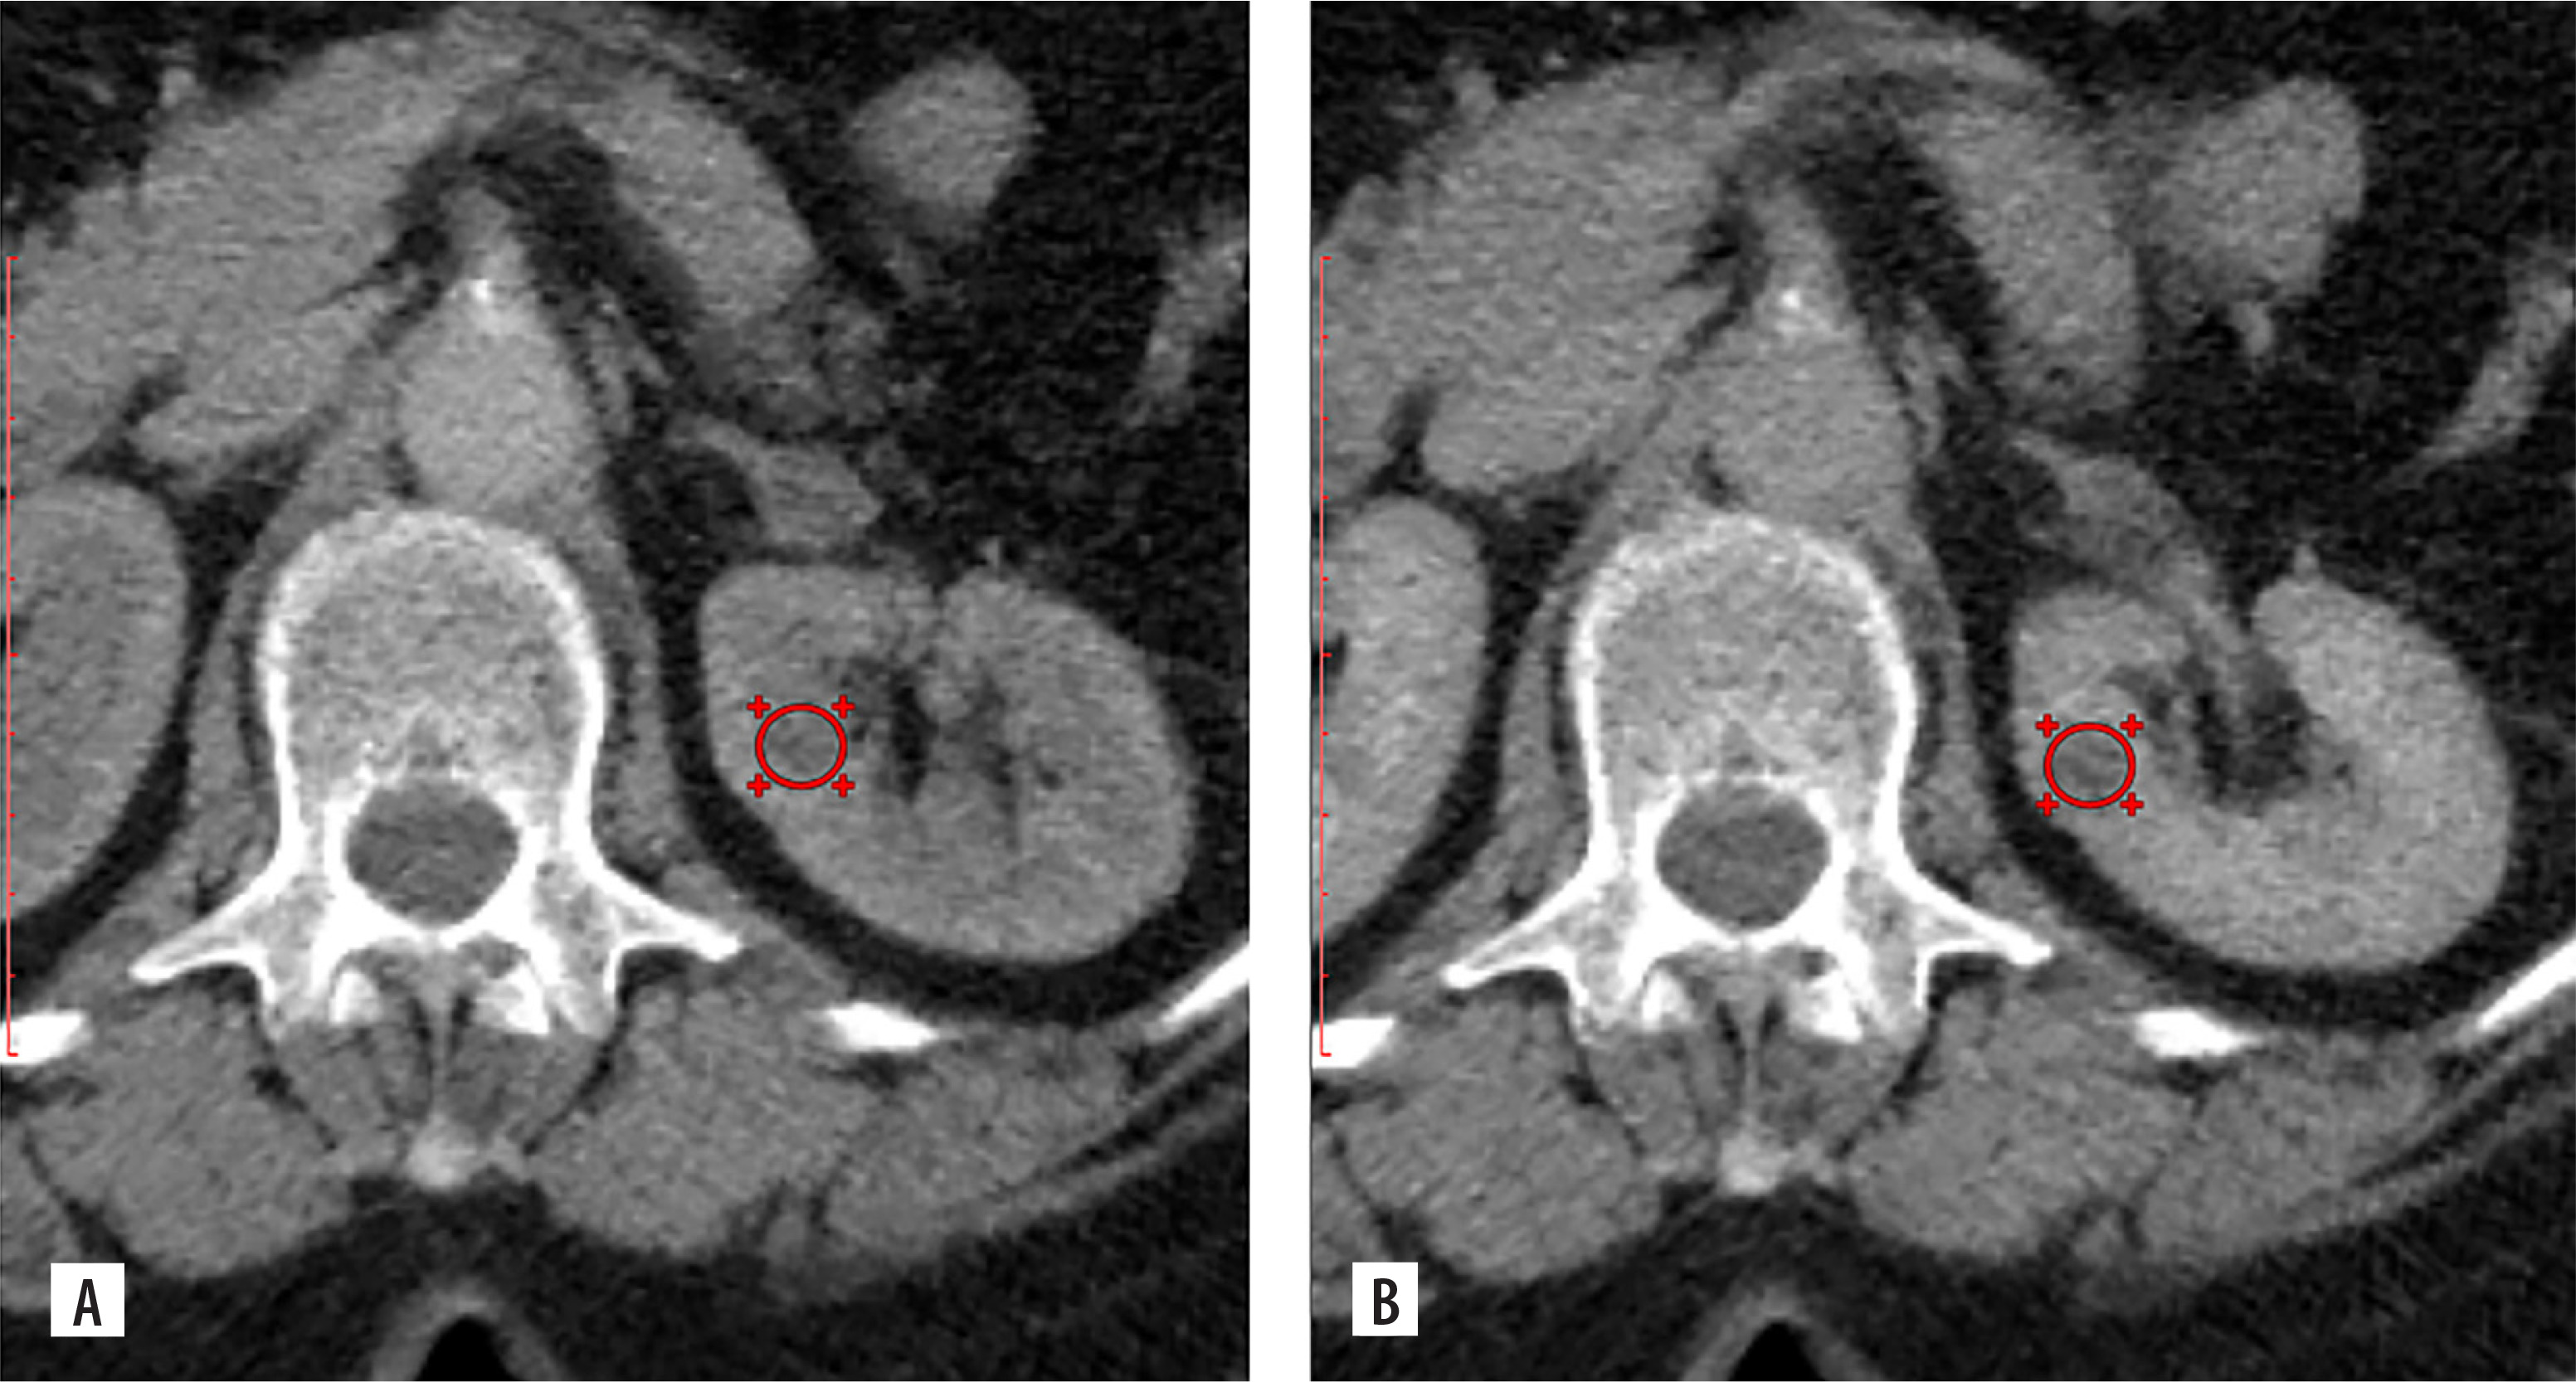
Multiphase CT findings of 64-year-old patient, presented with an SRM in the upper pole of the right kidney, measuring 2.84 × 2.66 × 2.64 cm. A) Axial corticomedullary phase: SI = 88.23 HU, TCSI ratio = 0.99. B) Axial nephrographic phase: SI = 69.12 HU, TCSI ratio = 0.71. C) Coronal corticomedullary phase – tumour indicated with an arrow. The patient underwent partial nephrectomy. Final diagnosis: papillary RCC (right kidney), pT1aN0M0, ISUP grade II
CT – computed tomography, HU – Hounsfield units, RCC – renal cell carcinoma, SI – signal intensity, SRM – small renal masses, TCSI – tumour-to-cortex signal intensity
Differentiating malignant from benign cystic small renal masses
The distribution of cystic SRMs according to the Bosniak classification was as follows: Bosniak I – 14 cases (22.2%), Bosniak II – 12 cases (19.0%), Bosniak IIF – 16 cases (25.4%), Bosniak III – 15 cases (23.8%), and Bosniak IV – 14 cases (22.2%). According to CT measurements, the mean size of all cystic SRMs was 3.53 ± 0.41 cm. The mean tumour size was 3.15 ± 0.83 cm (range: 2.0-3.98 cm) in RCC patients and 3.31 ± 0.67 cm (range: 1.55-3.97 cm) in patients with benign cysts. No significant differences in the size of cystic SRMs were found among subgroups of different Bosniak categories or between benign and malignant pathology (p > 0.05).
The analysis of SI values for cystic SRMs showed that Bosniak class I and II cysts had the lowest SI values, while class IV cysts exhibited the highest SI values. No significant differences in mean SI values were found between class I and II cysts across any CT phase (p > 0.05). The corticomedullary phase was the only phase that enabled statistically significant differentiation among all other cyst classes. In this phase, class I cysts had the lowest mean SI (11.34 ± 2.69), and class IV cysts had the highest mean SI (119.38 ± 13.21). Significant differences were observed between class II and IIF cysts (p = 0.004) and among all other classes (p < 0.001), as shown in Table 6.
Table 6
Mean signal intensity values of cystic small renal masses across computed tomography phases
The analysis of the TCSI ratio for cystic SRMs across the studied groups showed that the lowest values were associated with Bosniak I and II cysts, while the highest were observed in Bosniak IV cysts. Similarly to SI, no significant differences in mean TCSI values were identified between Bosniak I and II cysts across any CT phase (p > 0.05). However, significant differences in mean TCSI values were found among all other cyst groups (p < 0.001), as shown in Table 7.
Table 7
Mean tumour-to-cortex signal intensity ratio values for cystic small renal masses on computed tomography images across phases
Bosniak IIF cystic small renal masses
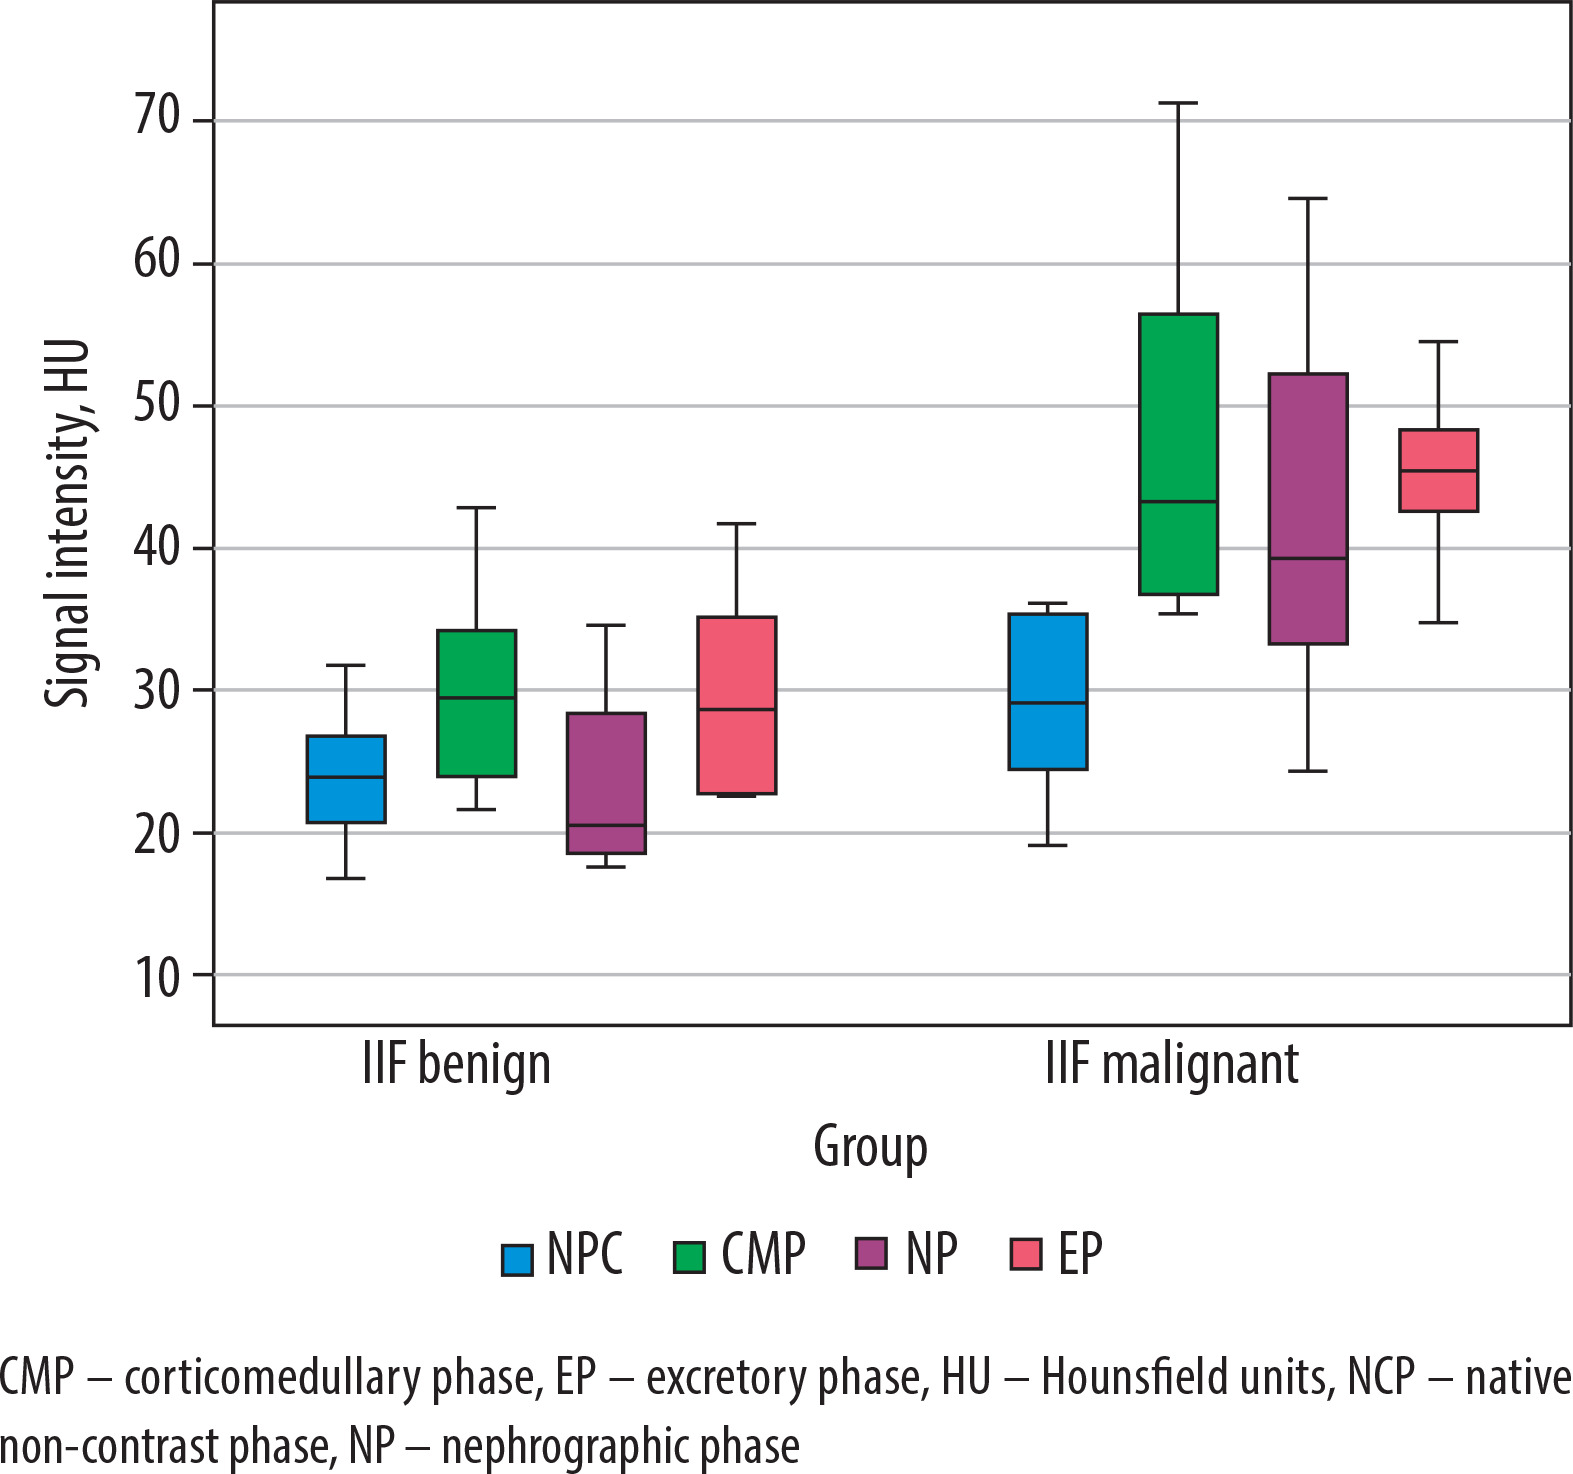
An analysis of mean SI differences between benign (n = 8) and malignant (n = 8) Bosniak IIF cysts across all CT phases showed that benign cysts consistently exhibited lower SI values compared to malignant ones. While no significant differences were found on pre-contrast CT images (p = 0.089), statistically significant differences were observed during the corticomedullary phase (p = 0.006), nephrographic phase (p = 0.003), and excretory phase (p = 0.04), despite the relatively small sample sizes (Table 8, Figure 7).
Table 8
Statistical analysis of signal intensity values for benign and malignant Bosniak IIF cysts across computed tomography phases
Figure 7
Box plot of signal intensity values for benign and malignant Bosniak IIF cysts across computed tomography phases
An analysis of the TCSI ratio for benign and malignant Bosniak IIF cysts demonstrated significant differences in mean values on CT images during the CMP (p = 0.021) and the EP (p = 0.001) (Table 9, Figure 8).
Table 9
Statistical characteristics of tumour-to-cortex signal intensity ratio for small renal masses in benign and malignant Bosniak IIF cysts across computed tomography phases
Figure 8
Box plot of TCSI ratio values for benign and malignant Bosniak IIF cysts across different computed tomography phases
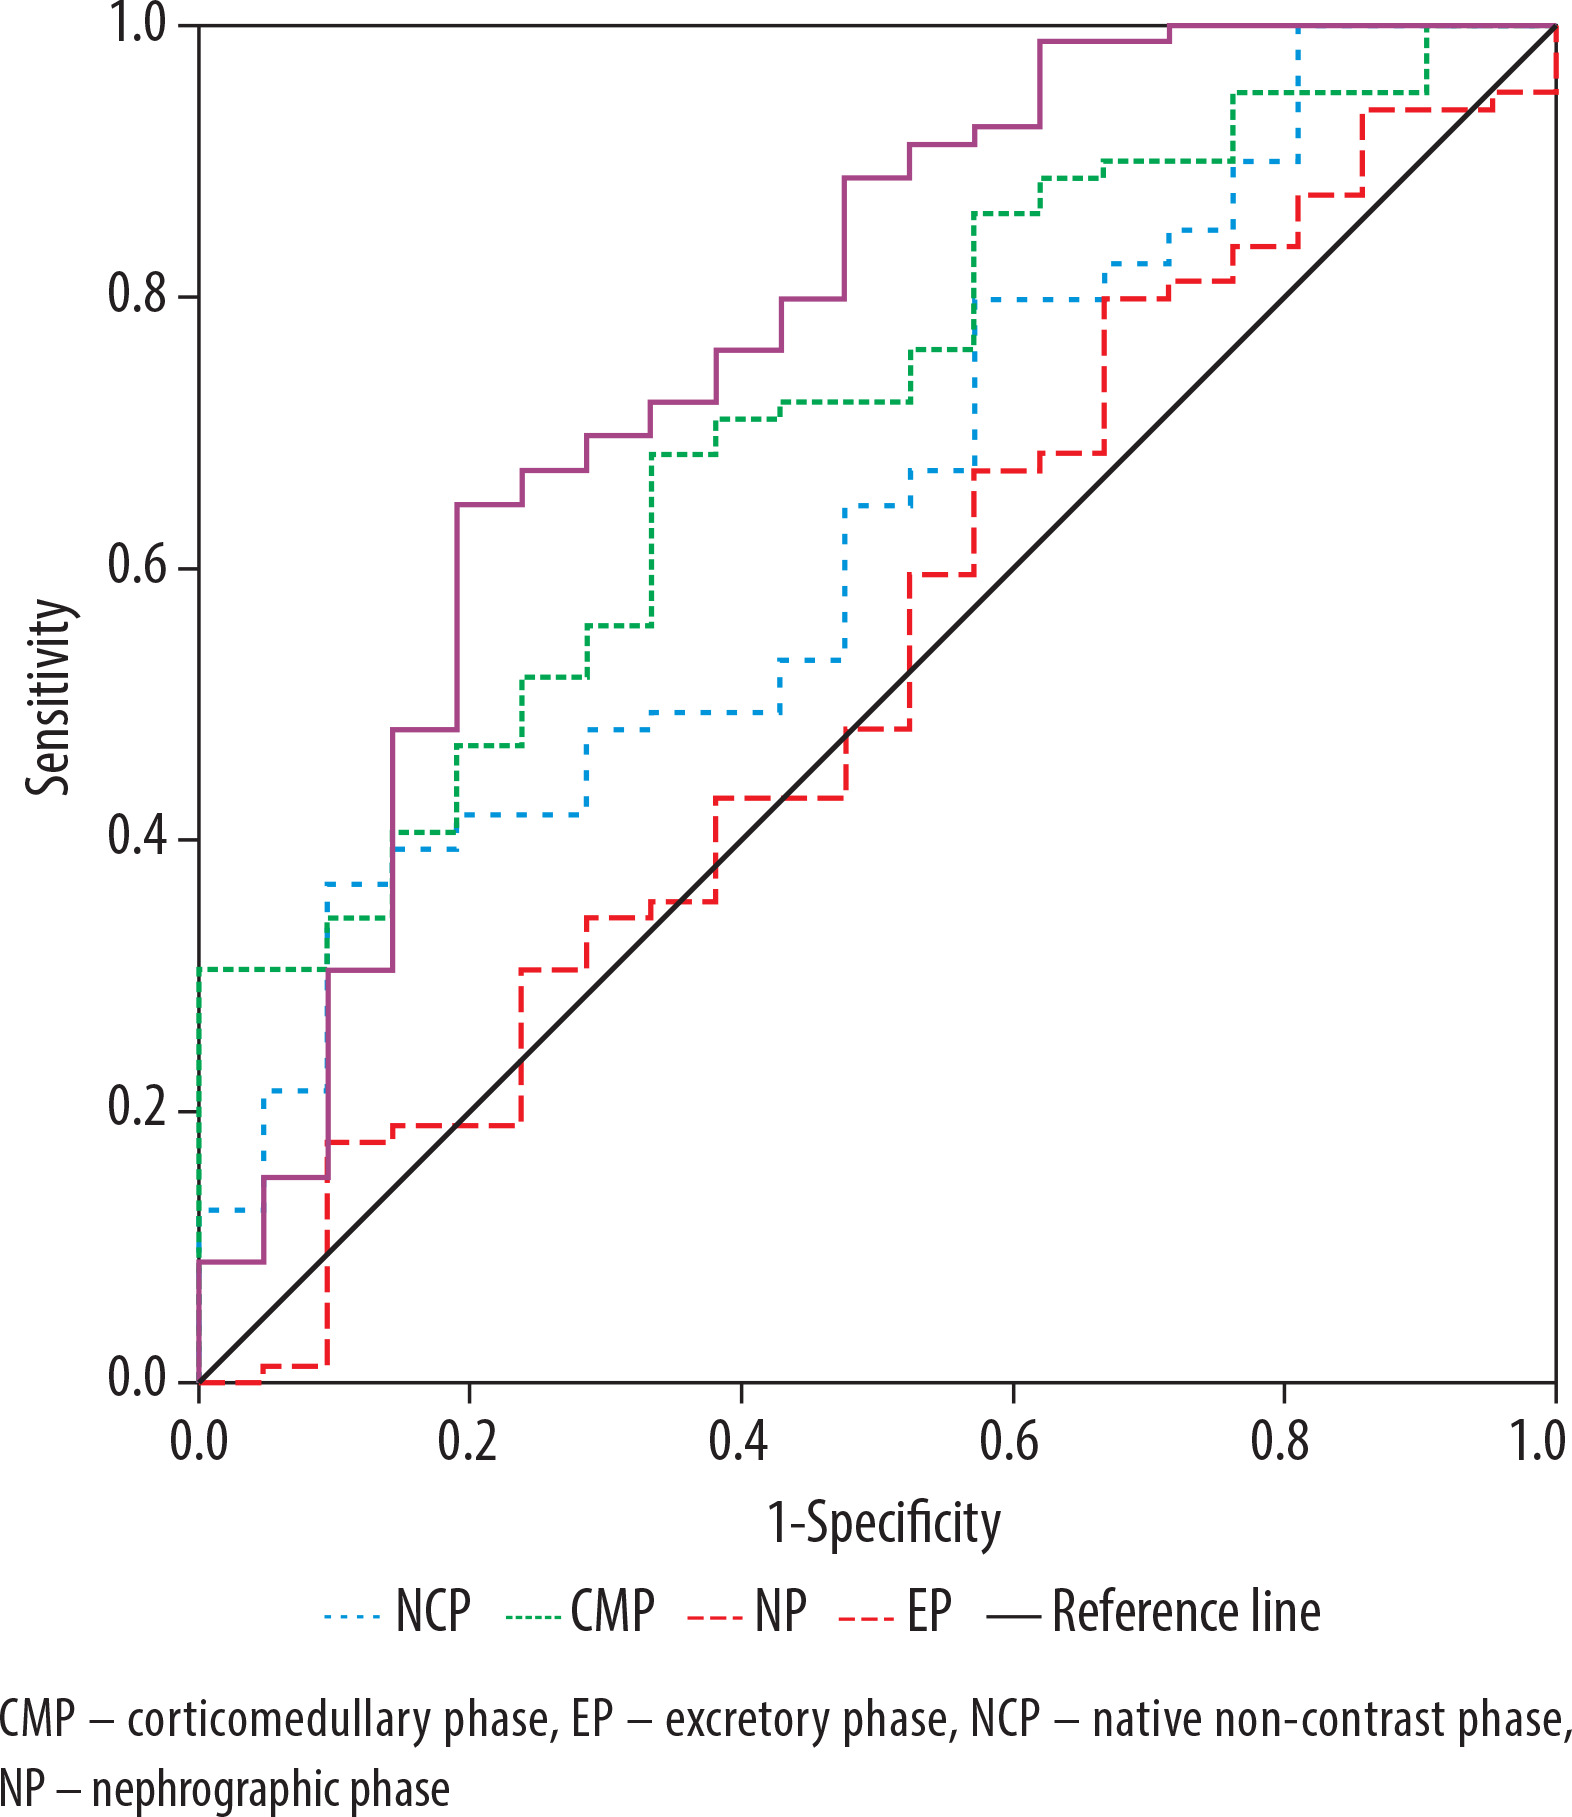
ROC analysis revealed that the highest diagnostic performance for differentiating benign and malignant Bosniak IIF cysts using SI was achieved with CMP images, demonstrating 93% sensitivity, 87.5% specificity, and an AUC of 0.902 (95% CI: 0.808-0.998, p = 0.003) at a threshold of 34.81 HU. Notably, when using the TCSI ratio for the same purpose, the best results were obtained with EP images, showing 87.5% sensitivity, 100% specificity, and an AUC of 0.953 (95% CI: 0.850-1.0, p = 0.002) at a threshold of 0.40 (Figures 9 and 10).
Bosniak III and IV cystic small renal masses
The SI and TCSI ratio of tissue components in benign and malignant Bosniak category III and IV cysts were analysed, with groups combined by benign or malignant status to increase the sample size of benign cysts. A significant difference in mean SI was identified only on EP of CT images, with benign cysts showing a mean SI of 60.11 ± 14.76 HU and malignant cysts 76.53 ± 11.13 HU (p = 0.019, t = 2.496). On CMP images, the mean SI of malignant cyst tissue components in Bosniak III and IV categories was similar to that of solid RCC, at 104.48 ± 28.03 HU and 107.22 ± 23.34 HU, respectively. In comparison, the mean SI of benign cyst tissue components in the same categories resembled that of solid benign renal tumours, at 85.61 ± 33.56 HU and 85.45 ± 20.12 HU, respectively. No significant differences were observed in TCSI ratios between malignant and benign cysts in these categories (p > 0.05). A threshold SI value of 59.77 HU for the tissue component of Bosniak III and IV cysts allowed differentiation of malignant cystic SRMs from benign ones, with a sensitivity of 88.1% and specificity of 60% (AUC = 0.763, 95% CI: 0.487-0.997, p = 0.048).
Additionally, no significant differences were found in SI values or tumour-to-cortex SI ratios between low- and high-grade cystic RCC based on ISUP grading (p > 0.05).
Figures 11 and 12 present examples of measuring CT imaging biomarkers in cystic SRMs.
Figure 11
CT data of 41-year-old patient, axial projection, diagnosis: simple cyst in the upper segment of the right kidney measuring 2.40 × 2.25 × 2.23 cm, Bosniak class I, with the ROI placed over the lesion. A) Pre-contrast image, SI = 5.45 HU, TCSI = 0.20. B) Corticomedullary phase, SI = 10.23 HU, TCSI = 0.10. C) Nephrographic phase, SI = 9.11 HU, TCSI = 0.11. D) Excretory phase, SI = 9.05 HU, TCSI = 0.11
CT – computed tomography, HU – Hounsfield units, ROI – region of interest, SI – signal intensity, TCSI – tumour-to-cortex signal intensity
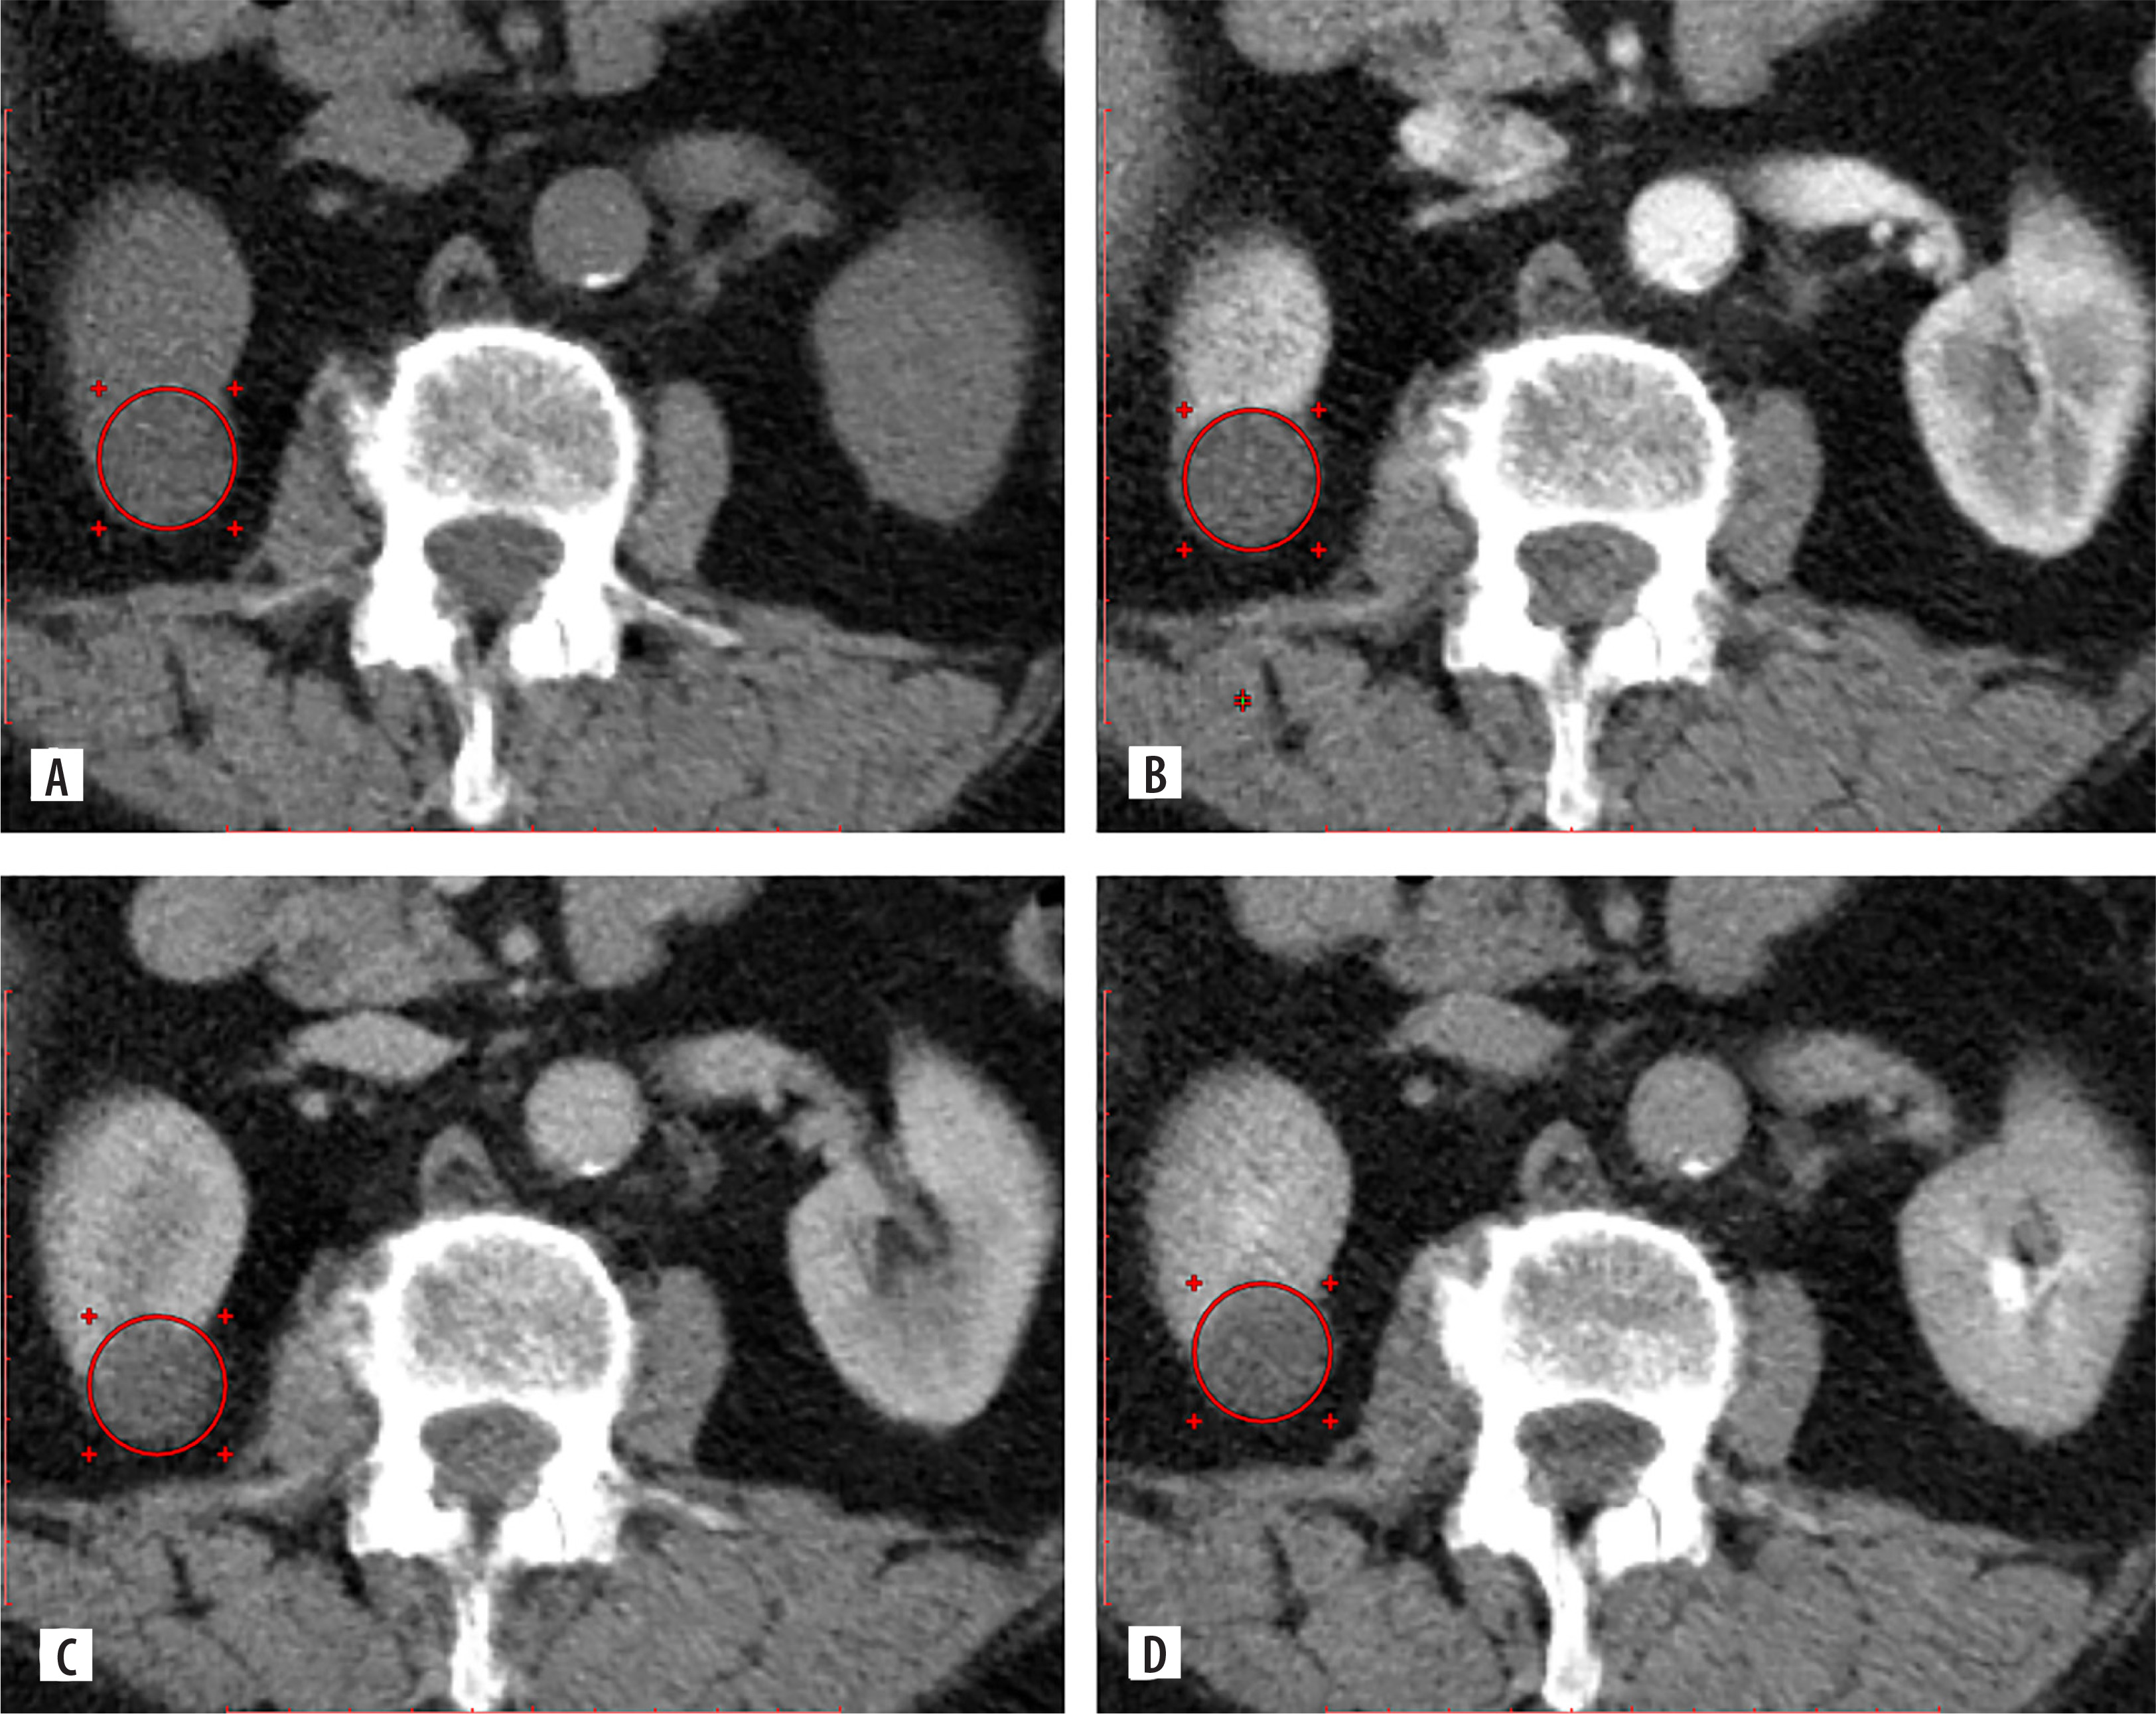
Figure 12
CT data of 53-year-old patient, diagnosis: Bosniak class IIF in the lower anterior segment of the left kidney measuring 1.55 × 1.56 × 1.56 cm, with the ROI placed over the lesion. No signs of malignancy were detected during a one-year follow-up. A) Corticomedullary phase, SI = 29.11 HU, TCSI = 0.25. B) Nephrographic phase, SI = 25.56 HU, TCSI = 0.22
CT – computed tomography, HU – Hounsfield units, ROI – region of interest, SI – signal intensity, TCSI – tumour-to-cortex signal intensity
Discussion
Differentiating SRMs by malignancy, histological subtype, and grade is essential for clinical management. Despite advancements in imaging, radiomics, and machine learning, SRM diagnosis remains unresolved. Our previous work highlights MRI-based markers’ potential to predict renal lesion malignancy, RCC subtype, grade, recurrence, and treatment response, especially in SRMs [17-20]. The current study underscores the utility of MCECT-derived imaging biomarkers, particularly SI and the TCSI ratio, for the differentiation of SRMs.
It was shown by our data that excretory phase-derived SI and TCSI ratio thresholds effectively differentiate solid RCC from benign SRMs, achieving an AUC of 0.848. This finding is aligned with studies emphasising the excretory phase for assessing tumour vascularity, such as that by Ren et al. [11], in which an AUC of 0.79 was reported for distinguishing oncocytomas from RCC. A broader SRM range and higher AUC and sensitivity were achieved in our study, probably due to the use of multiphase imaging and a larger sample size, reinforcing the role of the excretory phase in tumour vascularity assessment. Moreover, limited advantages of the TCSI ratio over SI alone for differentiating RCC from benign SRMs were demonstrated. This observation is consistent with findings from Dhyani et al. [13], who reported mixed utility of relative enhancement ratios in differentiating oncocytomas from RCC, achieving an AUC of 0.76 for the aorta-lesion attenuation difference method.
The potential of advanced techniques such as radiomics, corticomedullary-phase ratios, and deep learning for solid SRM characterisation has been highlighted in recent studies, achieving AUCs of 0.77-0.90 [21-24]. In contrast, our study focuses on simpler, accessible SI and TCSI ratios across all CT phases, extending the analysis to cystic SRMs. This approach balances diagnostic accuracy with clinical practicality, addressing a broader spectrum of lesions while avoiding the complexity of advanced algorithms.
Unlike most studies, our research analysed both solid and cystic SRMs. The corticomedullary phase was found to be the most effective in differentiating benign and malignant Bosniak IIF cysts, with an AUC of 0.902 for SI. Significant differences were also observed in tissue-specific SI measurements for Bosniak III and IV cysts, particularly in the excretory phase, achieving an AUC of 0.763. While recent studies using CT texture-based machine learning and DWI integration reported comparable AUCs (0.88-0.973) [25,26], our study emphasises simpler, clinically applicable SI and TCSI ratio.
Histologic subtyping of RCC is critical because subtypes of RCC differ significantly in prognosis and treatment response. Significant SI differences across subtypes were identified in the corticomedullary and nephrographic phases, with ccRCC showing the highest mean SI values. Similar findings were reported by Sasaguri et al. [2,3], who demonstrated diagnostic utility for biphasic CT enhancement patterns, achieving an AUC of 0.83 for distinguishing ccRCC from non-ccRCC. Although fewer imaging phases were used in their study, higher sensitivity and specificity were achieved in this study, particularly for pRCC and chRCC, through a multiphase approach. These results underscore the potential for multiphase CT biomarkers to serve as non-invasive surrogates for histopathological grading.
Differentiation of low- versus high-grade ccRCC in this study was achieved using nephrographic phase SI, with an AUC of 0.901. In comparison, higher AUCs were reported by Kocak et al. [14] (AUC 0.92) using unenhanced CT texture analysis with machine learning, while more recent radiomics-based approaches for ccRCC nuclear grading achieved slightly lower AUCs of 0.828-0.887 despite employing advanced methodologies [27]. Although these methods utilise advanced computational tools, our approach provides comparable accuracy with greater clinical applicability, serving as a solid foundation for future integration with radiomics and machine learning frameworks.
This study has some limitations. First, its retrospective design limits the ability to establish causal relationships, and prospective validation would strengthen the findings. Second, while the overall sample size is substantial, certain subgroups, such as Bosniak III/IV lesions, are relatively small; expanding these subgroups in future studies would enhance statistical power. Third, UTUC grading data were not included, which limits a more comprehensive assessment of these lesions. Future research incorporating this aspect could provide additional insights.
Conclusion
MCECT-based imaging markers, such as SI and the TCSI ratio, provide effective non-invasive tools for differentiating benign and malignant solid and cystic SRMs, while also aiding in subtype identification and tumour grading in solid lesions. Future studies should focus on validating these findings in larger and more diverse populations.