

Introduction
Left ventricular (LV) diastolic dysfunction (DD), characterised by impaired myocardial relaxation and elevated filling pressures, is frequently accompanied by compensatory remodeling of the left atrium (LA), which serves as both a pressure buffer and functional reservoir [1,2]. Transthoracic echocardiography (TTE) remains the reference standard for DD assessment; however, recent advances in coronary computed tomography angiography (CCTA) have enabled acquisition of volumetric and functional cardiac data, expanding its role beyond coronary evaluation [3–5].
While CCTA has high sensitivity for ruling out obstructive coronary artery disease (CAD), its diagnostic potential for functional myocardial assessment is increasingly recognised. Multiphase reconstructions allow evaluation of chamber volumes, ejection fractions, and myocardial density changes throughout the cardiac cycle. Quantitative analysis of rest-phase myocardial attenuation offers a surrogate of myocardial perfusion, particularly when hypodense regions, defined by Hounsfield unit (HU) thresholds are systematically quantified [6,7].
Emerging evidence indicates that myocardial hypodensity on CCTA may correspond to microvascular dysfunction, interstitial expansion, or delayed contrast equilibration rather than overt ischaemia, reflecting diffuse tissue-level alterations seen in early DD or heart failure with preserved ejection fraction (HFpEF) phenotypes [8–10]. However, its relationship with established functional markers such as LA ejection fraction (LAEF) or echocardiographic DD grading remains poorly characterised. Furthermore, prior CCTA-based perfusion studies have mainly focused on acute or stress conditions, whereas quantitative rest-phase hypodensity mapping in routine CCTA workflows remains underexplored [8–10].
Therefore, this study aimed to determine whether the percentage of myocardial hypodensity, measured via semi-automated perfusion mapping on routine retrospectively ECG-gated CCTA correlates with echocardiographic DD grades and with CCTA-derived LAEF and LV functional indices. We hypothesised that increased hypodensity would be associated with reduced LAEF and progressive DD severity, supporting the role of integrated perfusion and atrial metrics for early diastolic assessment in standard CCTA examinations.
Material and methods
Patient population and study design
A total of 156 patients who underwent CCTA between June 2022 and May 2024 for known or suspected coronary artery disease (CAD) were retrospectively evaluated. The study protocol was approved by the institutional review board (approval date/No: 19.09.2024/254438841), and written informed consent was obtained from all participants in accordance with institutional and ethical regulations.
Inclusion criteria consisted of age > 18 years, sinus rhythm, and availability of comprehensive TTE within one week of CCTA. Exclusion criteria included history of coronary artery bypass grafting, coronary stent placement, arrhythmia, or non-diagnostic CCTA image quality. Clinical variables (hypertension, diabetes mellitus, body mass index [BMI]) were extracted from electronic medical records.
CCTA acquisition protocol
CCTA examinations were performed using a 128-slice CT scanner (GE Optima CT660) with retrospective ECG-gated acquisition. Scan parameters included 100-120 kVp, automatic tube current modulation, and 0.6-mm slice thickness reconstructed with a standard cardiac kernel. Iodinated contrast material (350 mg I/ml) was administered intravenously at 4-5 ml/s (1-1.3 ml/kg), followed by saline flush. Multiphase reconstructions were generated at 0-90% of the R-R interval at 10% increments.
Echocardiographic evaluation
Transthoracic echocardiography results were retrospectively retrieved from the institutional digital archive for all included patients. Examinations were performed according to current American Society of Echocardiography and the European Association of Cardiovascular Imaging (ASE/EACVI) recommendations for diastolic function assessment [5].
Diastolic dysfunction grading was based on the E/A ratio, deceleration time, and supportive parameters when available (e.g. E/e’ ratio, left atrial volume index).
Patients were categorised as having normal diastolic function or grade 1-2 DD, accordingly.
Echocardiographic data were used for correlation analysis with CCTA-derived functional indices, including LAEF and myocardial hypodensity percentage.
Coronary artery disease and risk stratification
Coronary artery disease severity was classified using the CAD-RADS 2.0 reporting system based on the extent of luminal stenosis on CCTA [11]. Patients were stratified into CAD-RADS ≤ 1 (none to minimal disease) and CAD-RADS > 1 (non-obstructive to obstructive CAD) categories for subgroup comparison.
Cardiovascular risk burden was assessed using the SMART risk score, calculated from clinical variables including age, sex, lipid profile, blood pressure status, smoking history, and presence of diabetes mellitus. Higher SMART scores indicated greater systemic atherosclerotic risk.
Image analysis
Left atrium maximum and minimum volumes (LAVmax and LAVmin) were measured using multiphasic datasets, from which LAEF was derived: LAEF = (LAVmax – LAVmin)/ LAVmax × 100.
Left ventricle end-diastolic volume (LVEDV), end-systolic volume (LVESV), and ejection fraction (LVEF) were also recorded.
Myocardial hypodensity was assessed using a semi-automated attenuation map generated for each patient based on individual myocardial intensity distribution. Rather than applying a fixed HU threshold, hypodense regions were identified relative to the patient-specific mean and standard deviation of myocardial attenuation, enabling adaptive classification of low-density tissue.
For reference and validation, the distribution of myocardial attenuation in the study population was compared to published fixed thresholds (typically < 46 HU) previously associated with resting hypoperfusion on CCTA. In our dataset, this value corresponded approximately to the lower 5th percentile of normalised myocardial intensity, confirming consistency with prior literature [6,7].
Cardiac VX software was used to segment the left ventricular myocardium and quantify the hypodense fraction as a percentage of the total myocardial volume. This approach accounts for inter-patient variation in contrast enhancement and scanning parameters.
Myocardial segmentation and volumetric analysis were performed using Cardiac VX software. Two radiologists (with 5 and 10 years of experience) performed the measurements independently. Interobserver reproducibility was assessed using intraclass correlation coefficients (ICC).
Statistical analysis
Continuous variables were tested for normality and compared using the independent samples t-test or Mann-Whitney U test. Categorical variables were compared with the c2 test. Correlation analyses were performed using Pearson or Spearman coefficients, as appropriate. A cut-off value for LAEF was calculated based on the distribution of LAEF values within the study cohort. This threshold provided the optimal sensitivity and specificity for identifying individuals with increased myocardial hypodensity. Therefore, it was used as a data-driven indicator of impaired atrial function.
Multivariate linear regression models were constructed to adjust for age, sex, BMI, and hypertension. Bonferroni correction was applied for multiple comparisons. Analyses were performed with NCSS 2007; p-values < 0.05 were considered significant.
Results
A total of 156 patients (86 men, 70 women; mean age 47.9 ± 11.4 years) were included. Hypertension was present in 45%, diabetes in 19%, and BMI > 25 kg/m2 in 58% of patients. The mean heart rate during CCTA was 65 bpm. Baseline clinical characteristics are summarised in Table 1.
Table 1
Baseline characteristics
| Variable | Data |
|---|---|
| Age (years), mean ± SD | 47.9 ± 11.4 |
| Gender (female/male), % | 70/86 |
| Heart rate (bpm) | 65 |
| CAD-RADS 0-2 (%) | 92.9 |
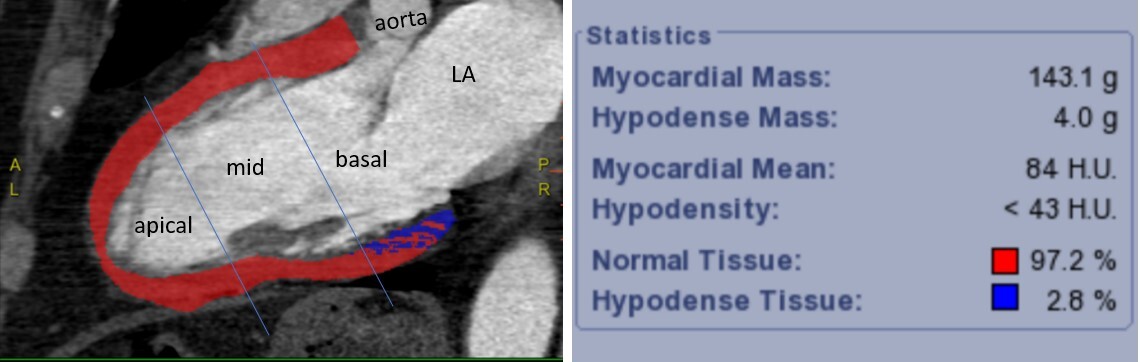
Typical examples for patients with a low percentage of hypodense myocardium and an increased percentage of hypodense myocardium are shown in Figures 1 and 2.
Figure 1
Representative example of a patient with a low percentage of hypodense myocardium. Long-axis coronary computed tomography angiography image demonstrates automated myocardial segmentation. Color-coded overlay indicates normal myocardium (red) and hypodense regions (< 43 Hounsfield units, blue), corresponding to 2.8 % of total myocardial mass. The left ventricle is divided into apical, mid, and basal segments along the mitral valve plane. The majority of hypodensity is localised to the basal segment. The software-generated analysis panel summarises myocardial mass, density thresholds, and quantitative distribution
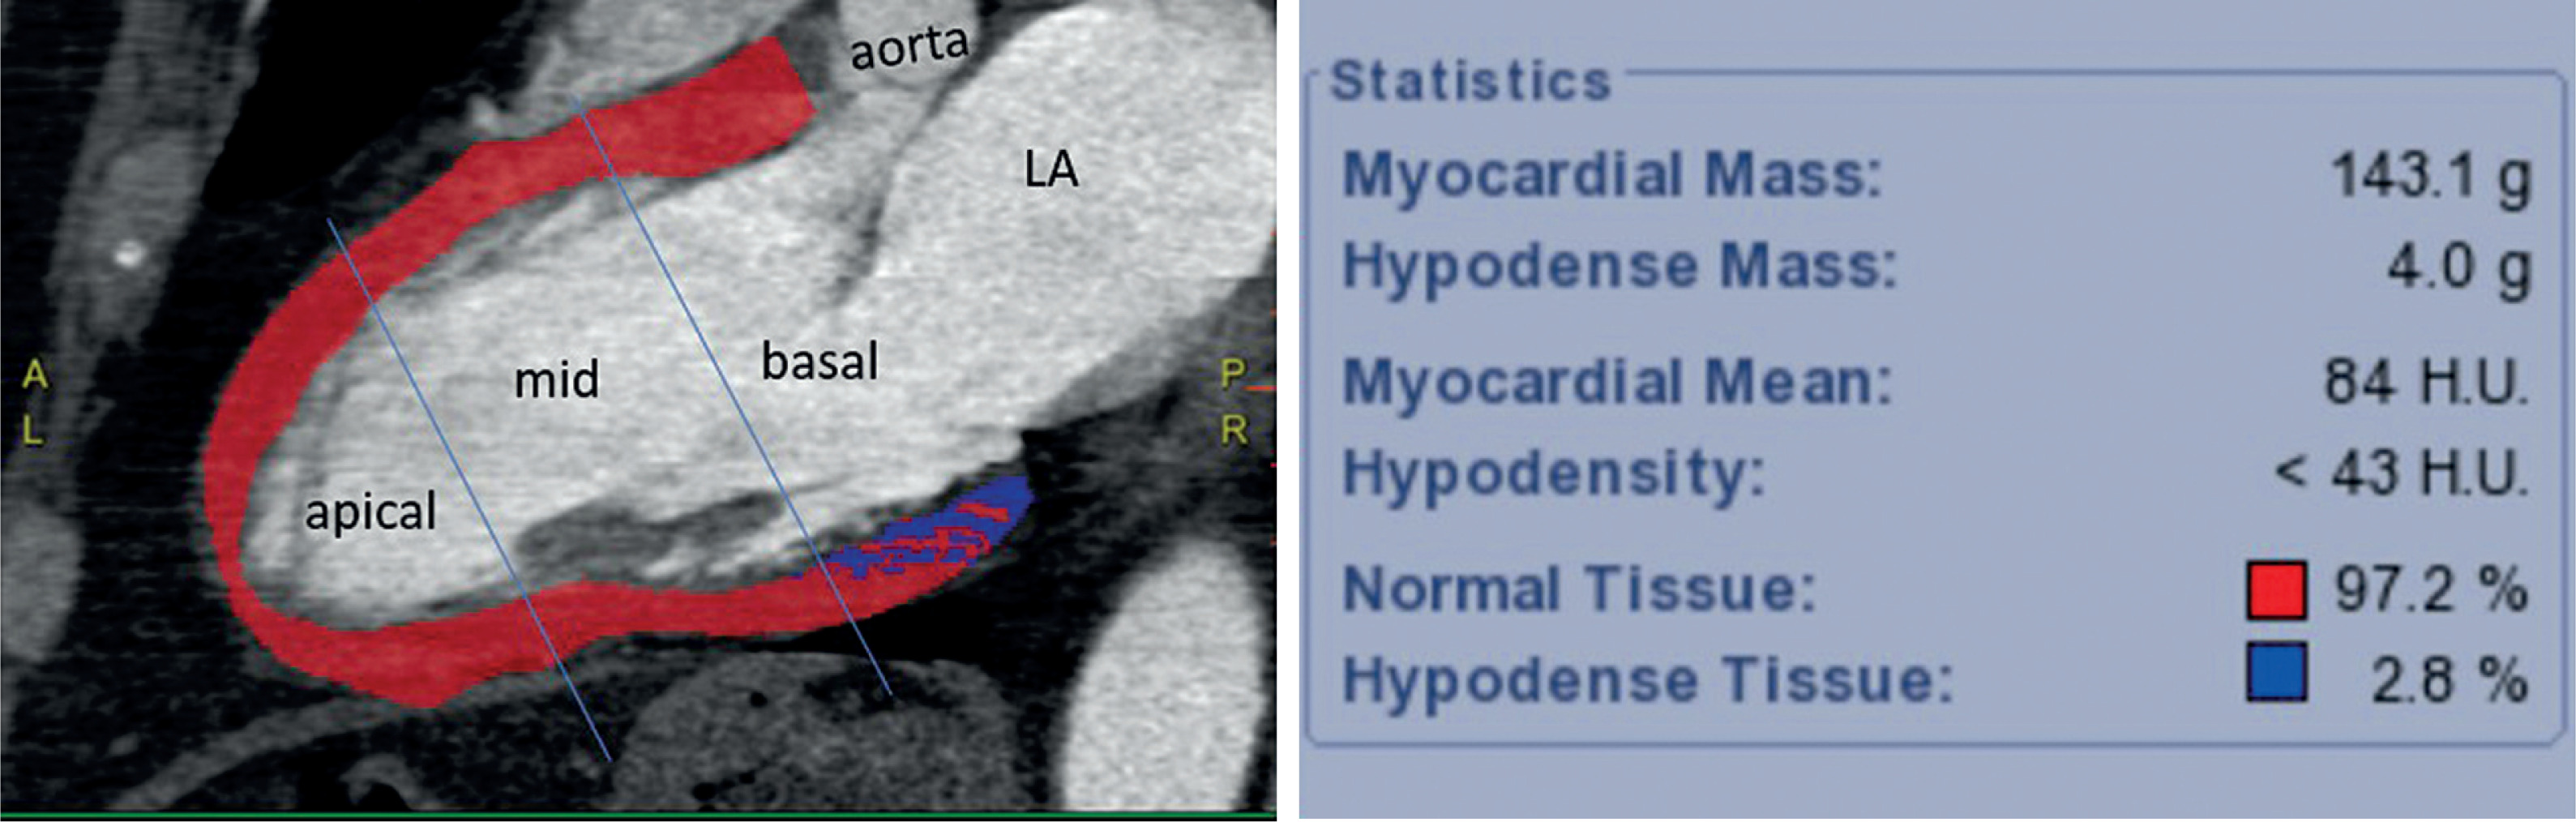
Figure 2
Representative example of a patient with elevated hypodensity percentage. Coronary computed tomography angiography-derived myocardial perfusion mapping reveals a greater extent of hypodense tissue (7.9%), predominantly distributed in both the mid and basal segments. As in Figure 1, segmentation was performed on long-axis images with division into apical, mid, and basal thirds. Myocardial density analysis was performed using a semi-automated workstation (CardiacVX, GE), with a predefined threshold of < 46 HU for hypodensity classification
Gender-based differences
Women demonstrated higher mean LVEF compared with men (68% vs. 58%, p < 0.01) and a lower mean myocardial hypodensity percentage (8% vs. 11%, p = 0.03). Hypodense regions were predominantly localised in the basal LV segments (82%).
Correlation analysis
Myocardial hypodensity demonstrated moderate correlation with LAEF (ρ = –0.41, p < 0.001), LA volume (ρ = 0.34, p = 0.002), and LVEF (ρ = –0.29, p = 0.006). These correlations remained significant after adjusting for age, sex, BMI, and hypertension. Corresponding coefficients are presented in Table 2.
Table 2
Imaging and functional parameters
ROC analysis
ROC analysis identified a data-driven LAEF threshold associated with increased myocardial hypodensity. Hypodensity percentage predicted reduced LAEF (< 47%) with an AUC of 0.67 (95% CI: 0.58-0.75), an optimal cutoff of 9.5%, sensitivity of 36%, and specificity of 71% (p < 0.05). Diagnostic performance metrics are listed in Table 3.
Echocardiographic findings
Global LV systolic function was preserved (mean LVEF = 63 ± 7%). Diastolic dysfunction was present in 68% of patients, predominantly grade 1.
The mean E/A ratio was lower in patients with DD compared with those with normal filling patterns (0.84 ± 0.21 vs. 1.22 ± 0.25, p < 0.05).
CCTA-derived LAEF showed an inverse correlation with DD severity (r = –0.41, p < 0.01). Patients with grade 2 DD exhibited both lower LAEF and higher hypodensity compared with the normal group (both p < 0.05).
Diastolic dysfunction grading
Mean hypodensity percentage increased progressively across DD grades: 5.7% (grade 1), 12.6% (grade 2), and 24.8% (grade 3) (p < 0.001). Group-level values are summarised in Table 4.
CAD-RADS 2.0 and SMART score
There was no statistically significant difference in myocardial hypodensity between CAD-RADS ≤ 1 and CAD-RADS > 1 groups (8.67% vs. 7.38%, p = 0.11).
SMART score demonstrated a weak inverse correlation with hypodensity (ρ = –0.21, p = 0.007), indicating that systemic atherosclerotic risk burden was not proportionally reflected by myocardial density patterns.
Discussion
This study evaluated whether quantitative myocardial hypodensity assessed on retrospectively ECG-gated CCTA reflects diastolic functional impairment. The hypothesis was that lower myocardial attenuation, representing subclinical perfusion alteration or early interstitial change, would be associated with reduced LAEF and more advanced DD.
The present findings support this concept: hypodensity percentage demonstrated a moderate inverse correlation with both LAEF and echocardiographic DD severity, and patients with more advanced diastolic impairment exhibited progressively greater hypodensity values. These results indicate that resting myocardial attenuation mapping provides physiologically relevant information that parallels established markers of diastolic loading conditions and atrial remodeling.
The basal predominance of hypodense regions observed in this cohort aligns with prior MRI and echocardiographic studies demonstrating that basal inferolateral segments represent early sites of impaired relaxation and longitudinal strain reduction [10–13]. This pattern is thought to reflect higher local wall stress and reduced perfusion reserve, suggesting that hypodensity in these regions may signify early myocardial susceptibility rather than focal ischaemia [10–13].
Importantly, the diagnostic performance of hypodensity percentage for predicting reduced LAEF was moderate. Although insufficient as a stand-alone biomarker, the stepwise increase in hypodensity across DD grades supports its role within a multiparametric assessment strategy [14–16]. This may be particularly relevant in clinical settings where echocardiographic evaluation is inconclusive, limited by acoustic windows, or affected by loading conditions [6,9,13].
Additionally, the spatial distribution of hypodensity in many patients did not correspond to coronary perfusion territories, suggesting that these findings likely reflect diffuse microvascular dysfunction rather than epicardial coronary stenosis [4–7]. The persistence of hypodensity in patients with low CAD-RADS scores further reinforces this interpretation and is consistent with emerging evidence that non-obstructive ischaemia and microvascular dysfunction contribute to early diastolic abnormalities [6,7].
CCTA-derived LAEF and LA volume markers provide additional insight into atrial reservoir and conduit function, which are recognised early indicators of diastolic burden [3,5,14]. Although atrial strain or stiffness indices were not available in this dataset, LAEF represents a robust and reproducible alternative measurable directly from multiphase acquisitions [14–16]. The moderate correlation between echocardiographic and CCTA-derived functional parameters suggests that routine coronary CTA can contribute clinically meaningful information regarding diastolic status, particularly in borderline or diagnostically uncertain cases [9,15–17].
These findings support the evolving role of CCTA as more than an anatomical test. Modern CCTA enables integrated assessment of myocardial mass, wall motion, atrial function, valvular structure, and surrogates of perfusion within a single examination [8–10]. Incorporation of perfusion-derived markers into existing diagnostic frameworks may facilitate earlier identification of individuals at risk for HFpEF, in whom diastolic dysfunction often precedes symptomatic disease [15–17].
Limitations
This study is limited by its retrospective single-centre design. Although interobserver agreement was excellent, external validation in larger prospective cohorts is warranted. Additional clinical variables such as atrial fibrillation history and medication use were not available and may influence atrial function.
Conclusions
Quantitative myocardial hypodensity demonstrated moderate relationships with LAEF and diastolic dysfunction severity, most notably in basal segments. While additional validation is required, attenuation-based myocardial characterisation may provide supportive information in the evaluation of diastolic function alongside established imaging methods.