Introduction
Since the end of the 19th century, scientists have been trying to comprehend the workings of the human brain. Many ideas have been developed to help visualise the brain’s lobe connections and how the network connections work together. This study is a review of over 30 years of application of a non-invasive method, diffusion tensor imaging (DTI), in science, focusing on the human brain with a special emphasis on uncinate fasciculus (UF) analysis. The first publications on UF appeared around 1980 and described anatomical experiments performed on animals, especially on monkeys [1–4], cats [5], and postmortem human brains [1,6]. This review was prepared for the benefit of other scientists and physicians exploring the topic and researchers who could improve UF imaging methods using magnetic resonance imaging (MRI), DTI, and fibre tracking (FT).
The main problem was that the study object was already deceased at the time of the examination; consequently, it was possible to determine the anatomy of UFs but not in vivo functionality, which became of interest to scientists. Nowadays, MRI [7] is being used to study brain tissue, providing the possibility to examine patients while they are alive, thus expanding the spectrum of medical research. MRI allows imaging of neurodegenerative diseases, lesions, and metabolic disorders.
In the literature, the most commonly compared groups are patients with specific diseases and healthy controls (HC), as this contrast offers the clearest insight into disease-related brain changes. For meaningful interpretation of DTI results, it is crucial that study groups are balanced not only in terms of health status but also by gender (female vs. male), age (children, adults, elderly), and handedness (right vs. left handed), as these factors are known to significantly influence DTI parameters. The sample sizes in the reviewed studies are generally modest, typically averaging around 50 participants, with the largest studies involving approximately 150 individuals – sufficient for basic statistical analysis, but still limited. Commonly investigated variables include hemispheric asymmetry (left vs. right), differences among cortical lobes (frontal, medial, parietal, and temporal), and comparisons across sex, developmental stages (adolescents vs. adults), and handedness. Depending on the region of interest (ROI), the brain is examined in various imaging planes, including axial, coronal, and sagittal projections [8–12].
Material and methods
Search and selection strategy
The screening process was performed according to PRISMA guidelines. PubMed, Web of Science, Google Scholar, and Cochrane Library were queried to retrieve studies from inception to 2024, without language limits. The search was performed using the logical operators AND and OR, using the following phrases: “uncinate fasciculus AND (anatomy OR structure OR morphology)”, “uncinate fasciculus AND (function OR functional role OR connectivity)”, “uncinate fasciculus AND (disorders OR diseases OR neurological disorders OR psychiatric disorders)”, “uncinate fasciculus AND (schizophrenia OR depression OR Alzheimer’s disease OR epilepsy)”, “uncinate fasciculus AND (acquisition OR image acquisition OR diffusion tensor imaging OR DTI OR tractography OR MRI)”. The search included original research articles and systematic reviews, focusing on the structure, function, and disorders associated with this structure. Additionally, in PubMed, the results were filtered by title and abstract (Title/Abstract), while in Web of Science, the results were filtered by the topic field, which allowed for a more precise matching of the results to the thematic scope of the study.
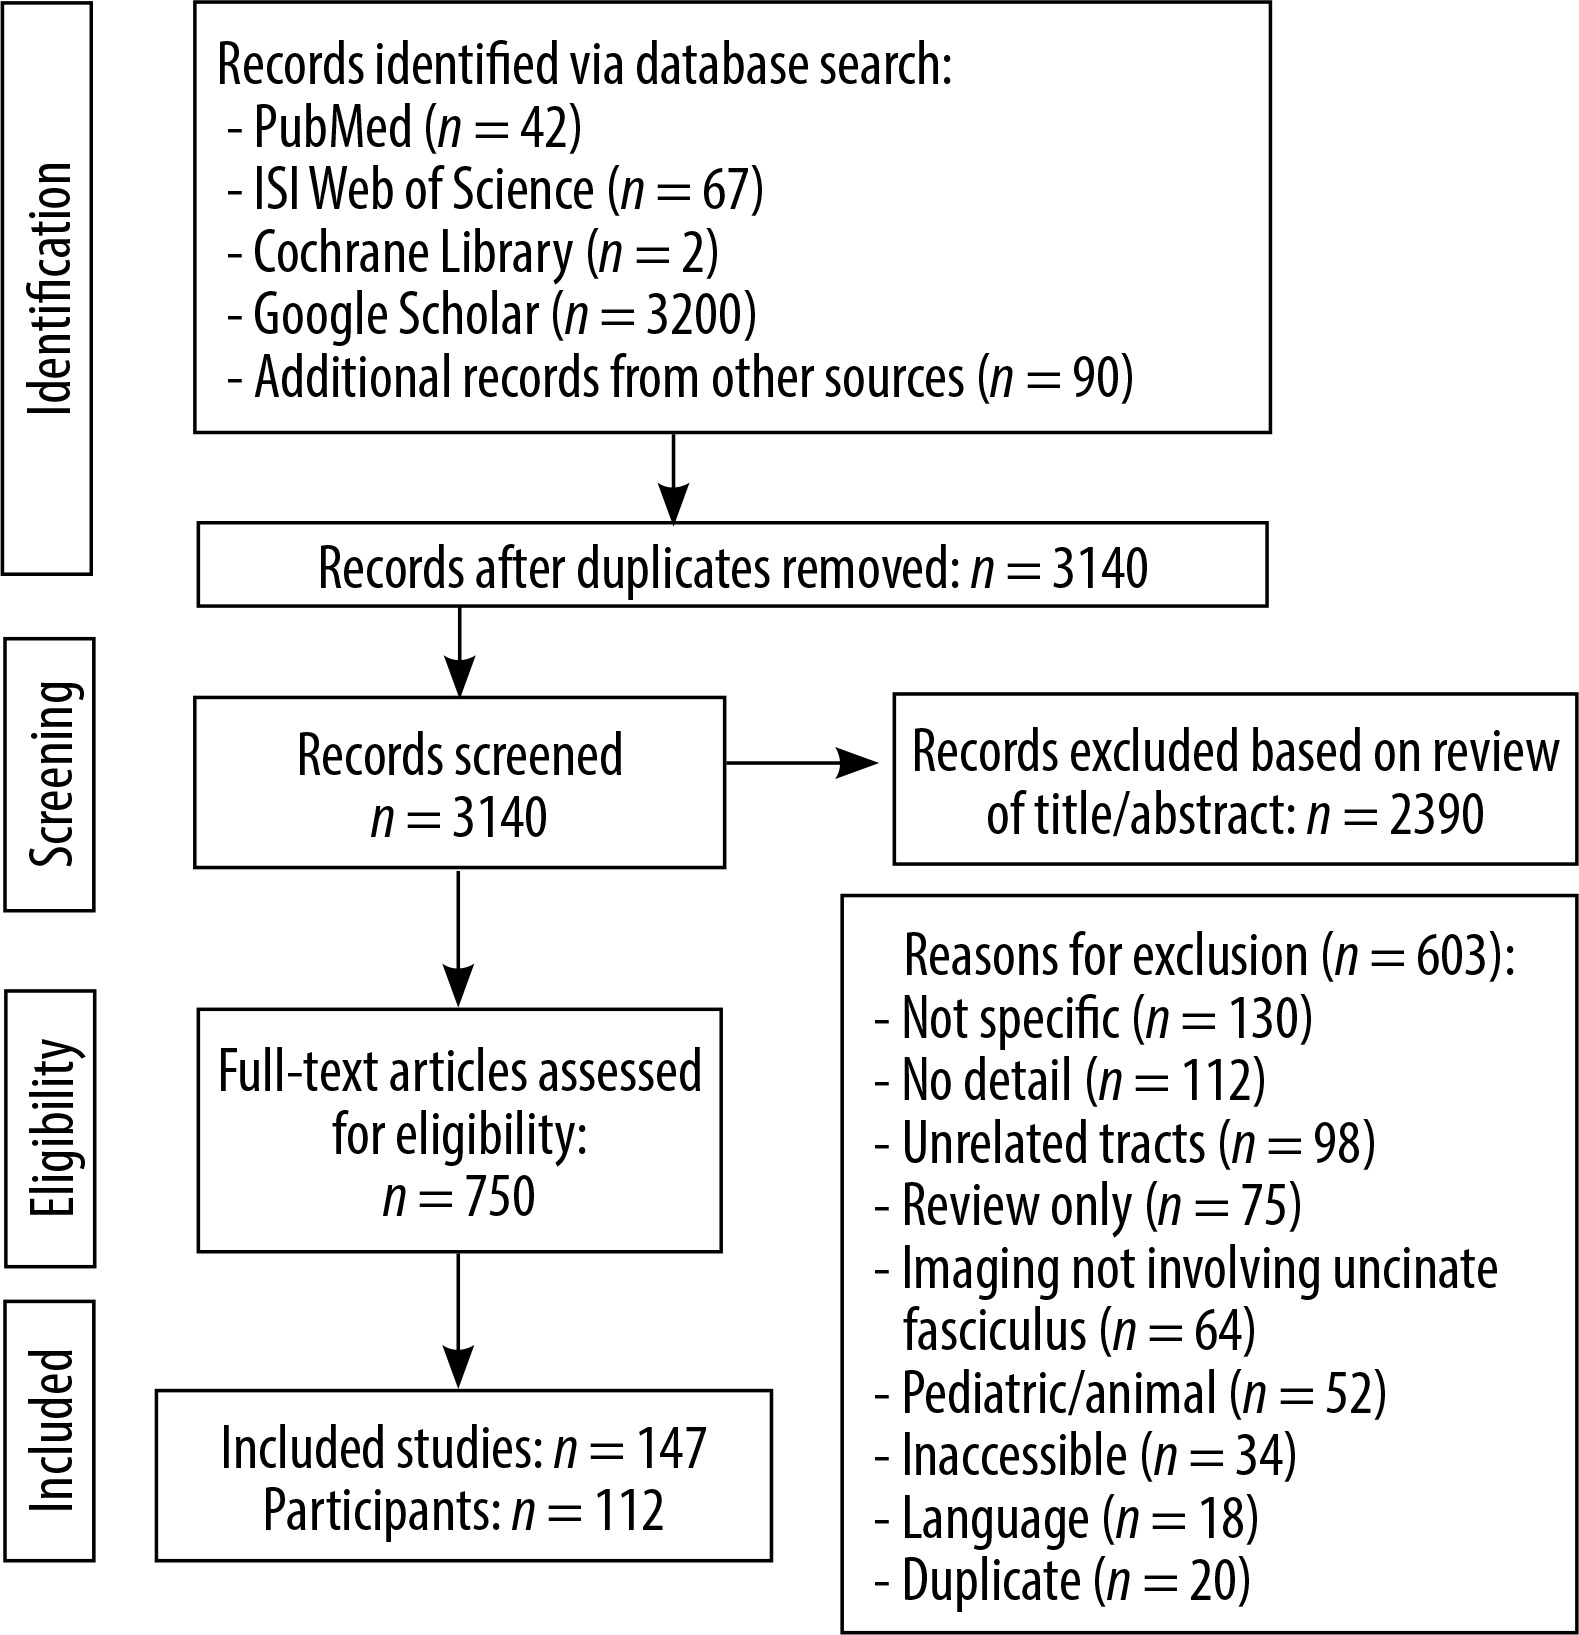
A total of 3401 publications were identified, of which 3140 records were eligible for analysis after removing duplicates. 2390 publications were excluded based on titles and abstracts, and 750 articles were subjected to full-text evaluation.
A further 603 publications were excluded for reasons including the following: lack of topic specificity (n = 130), lack of detailed data (n = 112), other white matter tracts (n = 98), limited to literature reviews only (n = 75), not including UF imaging (n = 64), paediatric or animal populations (n = 52), no access to full text (n = 34), publications in languages other than English (n = 18), and duplicates (n = 20). All data were processed in a PRISMA flowchart (Figure 1).
In this review, no formal assessment of the risk of bias was performed due to the high heterogeneity of the included studies in terms of methodology, design, and indicators used. The review included clinical trials, as well as basic and technical studies (e.g. validation of imaging methods) that do not comply with the typical criteria for assessing bias used in interventional or epidemiological studies.
Anatomy of the UF
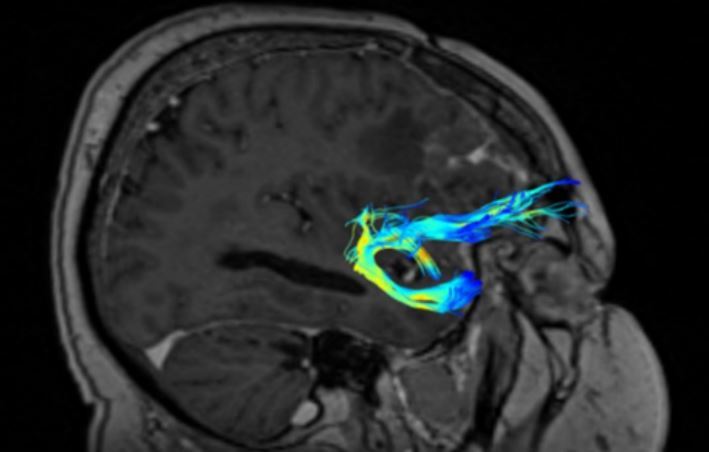
The UF (short association fibres) are ventral associative bundles that connect the anterior temporal lobe with the medial and lateral orbitofrontal cortex and associate tangentially rather than radially, connecting cerebral cortices of adjacent gyri. This bundle of nerve fibres is categorised as part of the limbic system [13–18]. UF anatomy is presented in Figures 2 and 3.
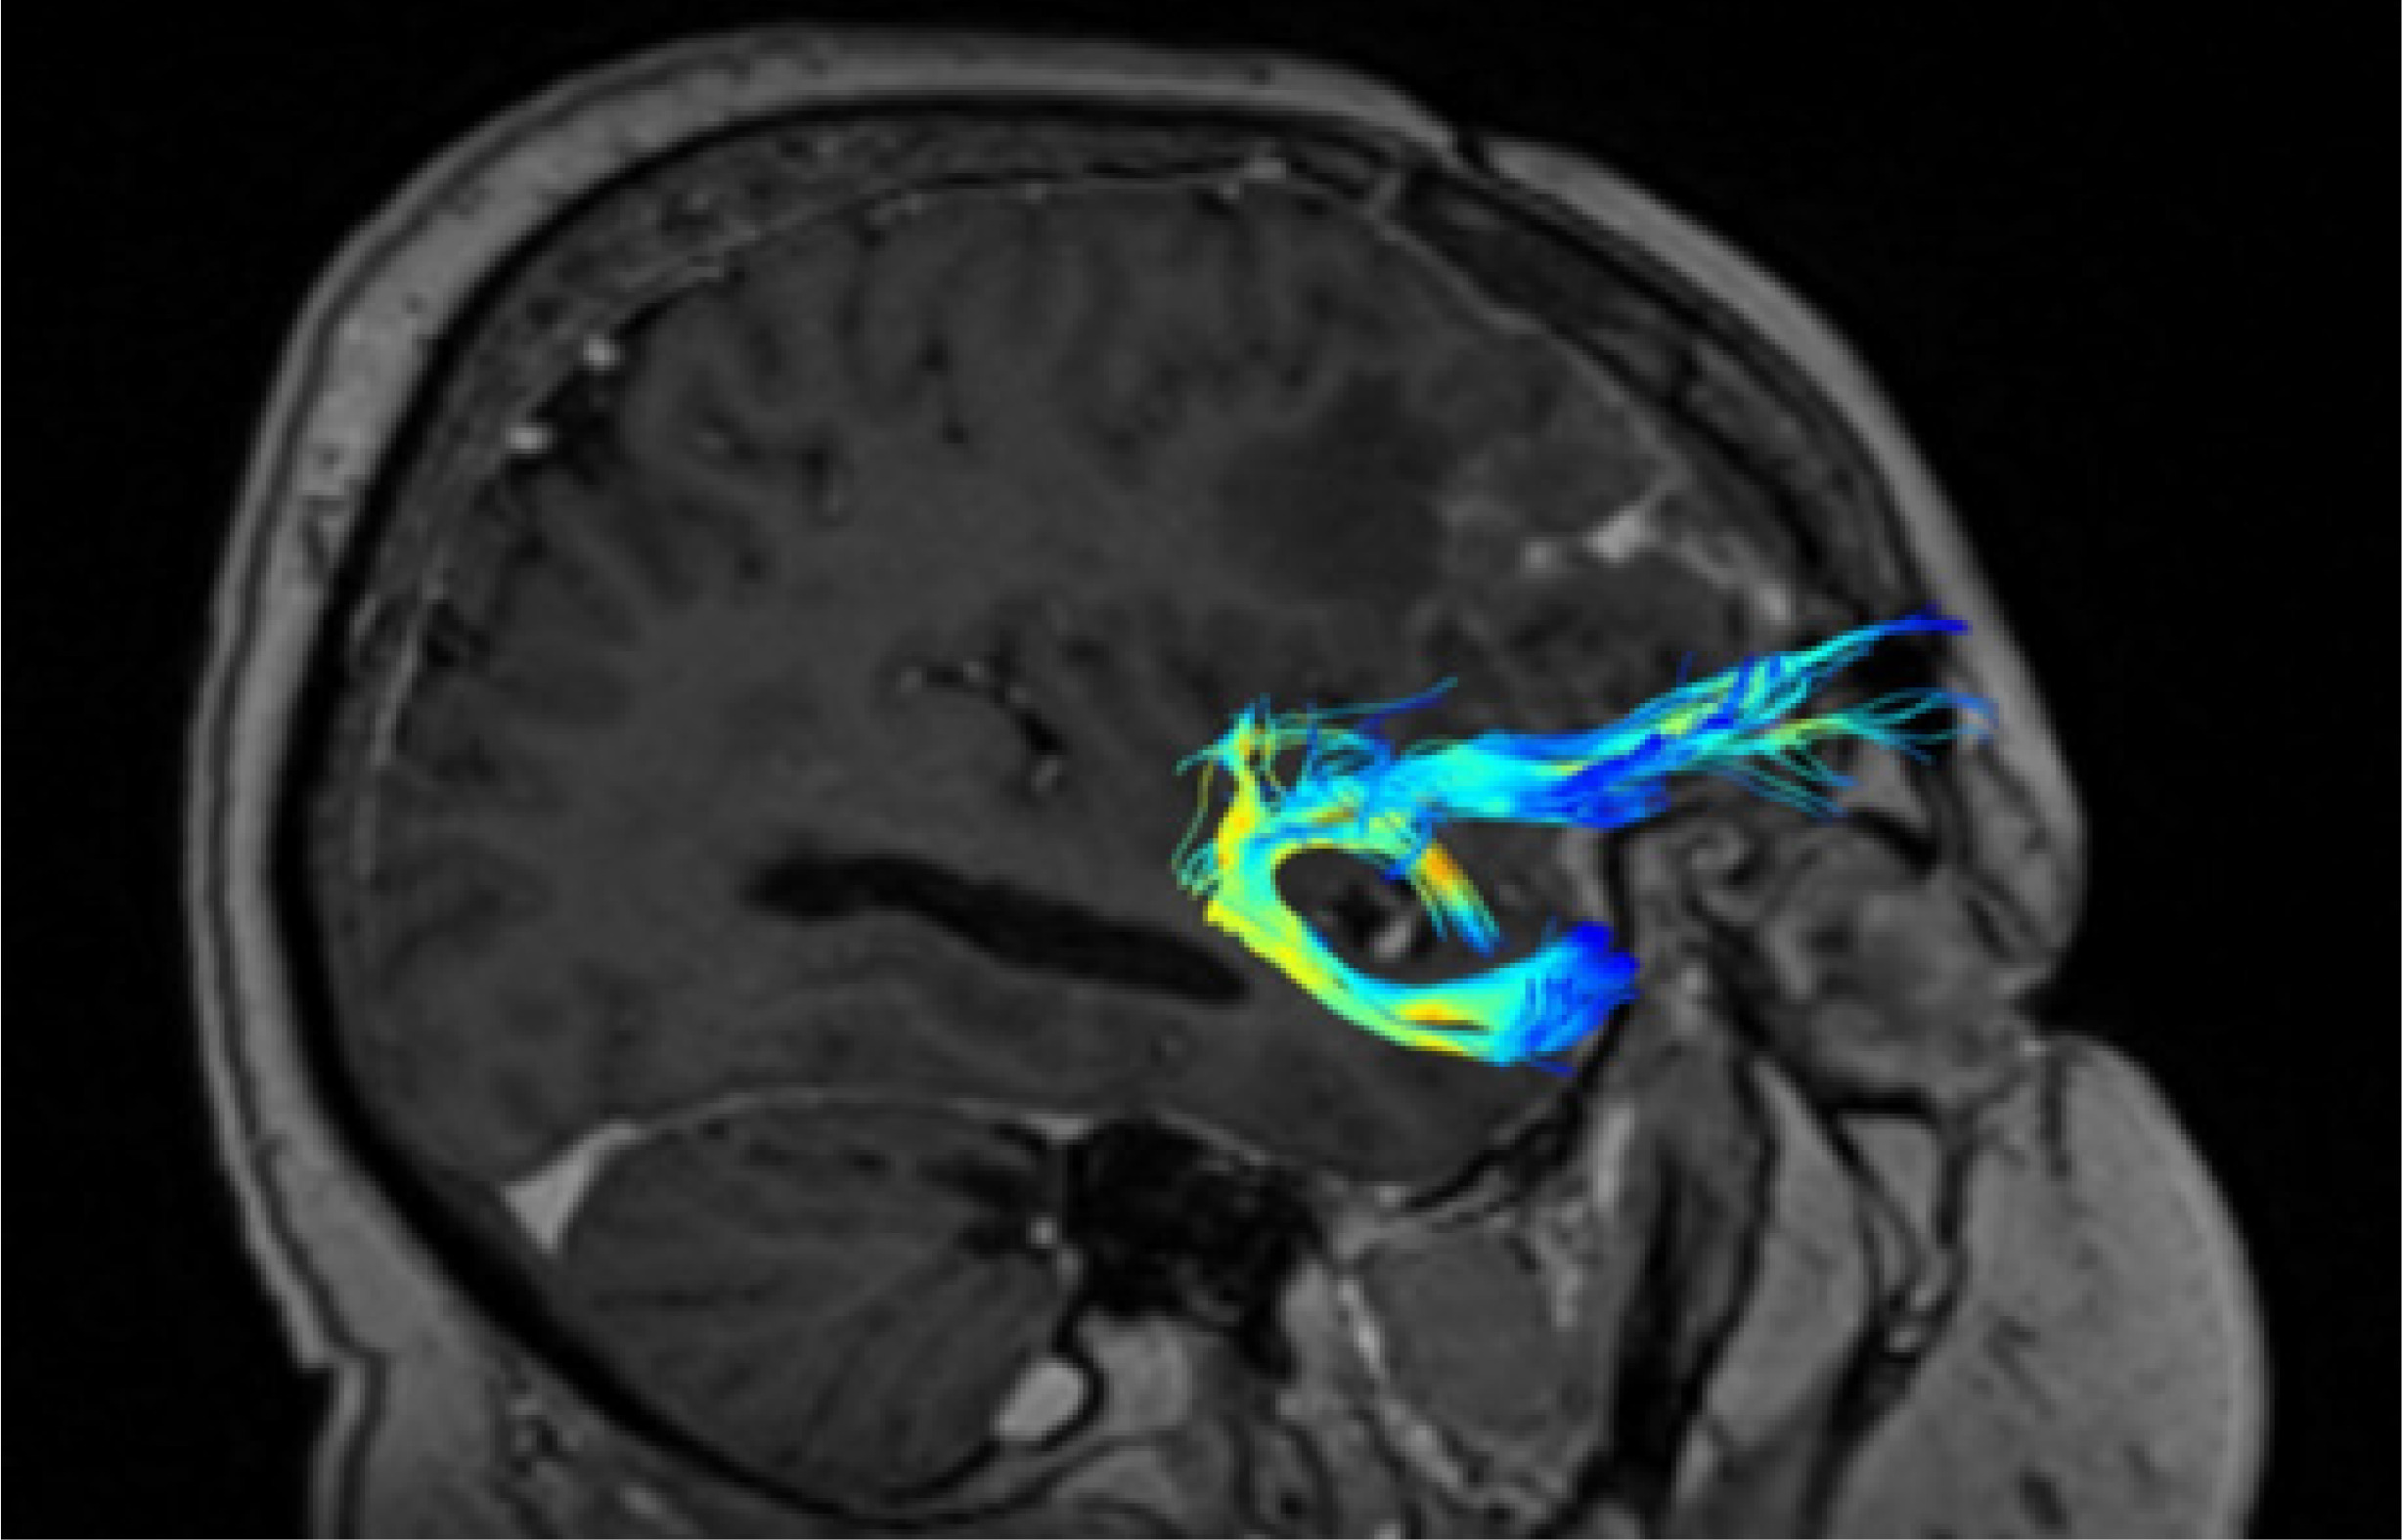
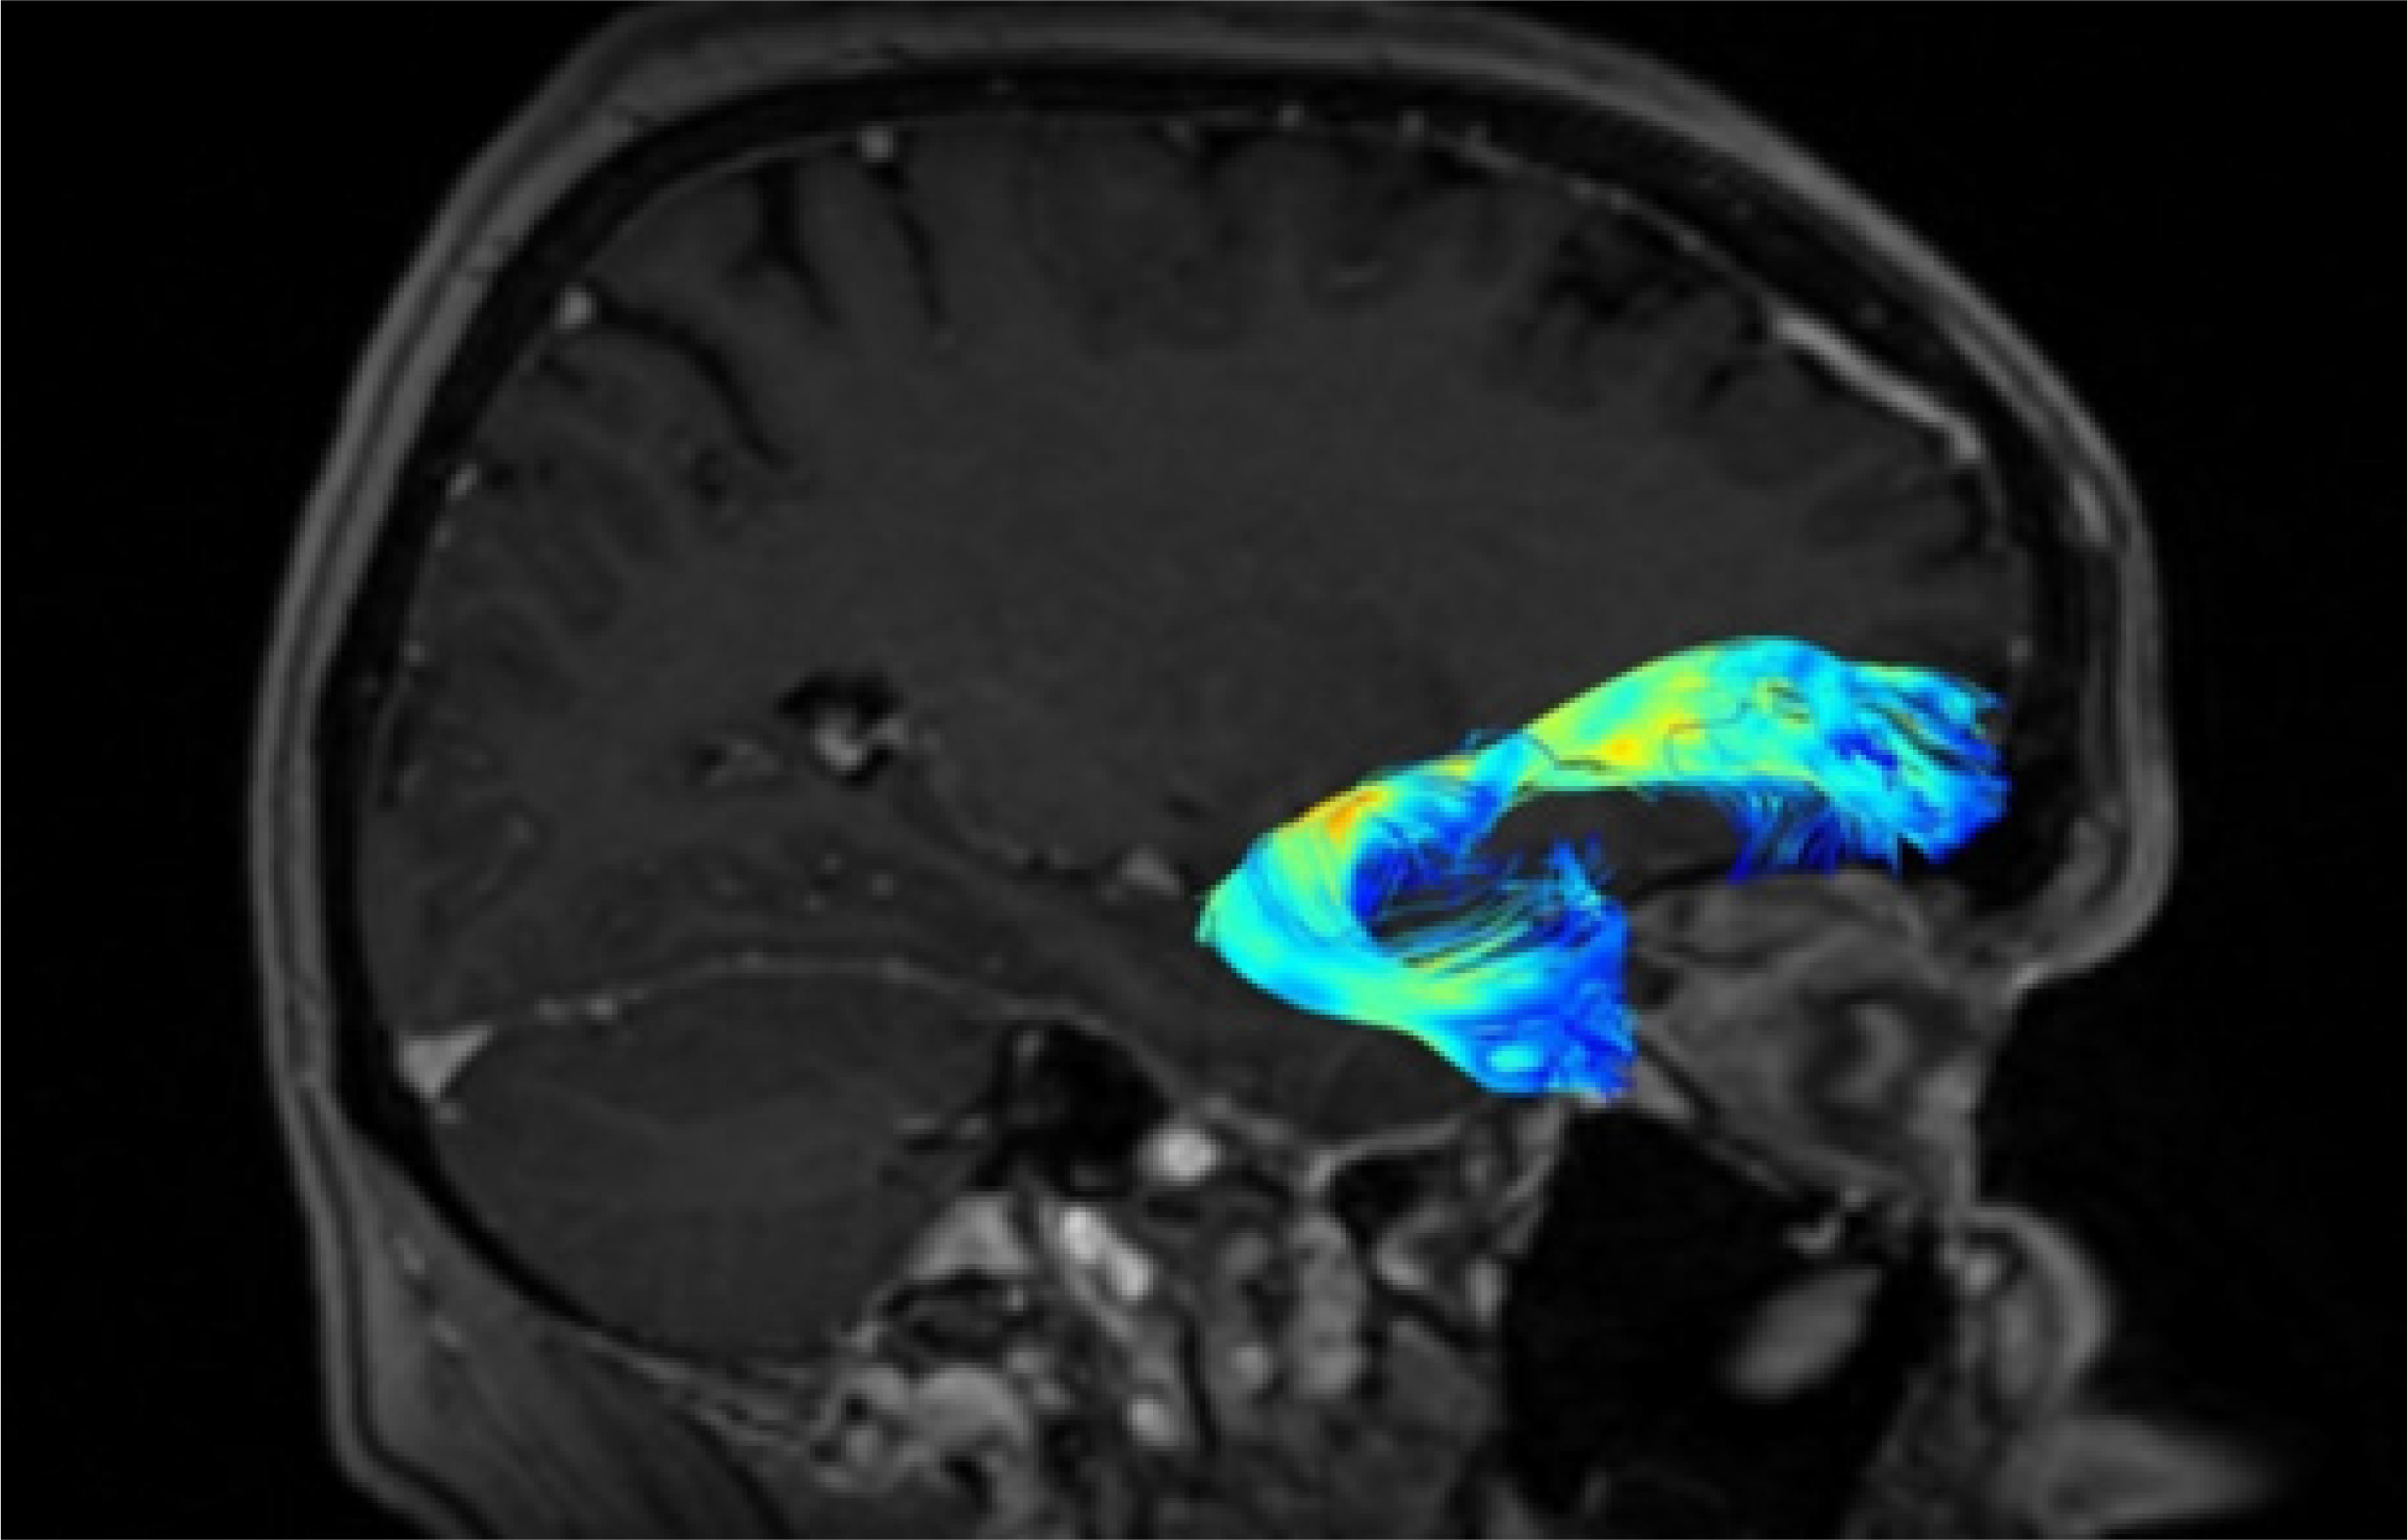
The UF processes the emotions, memory, and language functions. The UF comprises the slowest myelinating fibres, which are often associated with myelin metabolism disorders. The progress of myelination proceeds in the following directions: inferior to superior, central to peripheral, and posterior to anterior. This process lasts from the fifth month of fetal life until the fourth decade of adulthood. The presence or absence of subcortical UF provides insight into specific neurological symptoms, as primitive functions are myelinated first, while the last anatomical regions to myelinate are associated with more advanced functions [19].
The protection against the effects of ischaemic fibre changes provides a double blood supply from cortical and medullary arteries. The brain myelination process reflects the maturity of paediatric (and subsequent adolescent) neurologic function. This happens because the anterior temporal and frontal UF myelinates for up to 24 months. During brain neurodevelopment, white matter (WM) myelinates and becomes clearly visible on T1W (T1-weighted image, spin-lattice relaxation time) before it becomes invisible on T2W (T2-weighted image, spin-spin relaxation time due to increased cholesterol levels and galactocerebroside within myelin membranes and decreased water presence) [19,20]. The condition of UF provides the neurosurgeon with information about the connectivity between memory systems of the temporal lobe, prefrontal, and limbic forebrain cingulum. Disturbances in the functioning of UF can cause sociopathic behaviour and mental dysfunctions. Therefore, it is important to locate the UF to minimise the risk of surgical damage effects [20].
WM pathologies
WM diseases can be divided into groups: myelin metabolism and myelin damage.
Demyelinating disorders, including leukodystrophies, are connected with subcortical UF and the comparatively reduced speed of their myelinisation [21].
Diseases that cause demyelination and directly harm previously healthy myelin and/or oligodendrocytes are more common. These include conditions like multiple sclerosis (MS) and progressive multifocal leukoencephalopathy (PML), with a focus on detecting their effects on the UF early on [22].
Leukoaraiosis is a common vascular disease typically involving the WM but generally sparing the subcortical UF due to their protective collateral blood supply. The myelination process in brain WM occurs earlier than in UF. The pathophysiological presentation of myelination in WM is helpful in diagnosing WM tract disorders. WM disorder processes typically appear hyperintense on T2W [23,24].
In the meta-analysis by Zhu et al. [25], significant changes in WM were also observed in the analysis of DTI indicators in patients with post-stroke aphasia. Alterations in fractional anisotropy (FA) within speech-related neural pathways were associated with impairments following ischaemic strokes, such as difficulties in object naming, reading, or word repetition [25].
Zhao’s publication confirmed that the DTI techni-que enables detection of microstructural damage of the WM of the brain in patients with mild cognitive impairment (MCI). A significant reduction in FA values was found in many brain regions, including the frontal and temporal lobes, hippocampus, and corpus callosum. The observed changes may constitute potential early biomarkers of the development of Alzheimer’s disease and thus provide a basis for early diagnosis and therapeutic intervention [26].
Physics of DTI
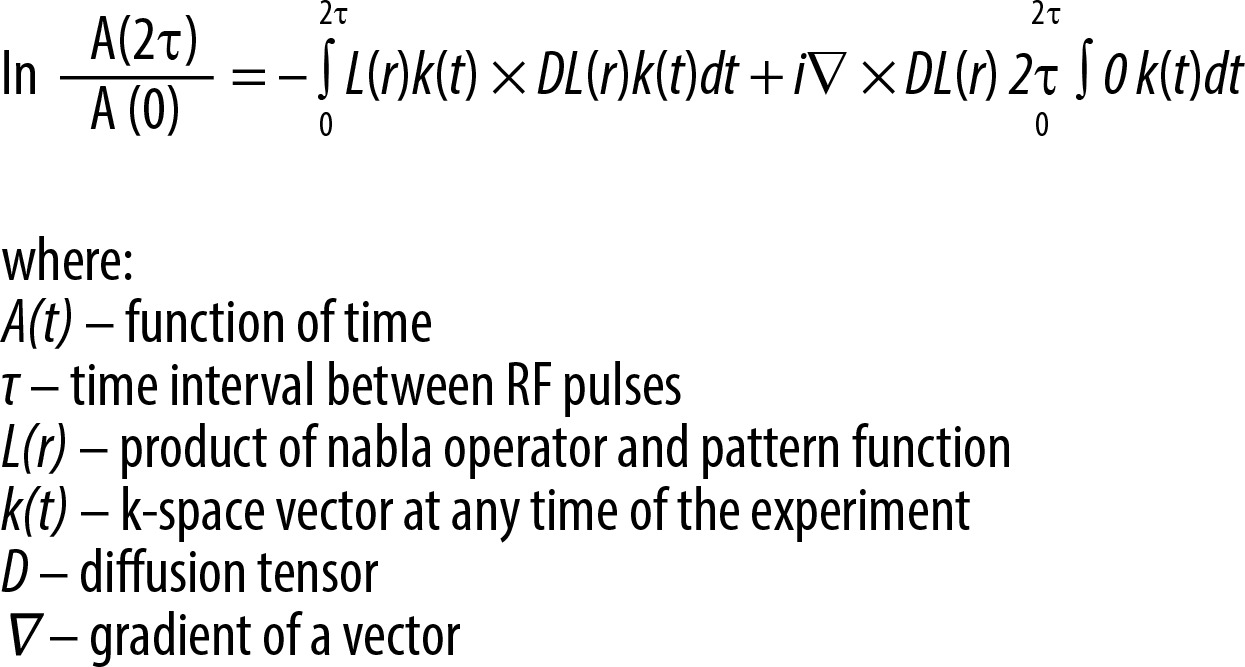
DTI is an MRI technique used to characterise anisotropic diffusion and assess the organisation of axonal WM, which forms the structural basis of the human nervous system, including grey matter (GM) components [27,28]. However, a key limitation of the method is that it traditionally assumes a uniform magnetic field gradient in space – an assumption that has been experimentally shown to be inaccurate. This oversimplification introduces significant systematic errors into DTI measurements. To address this, a generalised form of the Stejskal-Tanner equation has been developed, which accounts for spatial variations in magnetic field gradients. The classical Stejskal-Tanner equation is now recognised as a special case of this more comprehensive model, applicable only when the magnetic field gradient is spatially constant (Figure 4) [5,20,27-32].
Figure 4
The generalised Stejskal-Tanner equation for nonuniform magnetic field gradients (Borkowski & Krzyżak, 2018)
In the brain’s WM tracts, diffusion is anisotropic due to the presence of axonal membranes and protective coverings of myelin. Water molecules face obstacles that impede movement in specific directions that are not parallel to their orientation, with the direction of maximum diffusivity coinciding with the direction of the WM fibre tracts [33]. This directional information is represented in a diffusion model in 3D. The diffusion tensor (DT), a matrix created from diffusion measurements taken in different orientations, has specific properties that allow us to quantify complex physical phenomena. In this context, the tensor represents a rotation of the x, y, and z coordinate system, adjusting to a different coordinate system based on the scanner’s geometry, determined by directional diffusion information. Diffusion anisotropy measures how different the shape of the tensor ellipsoid is from a sphere, ranging from 0 (isotropy) to 1 (maximum anisotropy). This parameter is essential in estimating the axonal (WM) organisation of the central nervous system (CNS) and has recently gained attention in studying GM as well. The primary parameters obtained from DTI include mean diffusivity (MD) and FA. These parameters play a crucial role in understanding diffusion characteristics and anisotropy levels in brain tissues [34–36].
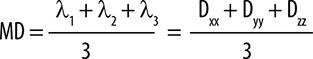
MD reflects the average magnitude of molecular displacement due to diffusion. Conversely, the FA value signifies the level of isotropy within the medium [37]. Although MD is comparable in GM and WM within the adult human brain, the level of anisotropy varies significantly between these tissues because of their differing structures. The DT can be diagonalised, allowing for the transition from the laboratory (x, y, z) frame of reference to the geometry-related (ϵ1, ϵ2, ϵ3) frame of reference. MD can be compute using the formula [38] below (Figure 5).
Axial diffusivity (AD) is defined as the largest eigenvalue of the DT, represented as λ1. It is strongly correlated with the assumed direction of the anisotropic structure and describes diffusivity parallel to the nerve fibres, myelin, and axonal content. In essence, it measures the diffusion of water molecules along the main axis of nerve fibres in biological tissues. A decrease in AD is often indicative of a decrease in the structural integrity of the WM. This decrease may be attributed to the presence of obstacles, such as damaged or demyelinated nerve fibres, which results in a decrease in the rate of diffusion along the primary axis of the fibres. In summary, AD serves as an essential measure for understanding the integrity and health of the WM in biological systems.
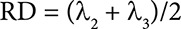
Radial diffusivity (RD) is the arithmetic average of the second and third eigenvalues of the DT, represented as λ2 and λ3. RD describes diffusivity perpendicular to the nerve fibres and myelin content. An increase in RD is often indicative of a loss of structural integrity in the WM. In summary, RD is an important measure for assessing changes in the WM’s microstructure and can provide valuable information about potential WM pathologies or alterations (Figure 6).
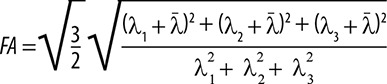
The largest eigenvalue of the DT, λ1, together with the associated eigenvector, ϵ1, is strongly correlated with the assumed direction of the anisotropic structure. It accurately states that the largest eigenvalue of the tensor λ1 along with its associated eigenvector ϵ1 is strongly correlated with the assumed direction of the anisotropic structure. FA reflects the degree of molecular displacement restriction by diffusion and varies between 0 (isotropic diffusion) and 1 (anisotropic diffusion). FA can be determined by the formula presented in Figure 7.
Figure 7
Equation describing FA by DTI eigenvalues (λ denotes the average of the 3 eigenvalues, representing the diffusivity averaged across different directions). λ1, λ2, and λ3 are the largest, intermediate, and smallest eigenvalues, respectively, of DTI
FA and MD inform about differences in biological tissues (the main observation in DTI is the freedom of water molecules and degree of sensitivity to thermal motion). In normal WM, there is a pronounced directionality in the diffusion of water molecules, resulting in a high FA value. This is because the restriction to water diffusion along the WM tracts is lower compared to the restriction in the perpendicular direction. The direction of maximum diffusivity can be represented by employing red, green, and blue (RGB) colour channels. The intensity of these colours is adjusted based on FA, creating a user-friendly summary map that allows for the assessment of anisotropy level and local fibre direction. DT can be visualised by fibre tractography, which is based on the algorithms relying on the voxel-by-voxel variability of ϵ1.
Fiber tractography
Brain tissue can also be visualised using FT, which is based on DTI. FT is a 3D reconstruction technique that assesses the representation of neural tracts. Tractography is a method that reconstructs the paths of WM fibres in the brain. This is achieved by following a continuous path of WM that offers the most resistance to diffusion and the least obstruction. FT provides an opportunity to generate fibre-tract trajectories and observe changes in fibre architecture. In each voxel, the fibre tract direction is parallel to the first eigenvector ϵ1 associated with the largest eigenvalue λ1 of the local DT [39]. While reconstruction of a continuous fibre tract is not possible based solely on ϵ1, the average of neighbouring voxels can be used to evaluate the new and true direction of vectors, generating a continuous DT field. Consequently, a continuous map of ϵ1 can be calculated. This method enables the calculation of fibre tract trajectories, fibre tract continuity, and connectivity. In summary, FT is a powerful tool that allows the visualisation and assessment of WM fibre pathways and their organisation within the brain [36].
Technical details of DTI measurements and main research goals
A typical scanner for hospital applications is 1.5T, but it can be seen that 3T scanners are replacing weaker predecessors. However, the 1.5T MRI is much safer. The 3T device emits more energy, which the body must absorb during the examination, making it more taxing on the patient. 3T apparatus can cause up to 4 times more heating of body tissues, which is particularly dangerous when performing MRI scans of the abdomen and pelvis, as well as when examining children, the elderly, and patients with impaired heat dissipation ability [40]. Additionally, 1.5T devices enable diagnosticians to achieve much better images in many situations because they allow them to find the balance between motion artifacts (mapping errors caused by patient movements) and the resolution needed to obtain an adequate image. If the patient moves during the MRI, motion artifacts will be much higher when the examination is performed with a 3T. A 1.5T MRI also generates much less noise than a 3T machine. This is because the main coil, the part that emits the magnetic field in a 3T scanner, generates twice as much energy as a 1.5T coil [40–42]. Table 1 presents types of MRI scanners, software tools, sequences, and main purposes in published studies (upon which this paper is based).
Table 1
Review of scanners, software, sequences, and main purposes used in publications
Chronological review
In 1994, researchers demonstrated how to non-invasively acquire a DT from MR images. This was achieved by applying diffusion-encoding gradients to the images and subsequently fitting a model to the data to estimate the DT.From this DT, trace, orientation, and anisotropy measures can be calculated for each voxel, reflecting the degree of brain tissue structure and the orientation of the DT. The rapid development of DT-MRI has significantly contributed to the advancement of FT technology, commonly known as “tractography” [36].
AIDS, progressive multifocal leukoencephalopathy
In 1998, research on acquired immune deficiency syndrome (AIDS) with a special focus on the UF was published [43, 44]. The authors analysed brain tissue metabolite changes, specifically in cases of incidental dementia in AIDS (occurring in between 20% and 30% of patients) and leukoencephalopathy (PML, occurring in 4% of cases) [43–46]. The study, using MRI and the 2D-CSI method, found a significant decrease in the average peak area ratios for NAA/Cr (a marker of brain damage) and an elevation in the mean Cho/Cr (a marker of brain health) in patients with HIV-associated dementia, compared to HC. These results indicate that the irregularities in cerebral metabolites observed in HIV-infected individuals might be associated with a widespread or diffuse process. In 2011, Galluzzi et al. [47] described cases of LBSL (leukoencephalopathy with brain stem and spinal cord involvement and high lactate) without sparing of the UF and globus pallidus. Brain MRI revealed WM abnormalities and an impact on brain stem structures. A notable characteristic of the syndrome was the preservation of the UF. The next information derived from brain MR spectroscopy failed to show a lactate peak, which confirmed the diagnosis. The diagnosis was validated through genetic analysis; however, the UF and the globus pallidus were involved. The spectroscopic data indicated a closer alignment with hypomyelination rather than demyelination.
Multiple sclerosis
In the late 1990s, research showed that MS could be detected using DTI. In one study, the frequency and site of isolated UF involvement in MS were detailed, and these findings were connected to physical disability and neuropsychological impairment [48]. MRI is a precise technique for quantifying the demyelinating or oedematous nature of an MS plaque, and the impact is visible on the set of MRI projections. MS lesions are most often found in the frontal lobes, which play a crucial role in cognitive function, and the interruption of UF may contribute to the cognitive impairment of MS patients. Isolated UF involvement may be an underappreciated MRI finding in MS, and preliminary observations suggest that it may contribute to neuropsychological impairment, particularly executive control and memory [23]. In a subsequent study, Neema et al. [34] found that the inclusion of GM imaging may enhance the correlations between clinical assessments and MRI findings. A 4-year longitudinal study on MS patients discovered that GM T2-hypointensity, which indicates potential excess iron deposition, was linked to deteriorating disability. The assessment of GM through MRI may provide a more clinically relevant insight into the neurodegenerative aspects of the disease compared to traditional MRI measures. In this context, major demyelinating diseases such as MS, neuromyelitis optica spectrum disorder (NMOSD), acute disseminated encephalomyelitis (ADEM), and myelin oligodendrocyte glycoprotein (MOG) encephalomyelitis have been identified and studied using advanced MRI techniques. A precise diagnosis of demyelinating diseases is essential for appropriate treatment, and MRI is relevant for differentiating the diagnosis. A more recent study investigated the sensitivity of superficial WM (SWM) integrity as a metric for distinguishing early-stage MS patients. The findings indicated that patients exhibited elevated MD in SWM bundles, including regions like the insula, inferior frontal, orbitofrontal, superior and medial temporal, as well as the pre- and post-central cortices [49].
Normal brain anatomy
In 1999, Shimony et al. described DT anisotropy in normative human brain data. To acquire typical cerebral data from the human brain and assess the anatomical details in quantitative diffusion anisotropy MRI, it is necessary to conduct scans on HC. The structure of the WM was observed, and anisotropy measurements were assessed, taking into account factors such as information content, resistance to rotation, and sensitivity to interference from noise. The highest total anisotropy was observed in the commissural WM, with progressively lower levels in the projection and association WM. The anisotropy was found to be sensitive to the histologic structure of the WM. The GM anisotropy data were approximately linear, and averaging can improve the quality of anisotropy. The movement of water molecules in a strong field gradient can be slowed down and measured by encoding the diffusion of water with balanced gradients before and after a special refocusing pulse [29,30,50]. In 2008 Oishi et al. identified common anatomical structures in SWM and performed a human brain WM atlas. Historically, WM has only been accurately defined in its central regions, leaving the peripheral areas lacking precise anatomical descriptions. To address this, DTI axonal fibre alignment data has been utilised to outline the peripheral WM and investigate its relationship with the cortex and deep WM. In the study, DTI data identified 4 short association fibre tracts (such as the UF) connecting adjacent gyri within the healthy population. A new SWM atlas has been developed, introducing additional anatomical dimensions to assess lesion frequency in each WM area and establish connections between lesion locations and functional outcomes. This population-based SWM atlas, created using DTI, subdivided the SWM into 9 blade-like structures and described their associations with cortical areas. Additionally, tractography revealed several inter-blade tracts. This atlas serves as a valuable tool for systematically labelling SWM regions. In 2012 Song [52] described an increased delineation of UF, GM, and WM boundaries using whole-brain 3D DTI. To bypass the limitations of the high spatial resolution and to enhance the visualisation of the brief and tightly curved fibres, the authors limit the fibre length to a range of 3 to 10 mm [51]. This range encompasses the shortest conceivable lengths for the curved segments of the UF spanning from one side of the sulcus to the other, assuming a cortical thickness of 3 mm. Certainly, at the original high resolution of 0.85 mm, these UF closely follow the contours of sulci and were effectively recognised and outlined. Significantly, these concise fibre pathways delineated at the elevated spatial resolution also contribute to a more precise definition of the boundaries between WM and GM, aiding in the establishment of connectivity with the WM-mapped short association fibres using in vivo diffusion tractography[53]. Accurate UF mapping demands high spatial resolution and specialised fibre and tractography models. Furthermore, the lack of comprehensive quantitative information about its geometry and distribution presents challenges when it comes to validating UF tractography results. The findings exhibited remarkable reproducibility, as evidenced by consistent measurements within the same participants and corroborated by a separate, independent study group. This research illustrates the robustness of in vivo UF connectivity mapping and represents a significant advancement towards constructing a more comprehensive human brain connectome. The retinotopically organised UF was mapped in the human brain noninvasively in vivo. The studied morphological and anatomical features of the UF were examined using FT. This study aimed to provide a more precise description of the anatomical variability of the UF and its volume, and to describe sex and age correlations. The findings revealed that FA was higher in the left hemisphere compared to the right hemisphere in sex and age correlation with UF and hemispheric dominance. However, the shape of the UF has not shown correlations with sex differences or the laterality of brain hemispheres [18].
Neurodevelopment
Snook et al. [8] described the application of DTI to study regional changes in the brain’s development from childhood to young adulthood. An increase of FA has been noticed in the genu and splenium of the corpus callosum, corona radiata, putamen, and head of the caudate nucleus between childhood and young adulthood. DTI reveals more extensive alterations in the brain’s microstructure during maturation compared to earlier findings based on conventional T1W MRI scans. These results indicate an ongoing process of microstructural development in the brain throughout adolescence. MRI localised maturational changes in the brain. Postmortem examinations are often limited in the number of young subjects who are perfectly healthy, and it complicates the normal brain aging study. T1W and T2 studies have shown differences in brain volumes with age and gender. In conclusion, diffusion anisotropy increases and MD decreases during the adolescent period, so the brain continues developing through late childhood because there is a progression of myelination and axon growth [7]. Lebel et al. [54] reported minimal sex- and age-related asymmetry in adolescent brains, and then Hasan et al. [55] stated that UF in the brain serves as a significant WM pathway that directly links the frontal and temporal lobes. The study revealed intriguing patterns in WM microstructure changes as individuals age. FA showed inverted U-shaped curves with advancing age, while RD and AD demonstrated U-shaped curves. These findings suggest ongoing dynamics of progressive and regressive myelination and coherence in WM that extend into young adulthood. Notably, the average FA values of the UF were significantly greater on the left side in both children and adults. The leftward asymmetry (left > right) in FA was found to be driven by an increased leftward asymmetry in AD and a lack of asymmetry in RD. This study marks the first to establish normative age-related changes in both macrostructural and microstructural aspects of the human UF across the entire lifespan. The insights gained from this research are valuable for advancing our understanding of the UF’s role in future behavioural and clinical studies. Olson et al. [56] described the development of the UF with special attention to developmental disorders. Variations in the maturation pattern of the UF might offer insights into divergences in behaviour. This review assesses the current understanding of the UF’s developmental progression and explores existing literature associating UF irregularities with particular disorders. The review outlines symptoms and behavioural deficiencies that have been observed to associate with UF anomalies, linking these impairments to hypotheses about the UF’s functional role. The review suggests that developmental disorders characterised by central issues related to memory retrieval, reward and valuation computation, and impulsive decision-making may be connected to anomalies in the microstructure of the UF [57]. Firstly, it has been found that associate memory problems are linked to variability in UF; secondly, impulsive decision-makers had alterations in UF structure; and thirdly, UF play role in sensitivity to reward the punishment. Moving forward, examination of UF can visualise alterations, addictive patterns, and behaviour. Individual changes can be linked with sensation seeking, risk-taking, and impulsivity [56]. The research of Oyefiade et al. [10] focused on the development of WM in healthy children and adolescents. Neural communication relies on WM networks, which consist of both long- and short-range connections. While the neurodevelopment of long-range WM has been extensively described throughout human life, there is limited understanding of age-related changes within short-range WM connections, such as the UF. The study found significant age-related differences in measures like FA, MD, AD, and RD across the frontal, parietal, and temporal lobes in a cross-sectional cohort of participants.
The results of the study Olive et al. [58] indicate a significant relationship between the volume of the right UF and the functioning of phonological and lexical-semantic short-term memory, especially in the area of pseudoword repetition. The obtained data suggest that the right UF may support verbal short-term memory in people with chronic aphasia. These findings shed new light on the role of WM in compensatory mechanisms and neuroplasticity after damage to the left hemisphere of the brain.
Depression and psychiatric disorders
The FA value of the UF volume is higher in the right hemisphere in schizotypal personality disorder. Many authors reported the significant prevalence of adolescent depression. A study aimed to investigate whether adolescent depression is linked to changes in WM microstructure in the UF and cingulum bundles. The results showed that adolescents with depression had significantly lower FA and higher RD in the bilateral UF. Importantly, since the depression was relatively recent in the study’s sample, these findings, when considered alongside existing literature, provide preliminary evidence that reduced FA in the UF may serve as a predisposing risk factor for depression [9,59]. Depressed mood, anhedonia (the inability to experience pleasure), psychomotor retardation (slowed physical and mental activity), and disturbances in circadian rhythm are central characteristics of the depressive syndrome. Studies using DTI have identified neural disruptions in depression within various brain structures, including the cingulum bundle, the UF, and the superior-lateral medial forebrain, as well as the anterior thalamic radiation. In individuals with a familial risk for depression, the primary finding is typically a reduction in FA in the cingulum bundle. Studies in adolescents have shown mixed results, with some reporting increased FA and others decreased FA in the UF. However, during acute depressive episodes in adults, the most consistent findings involve reductions in FA in the UF and the anterior thalamic radiation/superior-lateral medial forebrain bundle [60].
These disruptions in WM microstructure are believed to be associated with the core features of depression. Microstructural WM alterations in patients were explored with a generalised anxiety disorder (GAD) using DTI, and neural associations with the symptom severity were assessed. Specifically, reduced FA values in the right UF and the left cingulum bundle were found to be significantly negatively correlated with the severity of clinical symptoms, as measured by the Hamilton Anxiety Rating Scale scores. These findings suggest that microstructural abnormalities in the UF and cingulum bundle, along with decreased WM integrity, play pivotal roles in the underlying neural basis of GAD [61]. For the first time, DTI revealed the existence of a medial prefrontal segment of the UF that extends between the subgenual cingulate gyrus and the basolateral amygdala. These fibres within this segment were found to be closely connected to the body and temporal segment of the UF. The hypothesis was that these particular fibres probably play a significant role in mood regulation and contribute to our understanding of the pathophysiology of depression. Further research utilising functional neuroimaging and anatomical tracer studies could help to illuminate the functions and connections of these fibres in more detail. Riley reviewed myelin and oligodendrocytes damage with subcortical UF. It is stated that anomalies in subcortical UF relate to the pathogeneses of many intracranial disorders that affect cerebral WM.
Xu et al. [62] presented an analysis showing that patients with depression had reduced FA in the UF, suggesting perturbed coherence of this tract.
Recognising the presence or absence of subcortical UF involvement in imaging can be extremely helpful in determining the aetiology of a disease process that affects cerebral WM as well as understanding the extent of the disease [19,63].
In the study by Zhang et al. [64], the tractography method was also used for the first time to assess focal abnormalities of the UF in individuals with obsessive-compulsive disorder (OCD). The results showed significantly higher FA and lower radial diffusivity (RD) in the left UF, particularly in its temporal and insular segments, in patients with OCD compared to the control group. Moreover, in the insular segment of the left UF, increased FA was positively correlated with the severity of anxiety symptoms, while lower RD values were associated with longer disease duration. These results suggest important changes in the structure and organisation of UF nerve fibres, which may play a role in the pathomechanisms of OCD and potentially provide a basis for more targeted therapies.
Parkinson’s disease
Parkinson’s disease (PD) was described by Sedlacik et al. [65] with DTI and special attention to UF. Given the frontal dysfunction and motor symptoms observed in PD, it was hypothesised that increased microstructural degeneration might be detected in the frontal and central segments of the UF in PD. Linear regression analysis of DTI data showed highly significant increases in AD, RD, and MD with age across all investigated regions of the UF. However, changes in FA were somewhat ambiguous, with highly significant increases observed in the post-central UF region and highly significant decreases in the orbitofrontal region. The significant age-related increase in diffusivity across all UF regions indicated an age-related degeneration of the UF in healthy aging. The ambiguity of the FA findings and the complex branching of the UF into the cortex make it difficult to interpret in terms of axonal density or myelination. Interestingly, the study did not find significant increased degeneration of the UF in PD patients when compared to age-matched HC.
In the analysis by Rashidi et al. [66], it has been shown that in patients with diagnosed PD, with the appearance of motor symptoms in PD patients, there is a decrease in FA and/or an increase in MD, suggesting progressive damage in the later stages of the disease. In patients with non-motor symptoms, however, noticeable decreases in FA usually appear in a more advanced stages, which may indicate more extensive damage. Regarding the UF, there is a high probability of generalised demyelination and degeneration in the course of PD.
Alzheimer’s disease
The crucial role of WM DTI was described in patients with Alzheimer’s disease (AD). With the results of DTI measurement, it can be evaluated independently by DTT. FA values of bilateral UF and left inferior occipitofrontal fasciculus were lower for AD cases than for healthy volunteers. On the other hand, diffusivity values were higher also in AD patients [67,68].
Neuronavigation and surgical planning
Jennings wrote about strategies for surgical planning and neuronavigation. The fundamental WM framework is essential for translating the anatomic and functional literature into the practical implementation of the SWMC (surgical WM chassis) concept, highlighting its use in planning select illustrative cases. Significant attention has been dedicated to fostering a practical comprehension of the arcuate fasciculus, UF, and vertical rami of the superior longitudinal fasciculus, which are frequently overlooked WM pathways in surgical planning. The UF holds particular significance for neurosurgeons because it plays a crucial role in establishing connectivity between various brain regions, including temporal lobe memory systems, prefrontal and limbic forebrain structures, and the cingulum. Dysfunction in the UF has been associated with various sociopathic behaviours and psychological dysfunctions, including conditions such as autism and schizophrenia [69]. Proper planning of UF tractography is widely used in neurosurgery, taking into account neurooncology, with a special distinction for surgery of gliomas and metastatic tumours as lesions characterised by a high degree of infiltration of nerve fibres. Most often, UF tractography is used in the planning surgery in eloquent areas with special attention to the pathology of frontal lobe areas and limbic structures. Neuroimaging with tractography makes it possible to assess the location and course of the UF concerning the location of the tumour and their mutual correlation [70]. For proper plotting of the UF waveform, precise determination of the ROI is crucial. One of the most commonly used ROI construction schemes for determining the course of the UF is ROI 1 – the temporal lobe at the junction with and anterior to the temporal stem, and ROI 2 – the inferior frontal lobe at the junction with and anterior to the temporal stem. All tumour resection procedures are performed using a neuronavigational system. Current neuronavigational systems with fusion capabilities with tractography images allow the neurosurgeon to provide a spatial orientation of the brain tumour and UF. This information leads to a balance between minimising surgical trauma by enabling the selection of the correct access trajectory, better identification of anatomical structures, and safe tumour resection. To increase the safety of the surgical procedure and the accuracy of the planning of the neurosurgical procedure, a variety of acquisition methods are used, including DTI [71].
Strengths and limitations of DTI
Methodological problems
Early MR results in patients with PML affected by AIDS have been reported without the application of pulse sequences or specialised MR techniques, so this is method restriction [43]. Visualisation of whole-brain track data in 3D could be difficult because of overlapping tracks and limitations in computer graphics [72]. Spatial selection volume (SSV) was applied, and pathway tracks were selected, but this procedure is passive and aggravates the track’s quality. This technique enlarges regions by numerous averages and reduces the accuracy of pathways and, in effect, selection bias needs to be minimised. Previous studies on the development of association fibre tracts in the human foetus using DTI were conducted on postmortem foetuses. These studies typically utilised high magnetic field strength and required long image acquisition times to generate high-resolution datasets. These investigations aimed to provide insights into the development of WM tracts in the foetal brain using postmortem specimens and advanced imaging techniques [73]. Because of foetal and maternal movements, MR examinations of living foetuses in utero need to be performed with ultrafast sequences on standard clinical 1.5T MRI scanners. As a result, lower spatial resolution compared to postmortem imaging is obtained. Short image acquisition time (between foetal movements) is the basis of high-quality DTI data. Improving the correction of foetal motion and sequence development enables tractography in more cases. The next restriction of DTI FT is an inability to cross fibre differentiation (specialised algorithms solve this limitation but long image acquisition times are required). Unstandardised values of FA and angle thresholds for FT in the foetal brain raise the risk of false-positive or false-negative pathway visualisation. Altering FA and angle values increases the uncertainty and reduces the accuracy of tractography. When compared to postmortem foetal brain examination, in utero foetal DTI circumvents the issue of tissue deterioration. Another advantage is that DTI allows for the observation of brain development in its natural setting, preserving its morphological integrity. The potential of in utero DTI for visualising both typical and atypical foetal brain connectivity supports the broader inclusion of foetal MRI in the diagnostic assessment of foetuses with suspected brain disorders during the perinatal period. Multidirectional diffusion protocols may be an opportunity to optimal examine in some cases, i.e. the 6-direction protocol included four averages, which provides an increase in SNR. This technique is of the best quality to a 6-direction protocol with one average. The estimation of DTI parameters is the same for all groups, and applications of both protocols are sensitive to the same biology [8].
Crossing fibres
DTI difficulties in separating crossing fibres in multiple directions are the focus of many studies. Anisotropy can facilitate early detection of brain tissue pathologies such as assessment of the deformation of WM, delineation of the anatomy of immature brains, presurgical planning, and early detection of neurodegenerative disease. It can be also a source of information about brain region asymmetry, sex- and age-related with degree of myelination during neurodevelopment, and microstructural changes reflecting axonal degeneration. Differences in FA parameters and values of MD depend on the microstructural properties of nerve fibres and may reflect the speed of conduction, which appeared different for the left and right hemisphere [8,24,74]. The limits in the interpretation of the tensor model, primarily due to its inability to resolve fibre crossings, are well-documented. It is important to exercise caution when interpreting diffusion findings, especially with respect to AD and RD. These diffusion metrics may vary due to factors such as the presence of crossing fibres, partial volume effects, or pathological conditions, rather than being solely reflective of the underlying tissue structure. Therefore, it is crucial to consider these potential confounding factors when analysing diffusion data to ensure accurate and meaningful interpretations. To gain a deeper understanding of the microstructure of the SWM, more specialised acquisition techniques with higher angular and spatial resolution of DTI data can be employed. These advanced techniques help to define the fibre trajectories within the SWM more precisely, offering insights into the regional specificity of SWM changes. This allows for a more comprehensive assessment of SWM characteristics compared to other brain structural features, such as cortical thickness. Moreover, these advanced DTI approaches can help establish associations between SWM microstructure and specific behavioural functions. This analysis can be performed in the context of various factors, including age, sex, and cerebral asymmetry, providing a more comprehensive and nuanced understanding of the relationships between SWM and various brain and behavioural parameters. DTI has its limitations, which can result in aberrant fibre reconstruction and visualisation. These limitations become particularly evident in scenarios involving crossing or kissing fibres and when oedema is present. Oedema, which is frequently observed in the context of brain tumours, can pose challenges for the accurate and reliable assessment of WM fibre tracts using DTI. Researchers and clinicians should be aware of these limitations and consider alternative or complementary imaging techniques when dealing with such complex scenarios [75]. The tractography algorithms assume that the direction of the main eigenvector (a vector that represents the average direction of a single fibre bundle) matches the direction of the neural pathway. If the ROI is homogeneous and the direction variations of the fasciculi are of the order of size of the voxels, the algorithm will produce a correct result. However, if the ROI is not homogeneous or if the fasciculi have directional variations that are larger than the size of the voxels, the algorithm will not work as well. These limitations are important when interpreting FT reconstructions because without prior experience and knowledge it can be difficult to determine the direction of the neural pathway, determine its function, or identify the presence of synapses. The DTI method does not make it possible to disentangle the WM tract of the crossing fibres to a high certainty in the brain, and the results of the following study were not confirmed by FT. The next limitation is the medications’ influence on the patient’s brain structural connectivity. A positive correlation was observed between FA and antipsychotic treatment [76].
Size of groups
The next limitation is the size of the group. For example, an MRI of a sizable number of AIDS patients all with biopsy-proven PML of the brain could be promising to explore new therapies [43]. In the more numerous groups of cases, some MRI characteristics could be found, such as the absence of substantial cortical atrophy, which were indicative of a more favourable prognosis for patient survival. Snook described DTI as the best noninvasive method to localise neurodevelopmental maturity changes in the brain because of an unlimited number of young subjects (alive and healthy). Reducing the number of participants would decrease the size of the sample and statistical power, and would result in incorrect representation of the population [8,11].
Age
To reduce limitations of partial volume effects associated with age, only FA, AD, and RD were taken into consideration within brain tissue defined as WM in the sMRI data. Segmentation of brain tissue types based on signal intensity values through thresholding techniques can be affected by age-related microstructural changes in the cortical neuropil. These changes can complicate the interpretation of the results obtained through this method. It is important to recognise that, as the brain undergoes natural aging processes, the microstructure of the cortical neuropil may alter, potentially impacting the accuracy and reliability of tissue classification based on signal intensity thresholds. Researchers and clinicians should consider these age-related factors when performing such segmentation to ensure accurate and meaningful results [77,78].
Interpretation of FA and MD (also AD and RD)
The main limitation is often the interpretation of the FA values. How structural factors (except cellular density) affect water diffusivity and FA values should be considered (i.e. it is unspecified how the water diffusion and FA are affected in peritumoral regions). Hoeft stated that interpretation of the DTI is limited by FA because it is only an indirect marker of WM microstructural characteristics and is dependent on several factors. Park found that the unclarity interpretation of diffusion direction is the major limitation. Kinoshita stated FA and MD theoretically demonstrate randomness of values. Often tumour tissue restricts these 2 values in negative correlation, so this is the next limitation of interpretation [79–82].
Fibre architecture without functionality
DTI provides a demonstration of fibre architecture but not in a functional way or synaptic connection [15,81].
To visualise synaptic connections and fibres there must be a very large number of them in a given voxel, which means that smaller areas may not be found. FT is quite operator-dependent and requires a detailed knowledge of neuroanatomy. In the context of DTI-FT, several critical factors come into play to obtain objective and consistent results. First, the location and placement of ROIs are essential. These ROIs need to be positioned accurately to target specific WM tracts or regions of interest within the brain. Additionally, setting appropriate threshold values for FA and trajectory angles is crucial for determining when the tracking process should terminate. It is worth noting that DTI-FT typically relies on qualitative visual analysis by a radiologist. However, to enhance the reliability and objectivity of results, it is becoming increasingly important to incorporate quantification and standardisation methods into the process. These methods can help ensure consistency and reduce the subjectivity of the analysis. In the future, further research will be necessary to fully understand the significance of aberrant fibre connections and how they correlate with the clinical manifestations of CNS anomalies [69].
Oversimplification and normalisation of a tensor model
One inherent limitation in assessing the anatomy of WM tracts is the indirect nature of the evaluation. These spurious tracts may result from various factors, including the calculation of vectors originating from the skull base, CSF pulsations, or patient motion artifacts, rather than being genuine WM tracts. Researchers and clinicians need to be aware of these potential sources of error when using this technique for anatomical assessment [17]. Oishi et al. [6] reported oversimplification as a result of the presentation of DTI water diffusion properties as a simple 3 × 3 tensor model. The main claim of this model is in each pixel is only one dominant fibre population. UF is present in this area even if the FT of UF shows their absence. The FT technique is sensitive to artifacts. This is the result of image resolution. The existence of UF in SWM can be hidden by spatially complicated fibre architecture. Detection of UF by FT is limited by robust and consistent anatomical characteristics among different subjects. The imperfection of the normalisation process comes from the displacement of small, short association fibres. This can lead to the average coverage or suppression of UF. UF identification may lead to false positives.
Grey matter
Neema analysed small ROIs that might contribute to the high variability of intensity measurements. Global GM analysis may alleviate errors and increase accuracy. The reductions in FA of SWM in the GM regions implicated in the default mode network or anti-correlated with it [34]. In future studies, obtaining both resting-state fMRI data and SWM FA in the same subjects will allow for a correlative model [83]. FT of GM is quite an innovative technique to study local GM pathways. Anterior-posterior pathways could not be clearly identified in the coronal areas. These examinations linked fibre maturation and gyral formation. Neurodevelopmental disturbances of gyral folding cause neurological disorders. Higher GM density needs validation. Innovative sequences and algorithms are developed for clinical application as an alternative to DTI-FT, but they are still unavailable for routine clinical use [51,84].
Advanced diffusion modelling
Advanced DT modelling builds upon the foundations of DTI to provide more comprehensive insights into tissue microstructure and complex fibre orientations within biological tissues. It seeks to address the constraints of DTI, especially in situations where there are various fibre orientations within one imaging voxel [85]. Orientation distribution functions (ODFs) find wide application in advanced diffusion imaging research, especially in methodologies such as high angular resolution diffusion imaging (HARDI), Q-ball imaging, and diffusion spectrum imaging (DSI). These approaches surpass the limitations of traditional DTI by managing intricate tissue microstructures and capturing numerous fibre orientations within a solitary voxel. The first good method to be known is HARDI. HARDI techniques surpass DTI limitations by capturing intricate diffusion patterns, allowing for improved resolution of intersecting fibres or multiple orientations within a voxel. They excel at capturing complex diffusion patterns that extend beyond the singular dominant direction assumed in DTI. HARDI utilises increased gradient directions or higher b-values in MRI acquisitions to encode signals, enhancing sensitivity to diffusion and capturing more intricate details regarding diffusion processes. The second advanced reconstruction model is Q-Ball imaging, which is connected with ODF [86]. Q-Ball imaging approximates the ODF, portraying the likelihood distribution of fibre orientations within a voxel, enabling the depiction of multiple directions of fibres. Complexity in fibre orientation addresses situations involving multiple fibre orientations within a voxel, surpassing the constraints posed by DTI’s reliance on a single tensor assumption. Q-Ball imaging proves especially beneficial in areas where there are intersecting fibres or intricate fibre structures, such as within the WM. The third method is DSI. This process entails gathering information across a grid of diffusion directions, offering a more intricate understanding of diffusion. It reconstructs the diffusion profile within each voxel, allowing for a more thorough examination of intricate tissue structures, even within regions featuring intersecting fibres. These sophisticated models enhance resolution and sensitivity, capturing intricate diffusion patterns more effectively, thus offering deeper insights into tissue microstructure, connectivity, and the dispersion of orientations. Conversely, tensor decomposition techniques exist to break down DTs into their fundamental components, aiming for a more precise understanding of intricate diffusion behaviours. Methods like higher-order tensors, spherical harmonic decomposition, and non-negative matrix factorisation assist in obtaining more intricate insights from diffusion data [87,88].
Diffusion acquisitions
Diffusion MRI commonly uses multi-compartment models that aid in comprehending diverse tissue components by acknowledging varied diffusion behaviours within a voxel. These models account for distinct tissue components possessing different diffusion properties. Examples of key multi-compartment models used in diffusion acquisitions are shown below. Diffusion kurtosis imaging (DKI) extends DTI by considering non-Gaussian diffusion, accounting for higher-order moments of the diffusion process to capture deviations from Gaussian behaviour. Next, CHARMED (composite hindered and restricted model of diffusion) models diffusion in a voxel considering intra- and extra-cellular spaces, accounting for hindered and restricted diffusion components. And another is NODDI (neurite orientation dispersion and density imaging), which distinguishes between neurites (axons and dendrites) and extracellular space, providing metrics for neurite density and orientation dispersion [60,89].
DTI acquisition with an ultra-high b-value involves acquiring DTI data using significantly higher b-values than conventional DTI sequences, such as values in the range of 4000 s/mm2 to 10,000 s/mm2 or higher [90]. It improves sensitivity towards microstructures and detects smaller, slower diffusing particles within tissues, leading to clearer delineation of intricate tissue microstructure. This method assists in more accurately defining tissue compartments, like cell membranes, intracellular organelles, or regions with restricted diffusion. In neuroimaging, ultra-high b-value DTI offers insights into densely organised fibre tracts, facilitating the study of complex WM structures and their connections. The acquisition of DTI data is closely associated with the occurrence of artifacts [7]. Artifacts can affect the quality and reliability of the data, potentially impacting the accuracy of diffusion parameter estimation and subsequent analyses. Common artifacts specifically relevant to DTI applications are included below [5,7,91]. Firstly, motion artifacts, caused by the subject’s movement during acquisition, cause distortions, blurring, or ghosting in DWI, leading to misalignment among various diffusion-weighted volumes. These artifacts can notably impact tensor calculations, resulting in inaccurate estimations of diffusion metrics like FA or MD. Secondly, eddy current artifacts arise from the incorrect implementation or remaining impact of diffusion-sensitising gradients, leading to geometric distortions or misalignment among diffusion-weighted images. These artifacts can impact the accuracy of tensor estimation, affecting tensor orientation and eigenvalues [92]. Thirdly, there are susceptibility artifacts, in which variations in the magnetic field caused by tissue-air boundaries or metal implants result in signal disruptions or voids, especially in areas susceptible to susceptibility effects, such as the frontal lobes. Fourthly, Gibbs ringing artifacts occur near sharp edges in diffusion images due to the Fourier transformation process in EPI sequences. Fifthly, there are partial volume effects, in which larger voxel sizes compared to tissue microstructure can lead to partial volume effects [93], mixing signals from multiple tissue types within a voxel. It may affect the accuracy of tensor estimation, especially in regions with intricate tissue arrangements or near tissue borders. Several correction algorithms exist to prevent artifact formation. Motion correction algorithms employ image registration or techniques to correct motion, aligning diffusion-weighted images and reducing the impact of motion artifacts. Eddy current correction applies correction algorithms or sequences designed to reduce eddy current effects [70]. Gradient non-linearity correction involves the calibration of sequences and the application of correction techniques to counteract gradient non-linearities. Lastly, high-quality data acquisition utilises high-angular-resolution acquisitions or multiple b-value sampling schemes to improve data quality and reduce the occurrence of artifacts.
Limitations and practical implications
Considerable methodological heterogeneity is noticeable in the analysed studies, including differences in sample size, clinical characteristics of participants, and imaging techniques used. Many studies are based on small samples (n < 30), which significantly limits the statistical power and reliability of the obtained results [94,95]. Some studies also differ in the way they define and segment the UF, leading to ambiguous or contradictory results regarding its role in language and emotional functions [96]. An additional problem is the insufficient consideration of confounding factors such as age, gender, level of education, or comorbid neurodegenerative diseases. Despite these limitations, DTI and tractography techniques offer unique opportunities for studying the microstructural properties of WM, especially in the context of early cognitive changes. Studies suggest that reduced FA in UF may be a predictive biomarker in disorders such as MCI and post-stroke aphasia. Incorporating such techniques into clinical practice may increase diagnostic sensitivity and allow for more precise monitoring of disease progression or treatment response [25,26,97].
However, before DTI and tractography can be incorporated into routine diagnostic practice, further research is needed using standardised analytical protocols and multicentre trials with appropriate control for confounding variables. Additionally, integrating DTI findings with clinical cognitive assessment scales and other neuroimaging techniques, such as fMRI or PET, should be considered to provide a more comprehensive understanding of brain function [98–100].
The future
All the studies above state that higher angular resolution DTI data and more sophisticated FT methods might help with limitations and mention about combining diffusion-weighted MRI and FT with functional data. DTI has a great deal of merit as a means of obtaining the correct diagnosis and adequate treatment pathway for patients. The question of performing DTI tests of human brains to segregate the population into healthy and disturbed people (e.g. those capable of committing crimes or murders) remains to be pondered. The question of using DTI to classify human brains into healthy individuals and those with potential disturbances (e.g., individuals capable of committing crimes or murders) remains a matter of ethical and scientific debate. A separate challenge involves determining the optimal measurement protocol, including resolution, the number of diffusion-weighted imaging (DWI) directions, and the number and values of b-factors. Additionally, the influence of systematic errors – particularly those related to spatial inhomogeneity of magnetic field gradients – on the measurement and calculation of DTI metrics and tractography in both k-space and q-space must be carefully considered.