


Introduction
The buccal, sublingual, and submandibular spaces are small and often overlooked spaces in the head and neck, and neoplasms in these spaces are rare [1-4]. Radiological assessment of the buccal, sublingual, and submandibular spaces is complex and challenging, and multimodal imaging, such as ultrasonography, computed tomography and magnetic resonance imaging (MRI), are effective for diagnosis and treatment assessment [5-7]. Although MRI is effective in evaluating the extent of those space lesions, its diagnostic value in predicting malignancy is limited [8].
Recently, shear wave elastography (SWE) has been developed, and the shear elastic modulus has been determined for different tissues [9]. SWE is an effective technique in the quantitative evaluation of head and neck lesions [10-12]. Furthermore, the apparent diffusion coefficient (ADC) with diffusion-weighted MRI (DWI) are useful to evaluate for histopathological findings in neoplasms [13]. The ADC values can be useful to characterise and differentiate head and neck neoplasms [14-19]. However, no reports have been published on the relationship between SWE and DWI for distinguishing between malignant and benign neoplasms in the head and neck. The aim of this study was to research SWE and DWI for oral carcinoma and benign lesions in buccal, submandibular, and sublingual spaces.
Material and methods
Patients
This prospective study was approved by the Ethics Committee of our university (ECNG-R-400), and informed consent was obtained from all individual participants included in the study. Eighteen patients with lesions in buccal, submandibular, and sublingual spaces (10 males, 8 females; mean age 62.1 years, range 16-94 years) underwent SWE and DWI at our institute between October 2017 and May 2024. The pathological diagnoses in all lesions were obtained by surgery.
SWE and image evaluation
The SWEs were obtained with a 14-MHz linear transducer (Aplio 300, Canon Medical Systems, Otawara, Japan), performed by one oral and maxillofacial radiologist with over 30 years of experience, following our hospital’s protocol [9].
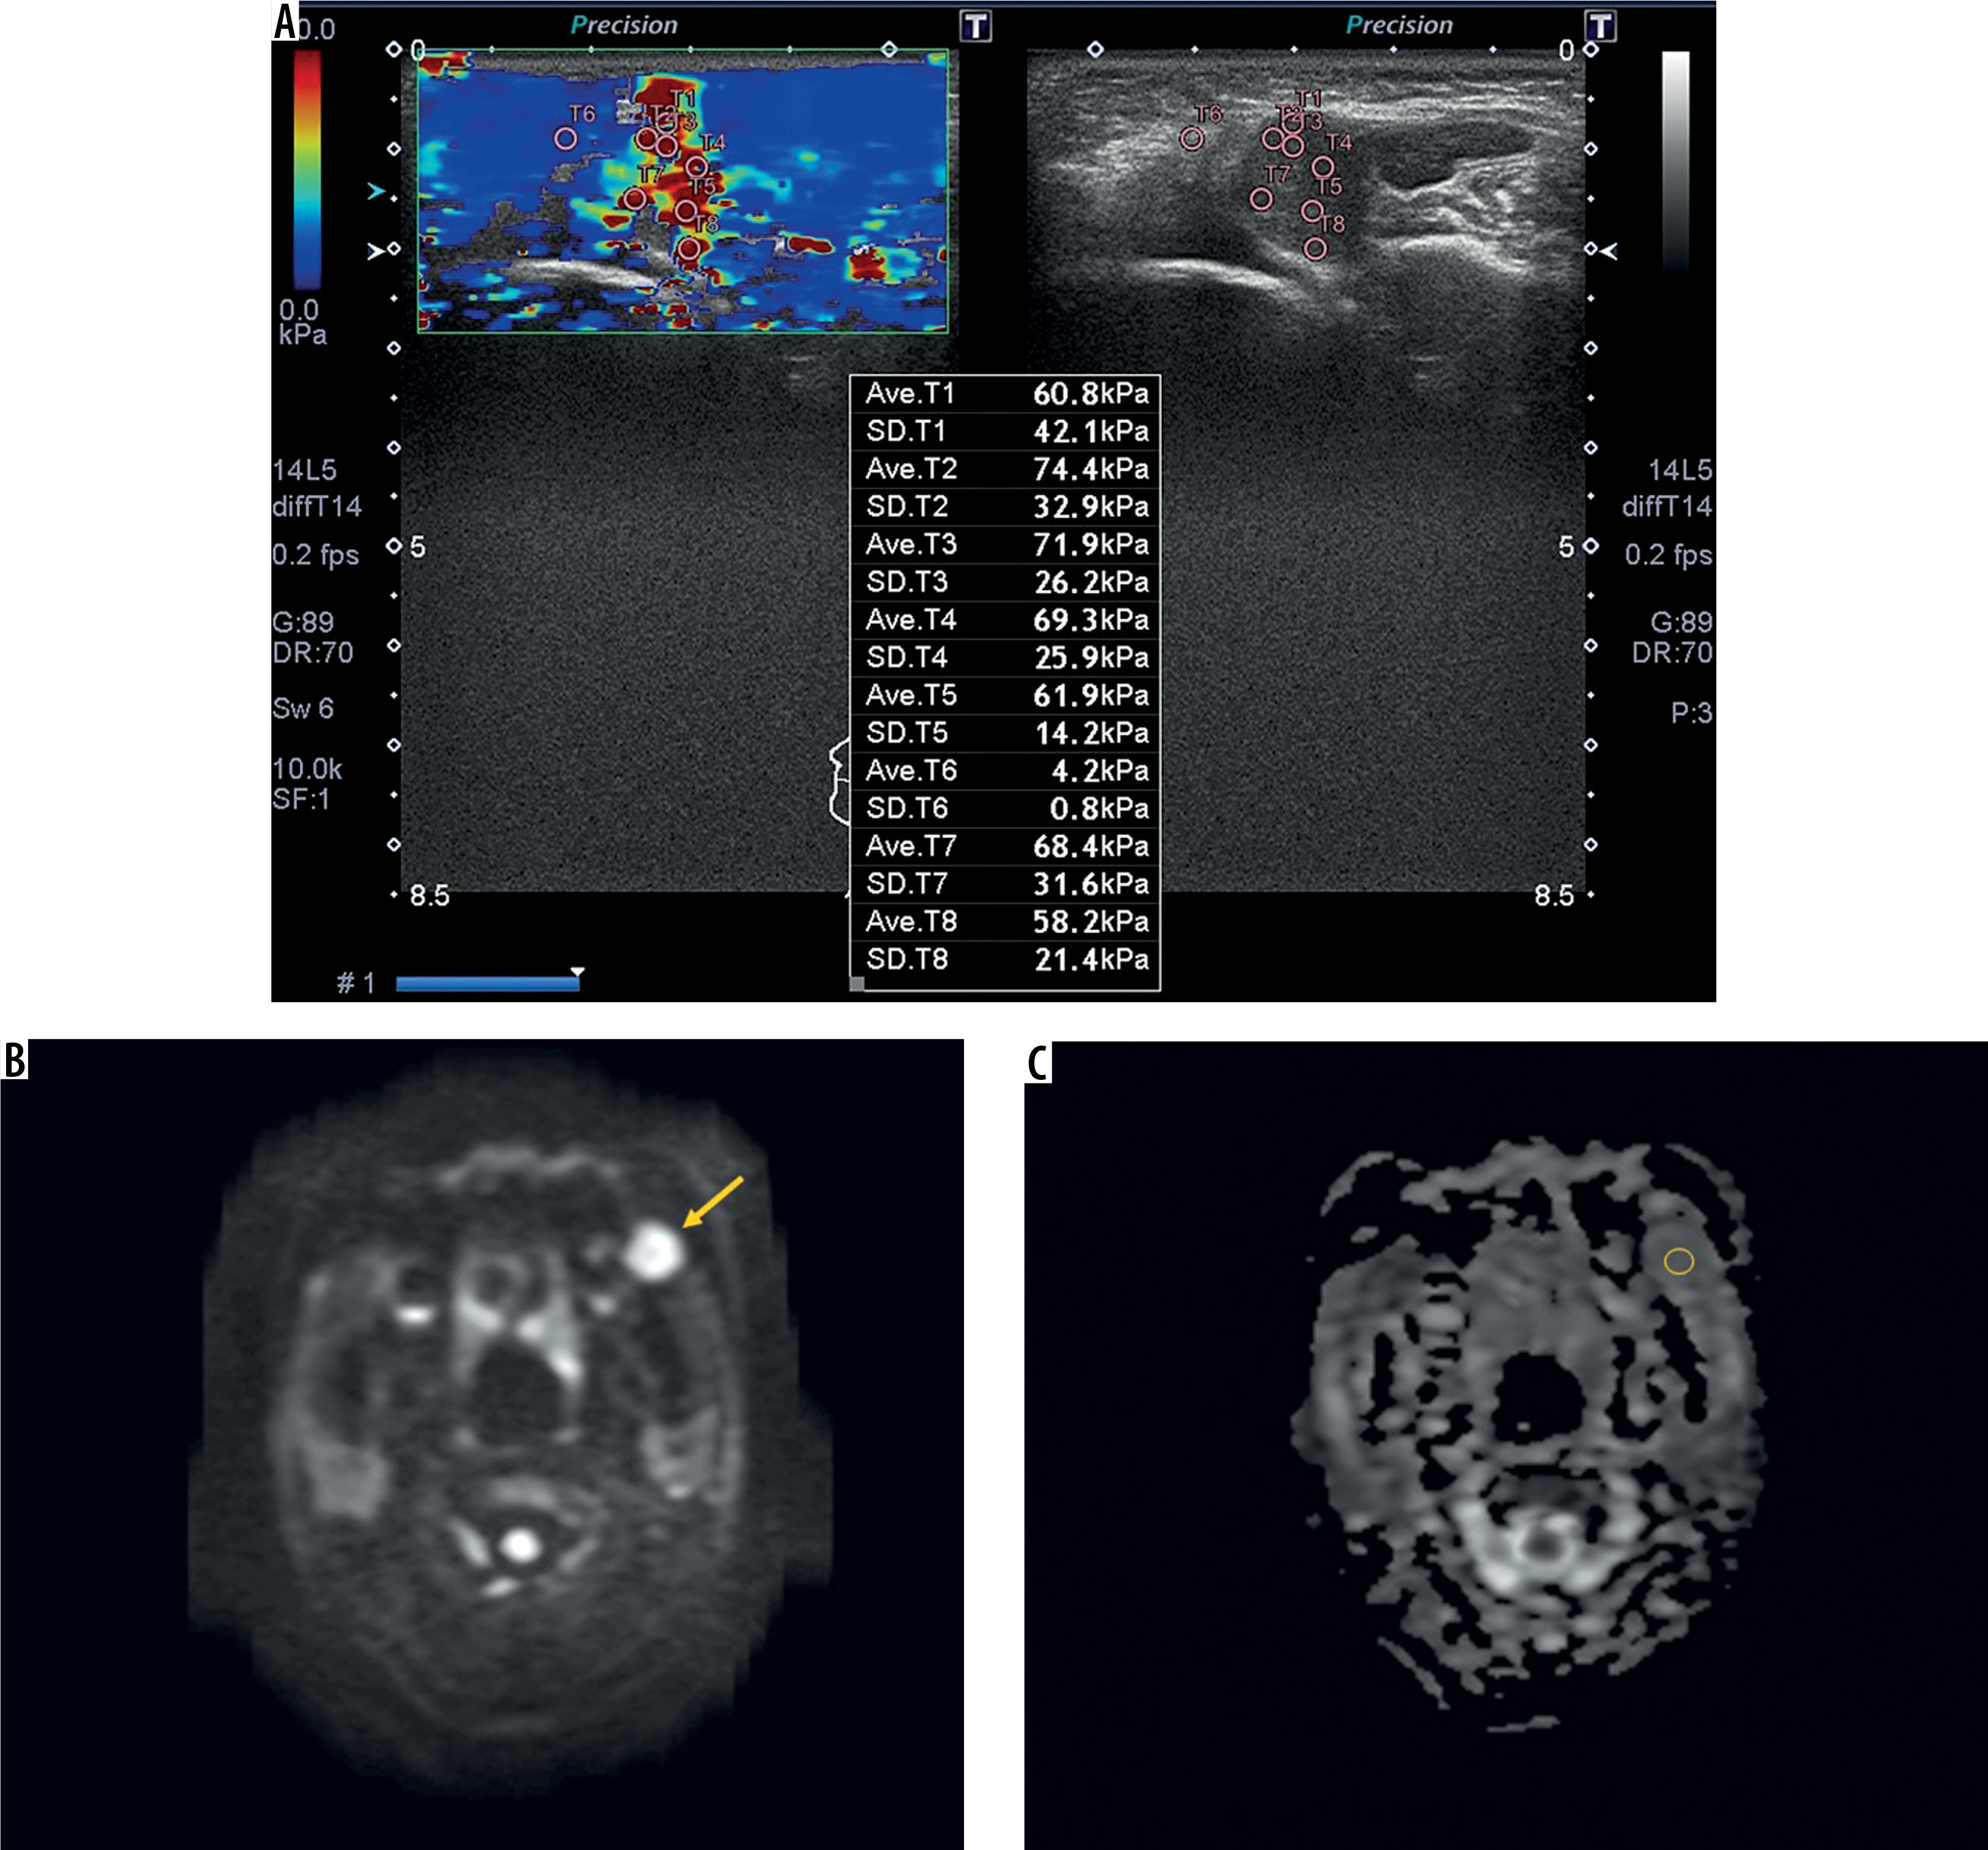
Maximum shear elastic modulus data of the lesions were analysed using SWE software. The integrated SWE software allowed the operator to place regions of interest (ROIs) of various sizes within the elastography window and automatically display shear elastic modulus data (kPa) for each ROI (Figure 1A).
Figure 1
Pleomorphic adenoma of the left side of the buccal space in a 16-year-old female. Shear wave elastography (A) indicates that the maximum shear elastic modulus of the lesion is 69.3 kPa in the region of interest (ROI). Diffusion-weighted image (B) shows a high-signal intensity area (arrow). Apparent diffusion coefficient (ADC) value of the lesion on an ADC map (C) is 1.24 × 10⁻³ mm2s–1 in ROI
ADC value with DWI and image evaluation
The DWIs were performed with a 1.5 T MR imaging unit (EXCELART Vantage MRT-2003; Canon Medical Systems, Otawara, Japan) by a head coil, following our hospital’s protocol [15]. The DWI sequence was obtained with b-values of 0 and 800 s/mm2 with echo planar imaging (repetition time 8476 ms, echo time 80 ms). The ADC maps were automatically calculated based on the DWI with b = 800 s/mm2 (Figure 1B, C).
Mean ADC values of the lesions were analysed by one oral and maxillofacial radiologist with over 30 years of experience. We used the ROI to calculate the ADC values on ADC maps, and we placed the ROI in the lesions to obtain the mean ADC value (Figure 1C).
Statistical analysis
The shear elastic modulus and ADC value for oral cancer and benign lesions were compared using Mann-Whitney U test. The relationship between shear elastic modulus and ADC value was performed by Pearson’s correlation coefficient. Statistical analyses were performed using SPSS (IBM SPSS Statistics 26.0, IBM Japan, Tokyo, Japan), with a 5% significance level.
Results
Table 1 shows the shear elastic modulus with SWE for oral carcinoma and benign lesions. The shear elastic modulus of oral carcinoma (116.6 kPa) was significantly higher than those of benign lesions (47.0 kPa, p < 0.001). Table 2 shows the ADC value with DWI for oral carcinoma and benign lesions. The ADC values of oral carcinoma (1.14 × 10⁻³ mm2s–1) was significantly lower than those of benign lesions (1.62 × 10⁻³ mm2s–1, p < 0.001).
Table 1
Shear elastic modulus with shear wave elastography for oral carcinoma and benign lesions
Table 2
Apparent diffusion coefficient (ADC) value with diffusion-weighted magnetic resonance imaging for oral carcinoma and benign lesions
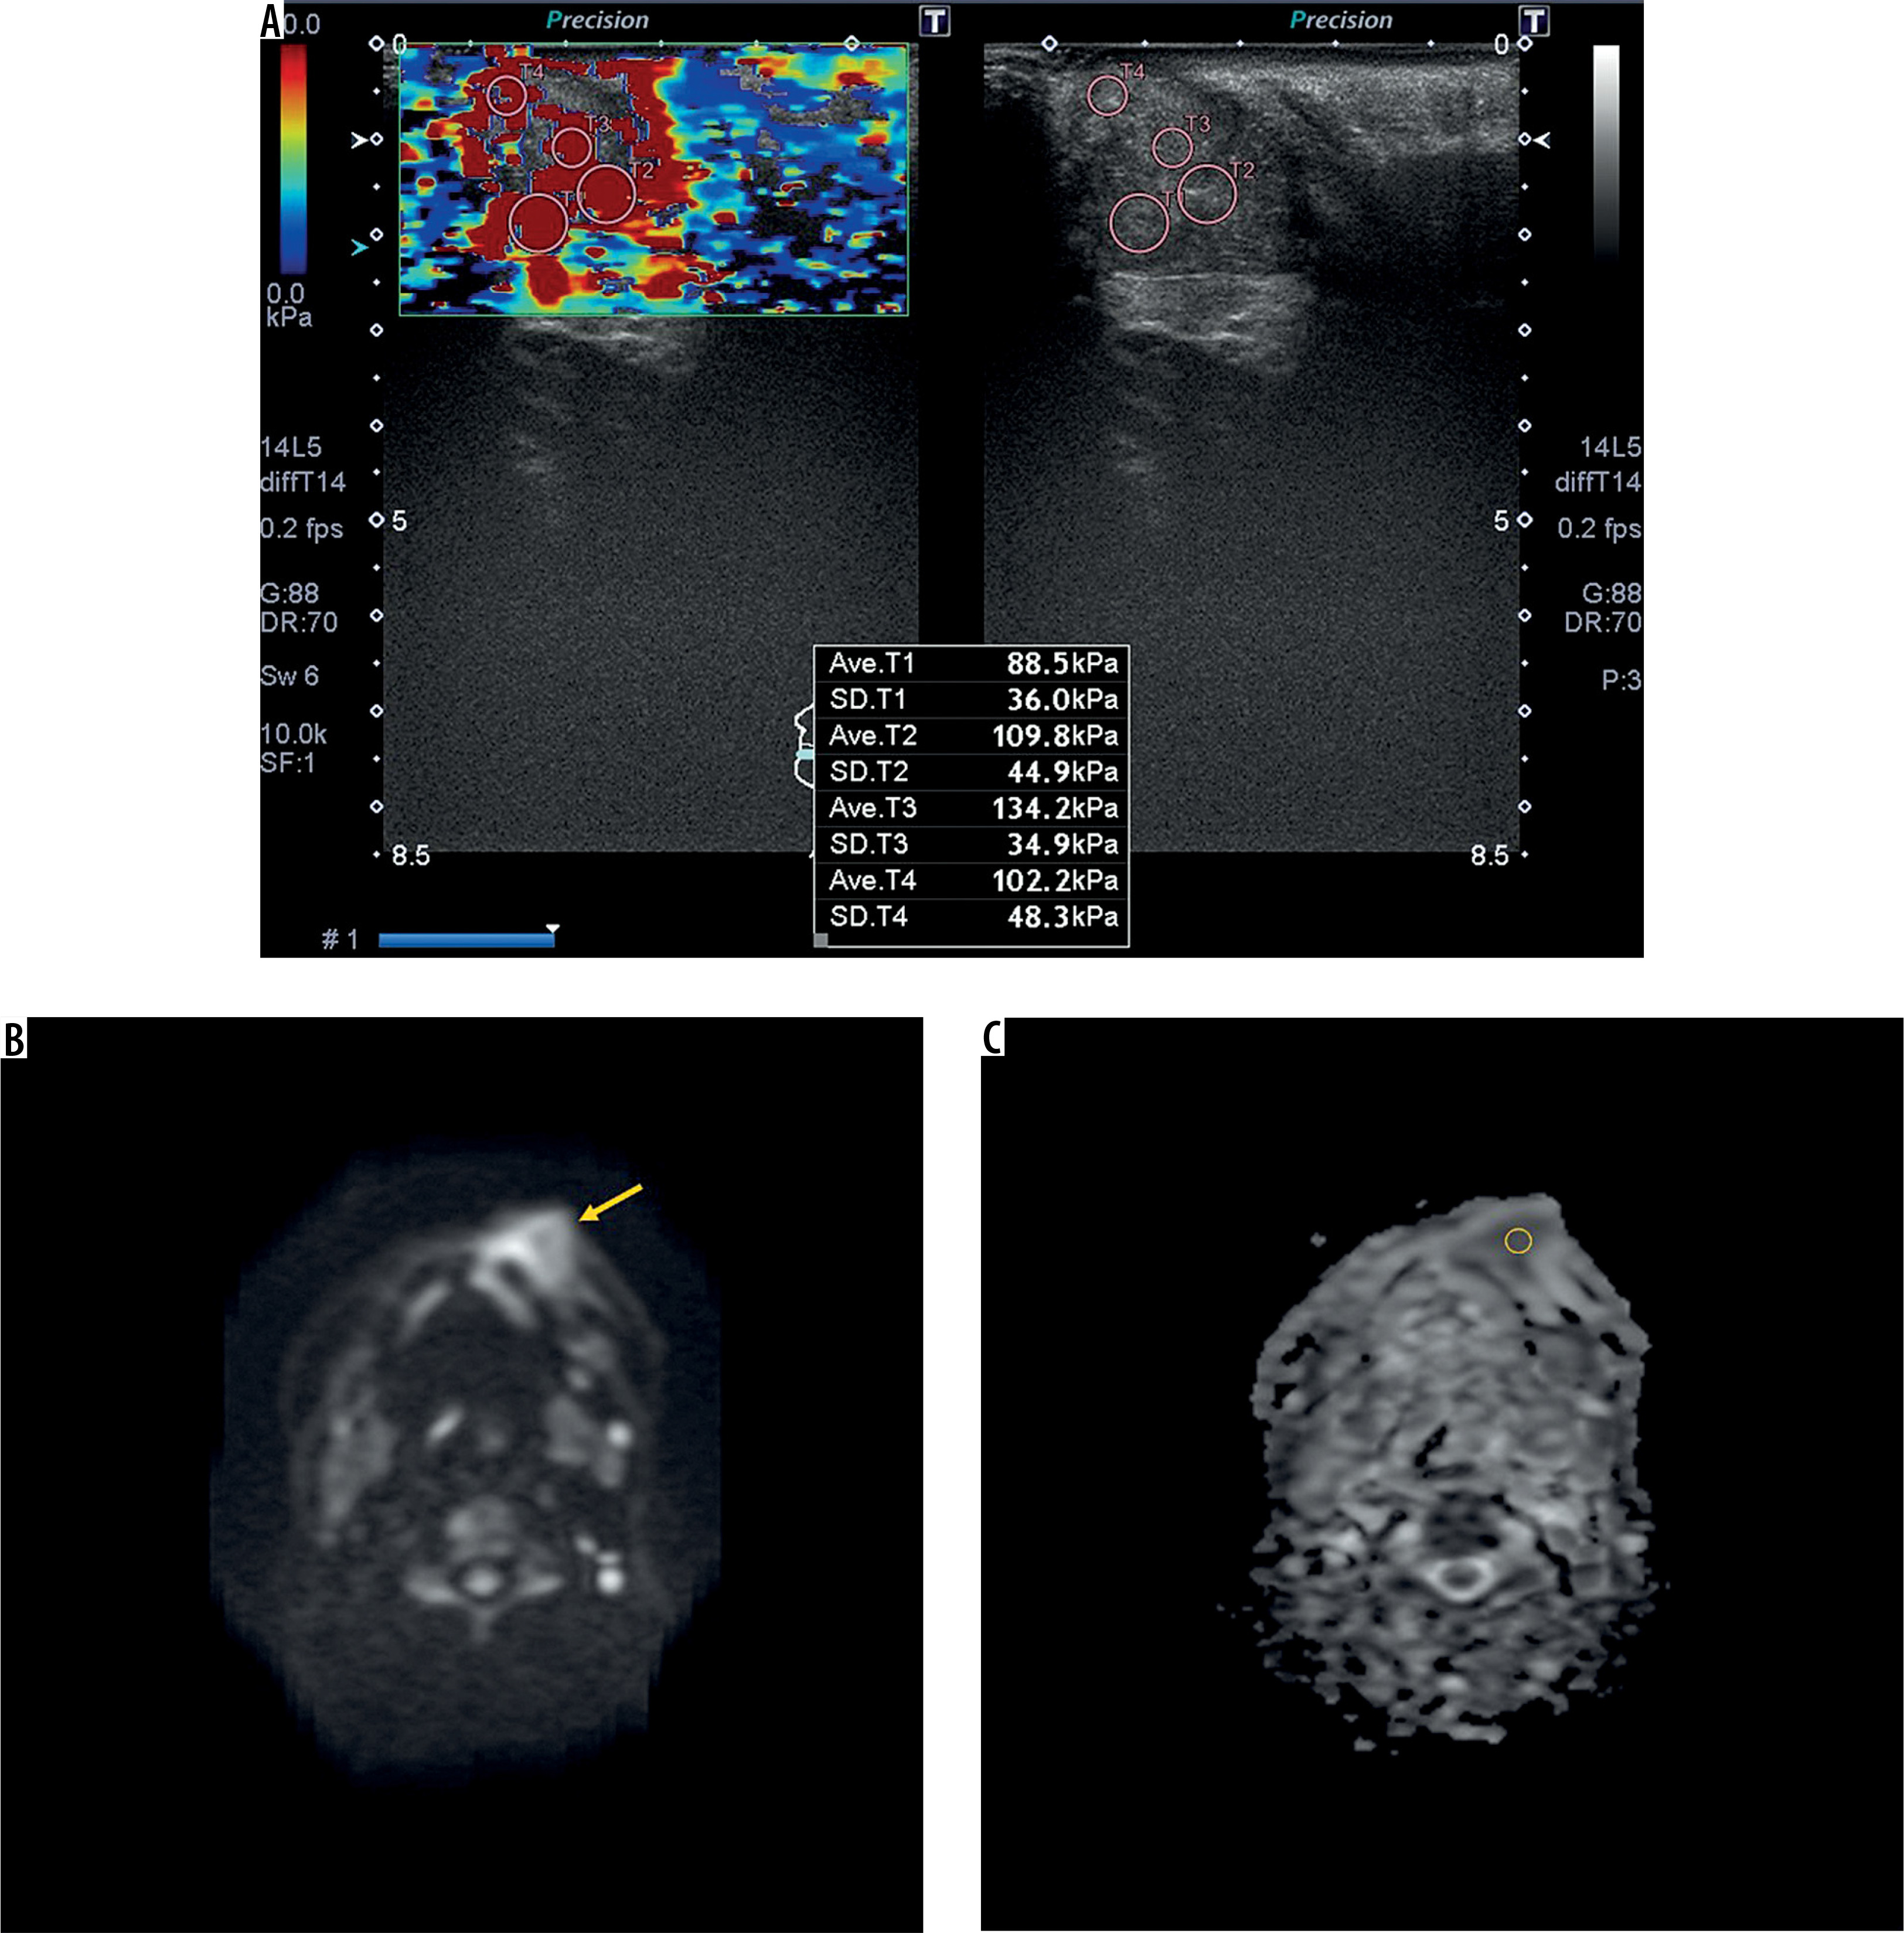
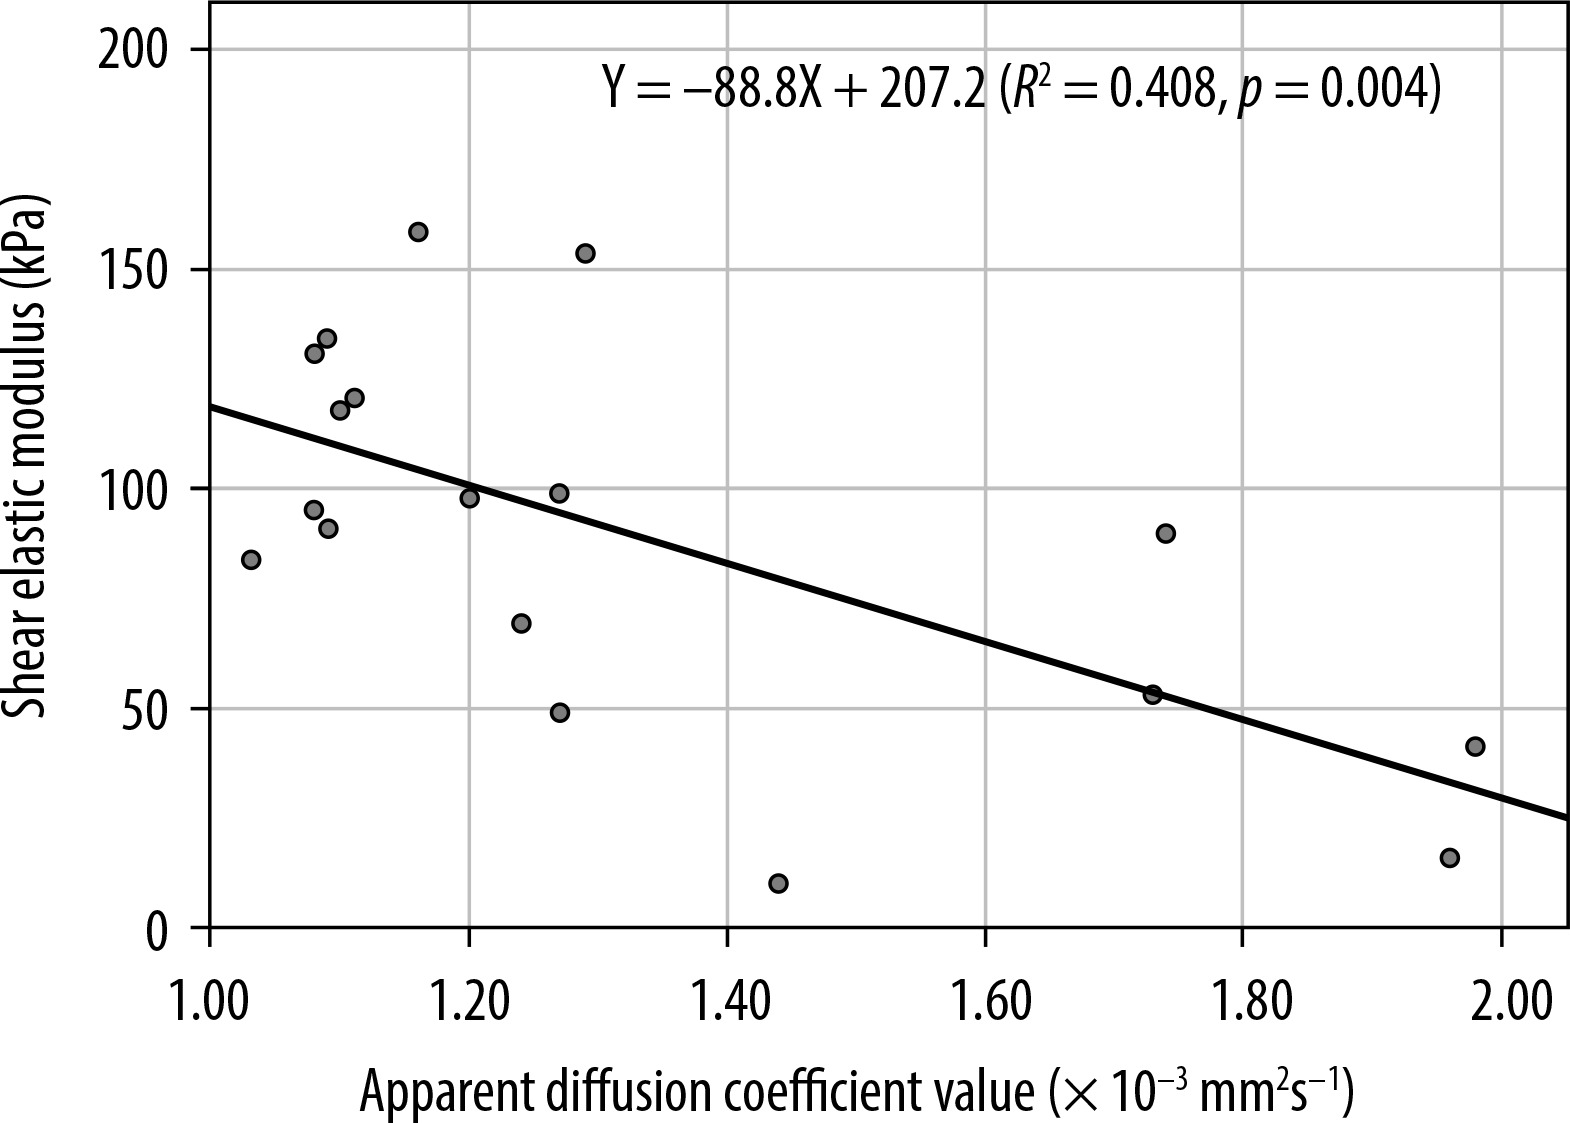
Figures 1-3 show cases of pleomorphic adenoma, schwannoma, and squamous cell carcinoma, respectively. Figure 4 is a scatter diagram showing the relationship between maximum shear elastic modulus and ADC value of the lesions. The ADC value was significantly correlated with shear elastic modulus (Y = –88.8X + 207.2, R2 = 0.408, p = 0.004).
Figure 2
Schwannoma of the right side of the buccal space in a 17-year-old male. Shear wave elastography (A) indicates that the maximum shear elastic modulus of the lesion is 53.3 kPa in the region of interest (ROI). Diffusion-weighted image (B) shows a high-signal intensity area (arrow). Apparent diffusion coefficient (ADC) value of the lesion on an ADC map (C) is 1.73 × 10⁻³ mm2s–1 in ROI
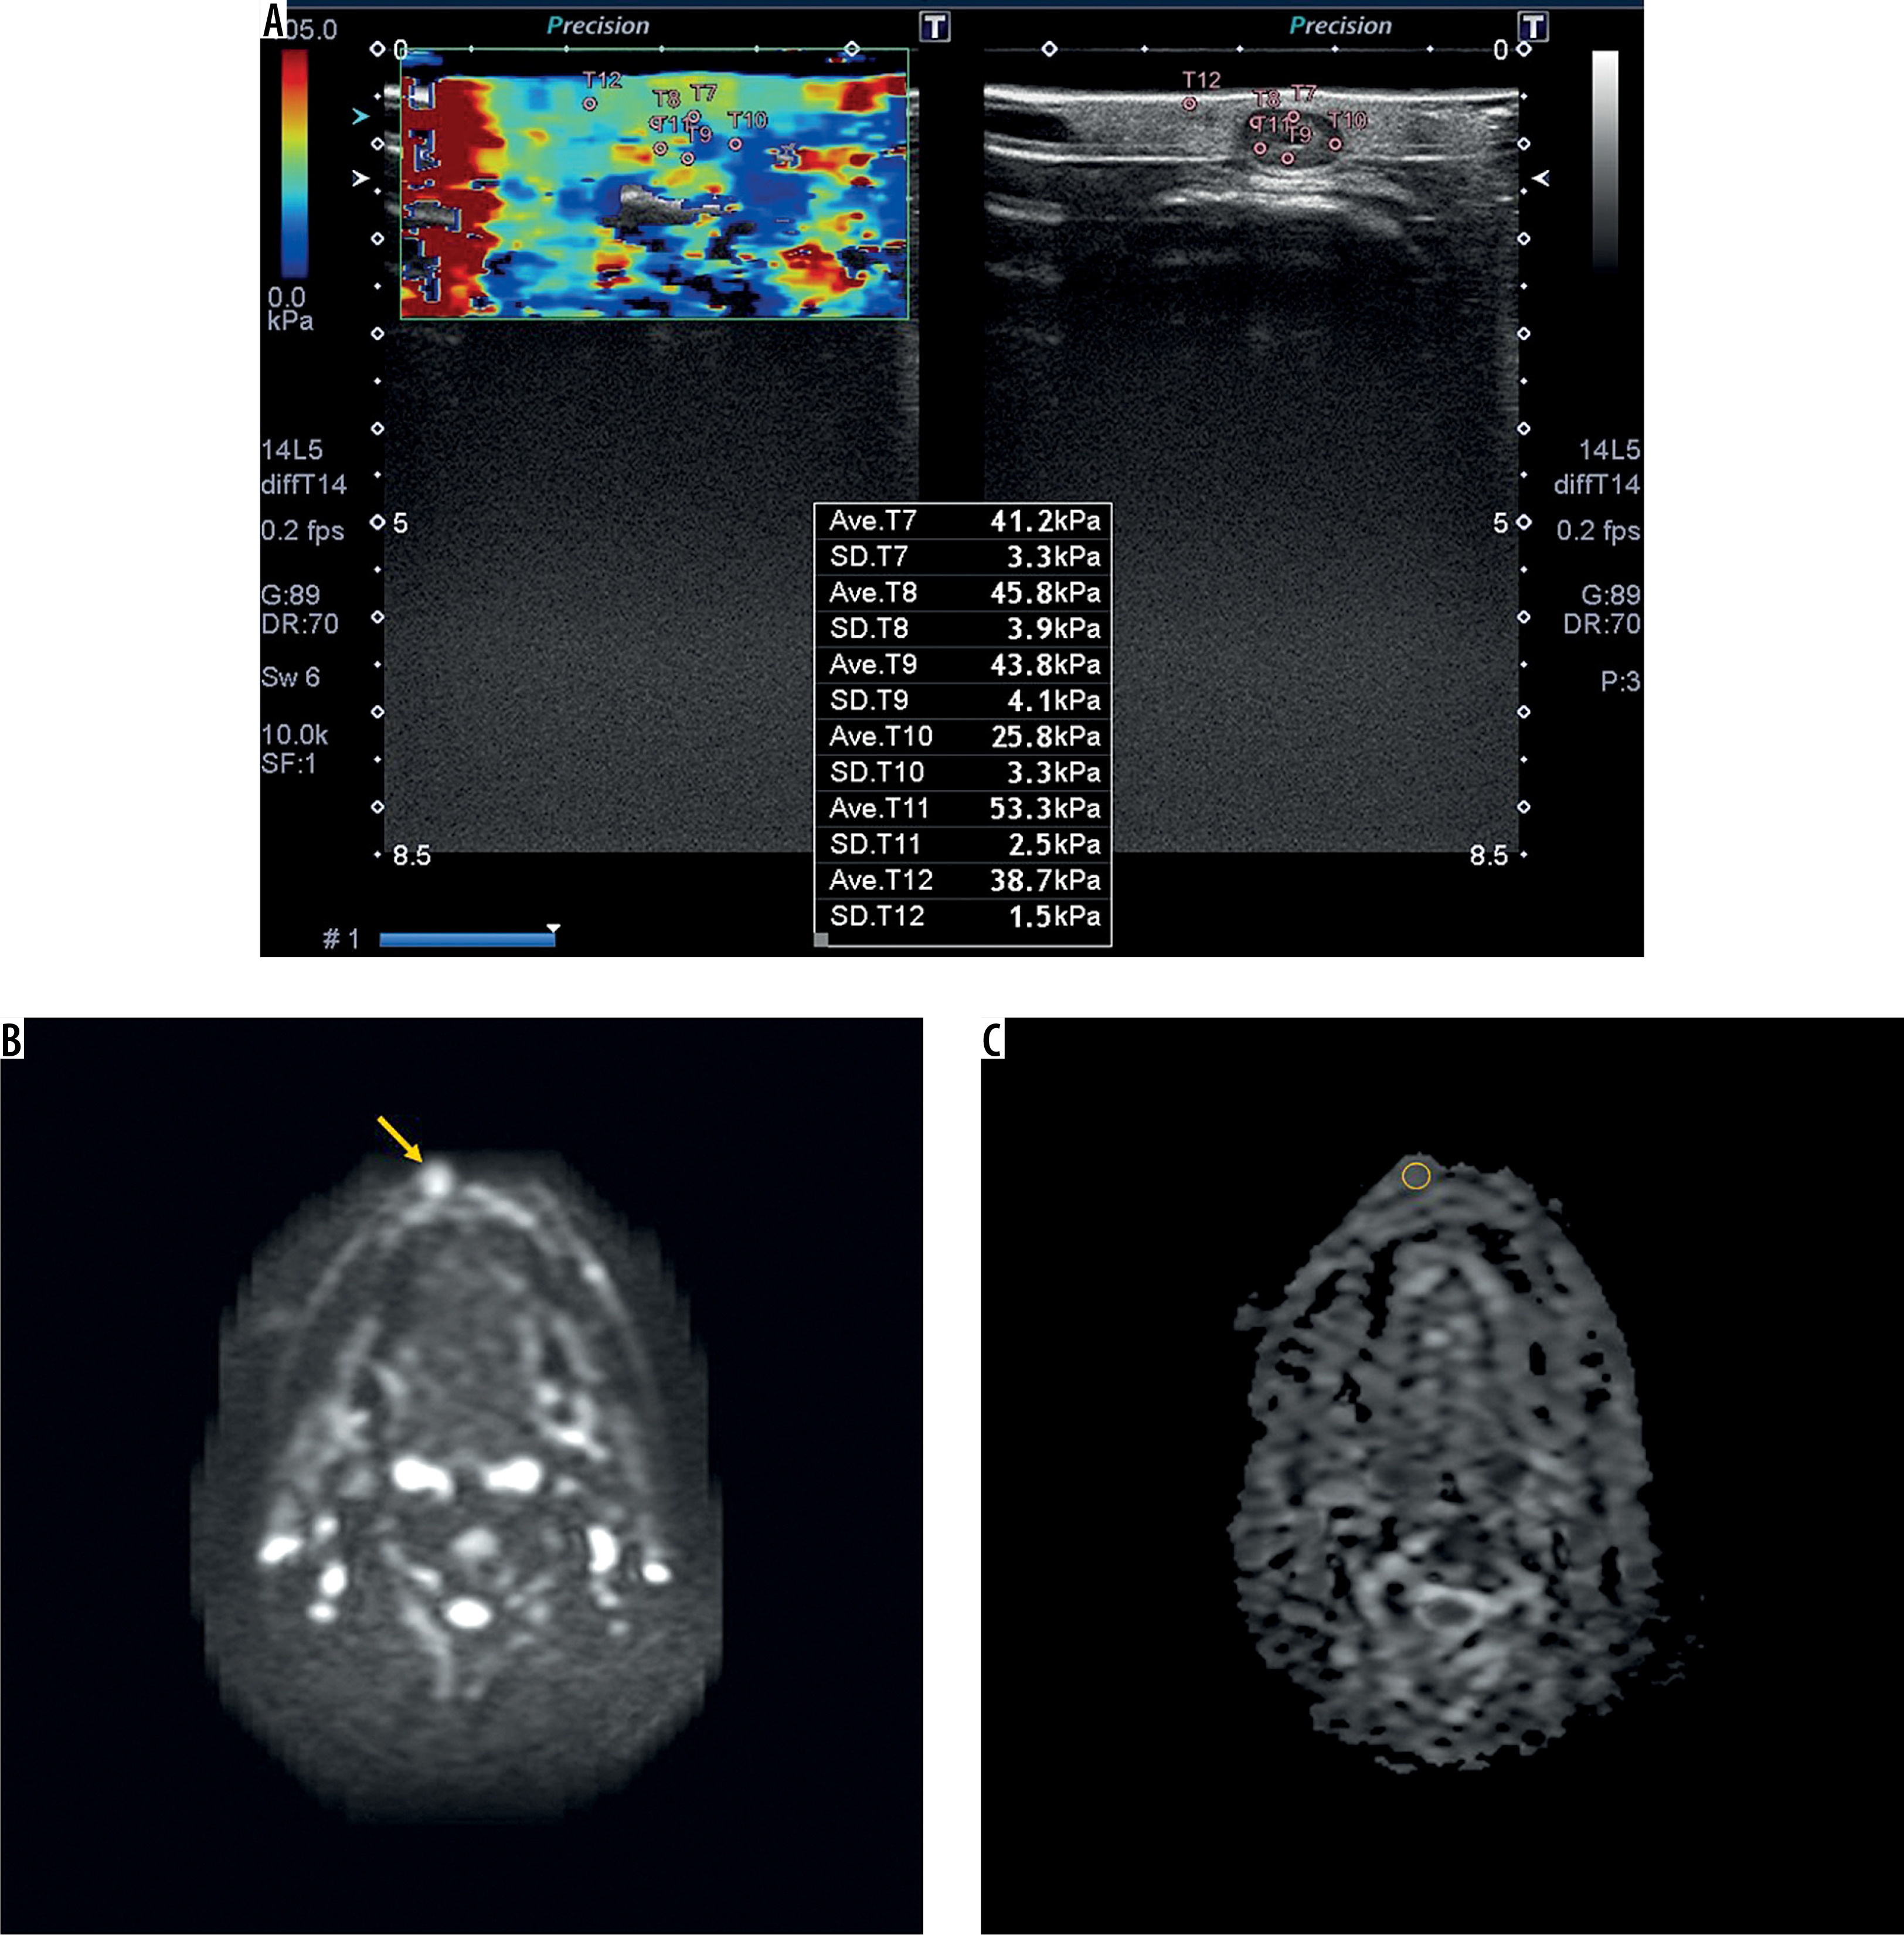
Figure 3
Squamous cell carcinoma of the left side of the buccal space in a 66-year-old female. Shear wave elastography (A) indicates that the maximum shear elastic modulus of the lesion is 134.2 kPa in the region of interest (ROI). Diffusion-weighted image (B) shows a high-signal intensity area (arrow). Apparent diffusion coefficient (ADC) value of the lesion on an ADC map (C) is 1.09 × 10⁻³ mm2s–1 in ROI
Discussion
This study investigated the SWE and DWI for oral carcinoma and benign lesions in buccal, sublingual, and submandibular spaces, and indicated that the shear elastic modulus of the oral carcinoma was higher than those of the benign lesions; the ADC value of oral carcinoma was lower than those of benign lesions; and the ADC value was correlated with shear elastic modulus.
SWE plays an effective role in the quantitative assessment of head and neck lesions [9,10]. Ogura et al. [9] indicated that the shear elastic modulus of the squamous cell carcinoma (109.6 kPa) was higher than that of the benign lesions (46.4 kPa). Sasaki et al. [10] showed that the shear elastic modulus of the malignant cervical lymph nodes (105.9 kPa) was higher than that of benign cervical lymph nodes (11.9 kPa). In this study, the shear elastic modulus of the oral carcinoma (116.6 kPa) was higher than those of the benign lesions (47.0 kPa). We consider that SWE can be effective in the quantitative diagnosis of oral carcinoma and benign lesions.
Şerifoğlu et al. [14] indicated that the ADC value for benign lesions and malignant neoplasms in the head and neck was 1.17 × 10⁻³ mm2s–1 and 0.72 × 10⁻³ mm2s–1, respectively. Surov et al. [20] indicated that the ADC value of benign lesions and malignant neoplasms in the head and neck were 1.46 × 10⁻³ mm2s–1 and 1.04 × 10⁻³ mm2s–1, respectively. Tanabe et al. [21] indicated that the ADC value of benign lesions (2.36 × 10⁻³ mm2s–1) in submandibular and sublingual spaces was higher than those of malignant neoplasms (1.10 × 10⁻³ mm2s–1). In this study, the ADC value of oral carcinoma (1.14 × 10⁻³ mm2s–1) was lower than those of benign lesions (1.62 × 10⁻³ mm2s–1). We consider that the ADC value can be useful for quantitative diagnoses in the buccal, sublingual, and submandibular spaces neoplasms.
No reports have been published on the relationship between shear elastic modulus and ADC for distinguishing between malignant and benign lesions. In this study, the ADC value was correlated with shear elastic modulus (Y = –88.8X + 207.2, R 2 = 0.408). We indicated the relationship between shear elastic modulus and ADC value of the lesions.
There were several limitations to this study. The study included only 18 cases, comprising 11 malignant and 7 benign lesions, which is too small to draw statistically or clinically meaningful conclusions. Moreover, the lesions were located in different anatomical regions, such as the buccal, sublingual, and submandibular spaces, which differ considerably in tissue composition and surrounding structures. However, we consider that our work to be a preliminary study, with novel and clinical relevance.