
Introduction
Following neoadjuvant chemotherapy and surgery, the treated breast often undergoes complex changes that make magnetic resonance imaging (MRI) interpretation challenging, especially when recurrence is suspected. MRI is widely used in this context because it offers greater sensitivity than conventional imaging in differentiating post-treatment tissue changes from residual or recurrent malignancy [1].
Accurate detection of residual disease and determination of its extent are critical for further treatment planning. If no residual disease is present, additional surgery may be unnecessary. However, if a small residual lesion is detected, re-excision prior to radiation therapy may be beneficial. In cases of extensive residual disease, mastectomy might be the preferred treatment option [2].
A regular enhancing rim up to 5 mm in thickness is typically considered negative for residual disease, while an irregular, nodular, or thicker rim (> 5 mm) often indicates residual malignant disease. Additional signs of residual cancer include any enhancing spiculated focal mass, non-circumscribed focal mass with a washout enhancement pattern, or non-mass-like enhancement with regional, segmental, or ductal distribution, especially when accompanied by washout [3].
Accurate identification of residual disease following neoadjuvant chemotherapy (NAC) and breast-conserving surgery remains a considerable diagnostic challenge. Dynamic contrast-enhanced MRI (DCE-MRI) is widely used in this context, showing moderate to high diagnostic performance, but notable limitations persist. A recent meta-analysis of 18 studies (969 patients) reported pooled sensitivity and specificity of 80% (95% CI: 70-88%) and 84% (95% CI: 79-88%), respectively, for DCE-MRI in evaluating pathological response after NAC [4]. Another meta-analysis encompassing 44 studies found a sensitivity of 83-87% but a highly variable specificity (ranging between 54% and 83%) in detecting residual cancer [5]. These figures demonstrate that while DCE-MRI is sensitive, its specificity is inconsistent and often suboptimal.
Alternative imaging approaches also present their own limitations. Diffusion-weighted imaging (DWI), while effective in some response-assessment scenarios, may be confounded by post-treatment inflammation and fibrosis, reducing reliability [6]. Additional advanced tools like MR spectroscopy or PET-MRI, although promising, are limited by high cost, variable availability, and lack of standardised interpretation protocols.
Qualitative assessment of washout kinetics in the post-treatment breast can be challenging. Therefore, incorporating quantitative metrics such as the signal enhancement ratio (SER) can improve diagnostic accuracy in evaluating residual disease [7]. SER, a heuristic imaging parameter derived from dynamic contrast-enhanced MRI, measures the rate of contrast washout in lesions, providing a more objective evaluation [8]. SER provides numerical indices that capture dynamic tissue characteristics. This technique has the potential to reduce subjectivity, improve specificity, and enhance reproducibility in detecting residual malignancy.
Therefore, this technical note aims to describe our initial institutional use of voxel-wise SER mapping on 3T DCE-MRI for evaluating residual breast cancer after treatment (following breast-conserving surgery and neoadjuvant chemotherapy). We present feasibility data from a small pilot cohort to demonstrate that SER mapping may serve as a valuable quantitative adjunct in post-treatment breast imaging, setting the stage for future larger validation studies.
Material and methods
This retrospective, single-centre pilot study was conducted at a tertiary care teaching hospital in central India over a 17-month period. The radiology information system (RIS) and picture archiving and communication system (PACS) were queried to identify all bilateral breast MRI examinations performed for post-treatment evaluation after breast-conserving surgery or neoadjuvant chemotherapy during the study window. Electronic medical records and pathology databases were reviewed to verify treatment status and outcomes.
Fourteen women met the inclusion criteria. Eligible cases were those with (i) dynamic contrast-enhanced MRI (DCE-MRI) performed at 3T for suspected residual disease following breast-conserving surgery or neoadjuvant chemotherapy and (ii) a reference standard available, defined as histopathology within a reasonable interval (n = 12) or imaging stability at ≥ 12 months with no clinical evidence of recurrence (n = 2).
Exclusion criteria were incomplete DCE-MRI protocol, suboptimal fat suppression or severe motion artefact precluding analysis, missing pre- or late-post-contrast time points required for SER computation, and absence of reference standard.
All studies were acquired on a 3T scanner (DISCOVERY MR750W; GE Healthcare). Intravenous gadodiamide (Omniscan, GE Healthcare) was administered at 0.1 mmol/kg via power injector at 3 ml/s, followed by a 10 ml saline flush. Axial fat-suppressed high-resolution T1-weighted 3D fast gradient-echo images (VIBRANT™) were obtained at pre-contrast and at 68, 136, 203, 271, and 340 seconds post-contrast with the following parameters: TR/TE 4.8/1.7, flip angle 10°, 2-mm slice thickness, 35 × 35 cm FOV, and 256 × 254 matrix. Post-processing included subtraction and maximum intensity projection (MIP) reconstructions.
SER, a unitless parameter quantifying contrast washout kinetics, was calculated on a voxel-wise basis using the following formula:
where S0 – pre-contrast signal, S1 – signal at 68 s, and S2 = signal at 340 s post-contrast. Using READY View Volume Viewer (Version 14.0, GE Healthcare), an SER colour map was generated from these voxel-wise calculations.
Suspicious enhancement (rim enhancement around the operative cavity, focal mass, or non-mass-like enhancement) was first localised on subtraction images. A small, circular two-dimensional region of interest (ROI) was then manually placed on the corresponding area of peak enhancement within the SER colour map, avoiding necrosis (including fat necrosis), vessels, fat, and susceptibility artefacts. To minimise measurement variability, a single reader (a radiologist with more than 10 years’ experience) performed all measurements in one session using a consistent ROI approach. The radiologist was blinded to final histopathological outcomes at the time of SER ROI placement and quantitative analysis.
The radiologist had access to clinical information and prior imaging that were available during routine clinical interpretation, including knowledge of prior surgery or neoadjuvant chemotherapy and the location of the operative bed. Final histopathology and long-term follow-up outcomes were not available to the reader during SER assessment.
For the reference standard, histopathology from re-excision or mastectomy served as the determinant of residual disease when available. In patients without further surgery, absence of residual disease was defined by radiologic stability on MRI at ≥ 12-month follow-up and concordant clinic records. The reader performing the SER measurements was not privy to the final histopathology at the time of ROI placement; clinical details available at the time of the clinical MRI interpretation were permitted.
Statistical analysis treated SER as a non-normally distributed variable. Group comparisons between residual-disease and no-residual groups used the Mann-Whitney U test, and they are reported as medians with interquartile ranges (IQR) and ranges. Diagnostic performance of SER was evaluated using receiver operating characteristic (ROC) analysis with calculation of the area under the curve (AUC). Exact (Clopper-Pearson) 95% confidence intervals were computed for sensitivity, specificity, positive predictive value, and negative predictive value at prespecified and data-driven thresholds. A clinically pragmatic cut-off SER threshold by Youden’s index was evaluated. Two-sided p values < 0.05 were considered statistically significant.
Institutional Human Ethics Committee, All India Institute of Medical Sciences, Bhopal approved this retrospective study (approval number: IHEC-LOP/MD0095) and waived the requirement for informed consent owing to use of de-identified data and minimal risk, in accordance with the Declaration of Helsinki.
Results
A total of 14 patients were included in the study. Among them, 11 were diagnosed with invasive ductal carcinoma (IDC), 1 with IDC and ductal carcinoma in situ (DCIS), 1 with minimally invasive ductal carcinoma, and 1 with mucinous carcinoma. Twelve patients underwent breast-conserving surgery (BCS), while 2 were treated with neoadjuvant chemotherapy (NACT) alone. Following MRI evaluation for suspected residual disease, 12 patients underwent additional surgery: 7 underwent modified radical mastectomy (MRM) and 5 underwent re-excision. Histopathology revealed residual tumour in 4 patients, while 8 had no residual disease. The remaining 2 patients, who did not undergo further surgery, were followed up with imaging at 6 and 12 months, confirming lesion stability and absence of residual disease.
In summary, 4 out of 14 patients (29%) had residual disease, while 10 patients (71%) showed no residual disease.
The interval between BCS or NACT and post-treatment MRI ranged from 17 days to 18 months. The median interval was 2 months, with an IQR of approximately 1 to 4 months. Among patients in the BCS group, four patients underwent adjuvant radiotherapy prior to MRI. In these patients, the interval between completion of radiotherapy and MRI ranged from 2 to 16 months, with a median interval of 10 months (IQR: approximately 6.5-13 months).
Imaging findings
In the post-BCS group (n = 12), imaging findings comprised postoperative cavities in 7 patients, non-mass enhancement (NME) in 4 patients, and a discrete mass in 1 patient.
The maximum lesion dimensions for mass and NME lesions in the post-BCS group ranged from 21 to 43 mm, with a median size of 26 mm (IQR: 25-41 mm).
Postoperative cavity sizes in the BCS group ranged from 17 to 45 mm, with a median cavity size of 22 mm (IQR: 19-23 mm). The corresponding cavity wall thickness ranged from 1.8 to 9.4 mm, with a median thickness of 3.7 mm (IQR: 2.7-7.4 mm).
In the post-NACT group (n = 2), both patients demonstrated mass-like residual lesions, measuring 56 mm and 67 mm, with a median size of 61.5 mm.
The ROI dimensions for SER measurement across all cases ranged from 4.0 to 25.0 mm2, with a median ROI size of 6.5 mm2 (IQR: 5.1-10.3).
Signal enhancement ratio analysis
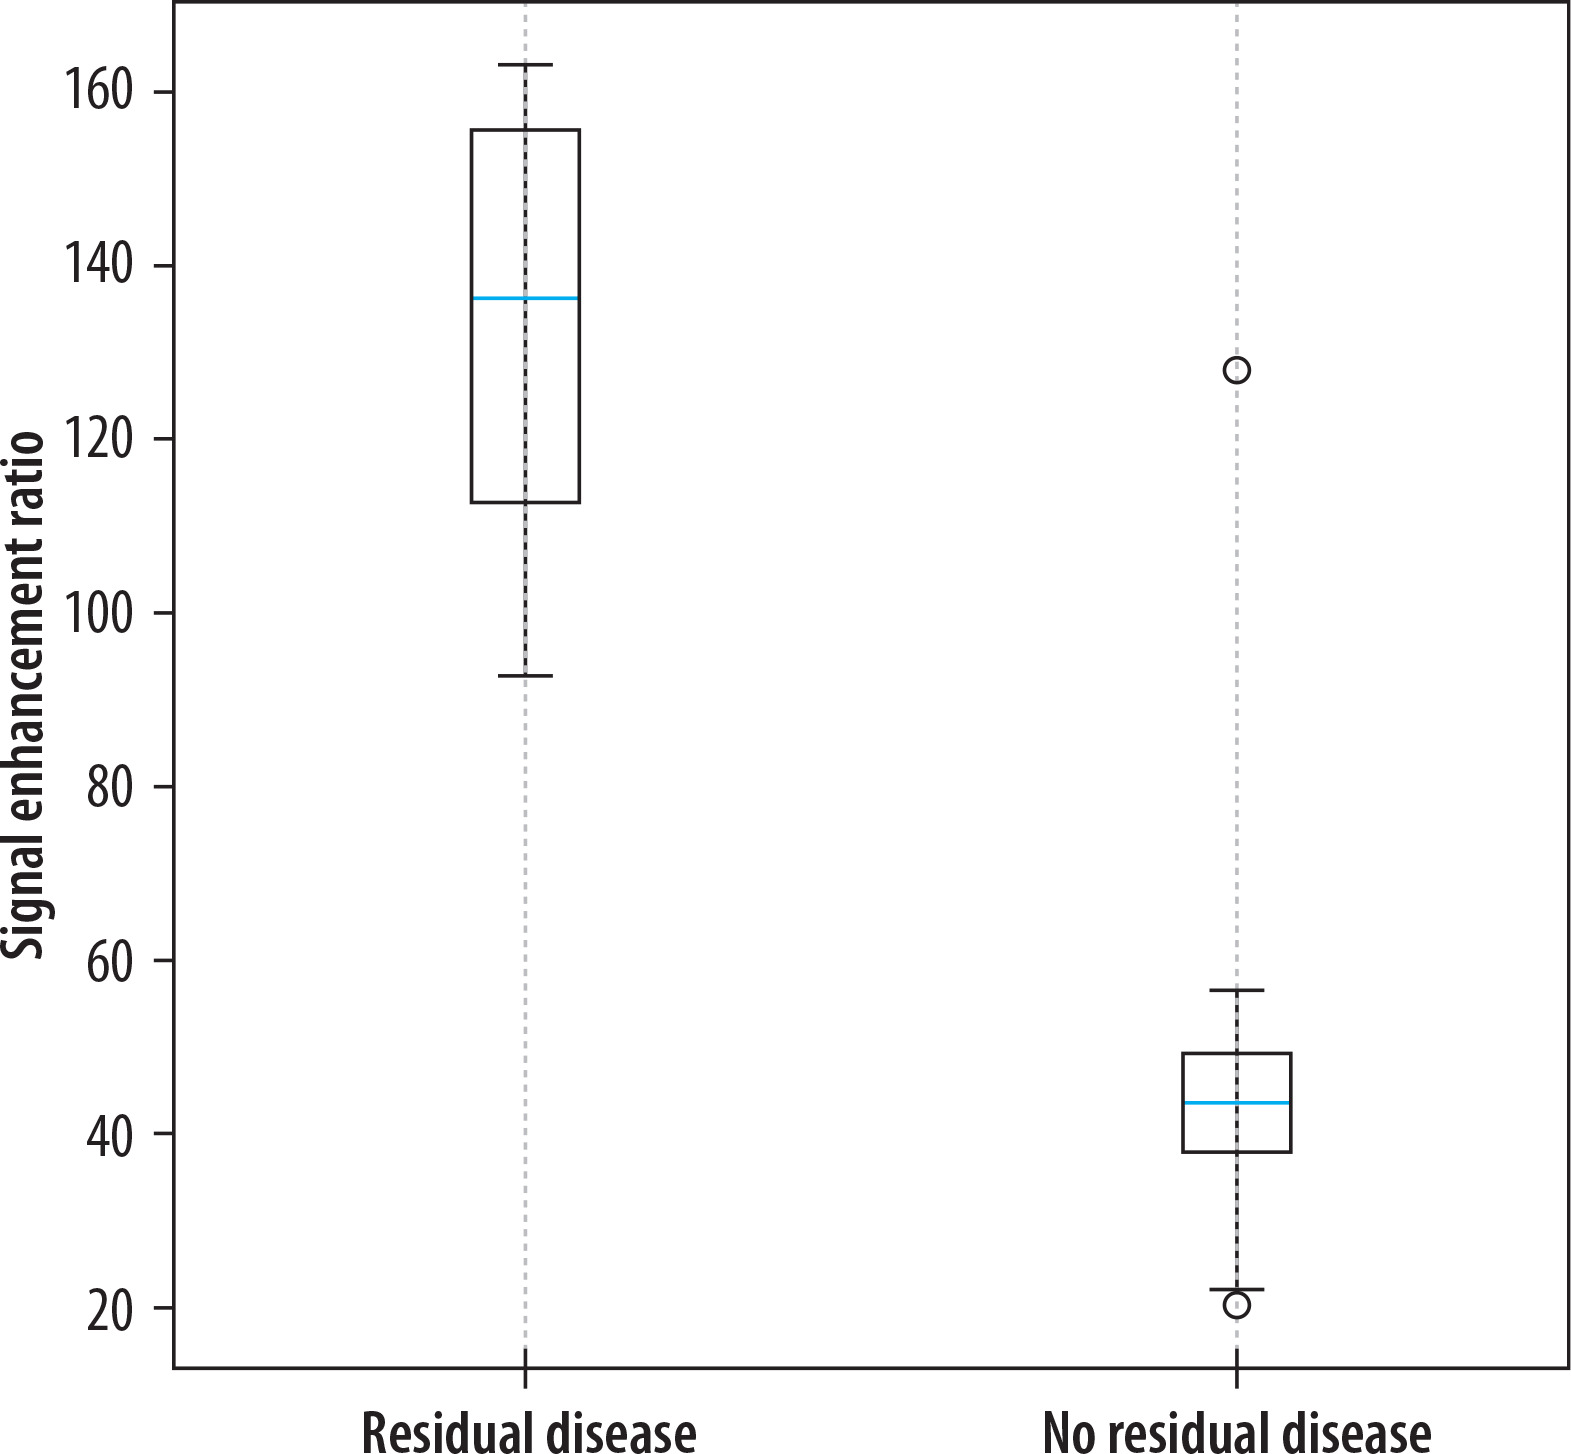
Signal enhancement ratio analysis revealed significantly higher values in patients with confirmed residual disease compared with those without (Table 1). Patients without residual disease (n = 10) had a median SER of 44.0 (IQR: 11.3; range 20.3-128.0). In contrast, patients with residual disease (n = 4) had a median SER of 136.2 (IQR: 42.7; range 93.0-163.0). This difference was statistically significant (p < 0.05, Mann-Whitney U test).
Table 1
Comparison of signal enhancement ratio (SER) values in patients with and without residual disease
| Parameter | Residual disease (4/14) | No residual disease (10/14) | P value (Mann-Whitney U test) |
|---|---|---|---|
| Median SER with interquartile range | 136.2 (42.78) | 44.0 (11.3) | < 0.05 |
When morphology alone – such as thick or irregular rim enhancement and nodular or non-mass-like enhancement – was used as the diagnostic criterion, sensitivity reached 100% (95% CI: 39.8-100), but specificity was only 50% (95% CI: 18.7-81.3).
By applying an SER cut-off value of 90, sensitivity remained at 100% (95% CI: 39.8-100), while specificity improved to 90% (95% CI: 55.5-99.7) (Table 2).
Table 2
Diagnostic performance of morphology vs. signal enhancement ratio (SER) (cut-off = 90)
On ROC analysis, SER demonstrated excellent discriminatory ability with an AUC of 0.95.
The boxplot in Figure 1 clearly illustrates the upward shift in SER distribution among patients with residual disease.
Figure 1
Boxplot demonstrating the distribution of signal enhancement ratio (SER) values in patients with and without residual disease. Patients with residual disease exhibited significantly higher SER values compared with those without residual disease with minimal overlap between groups
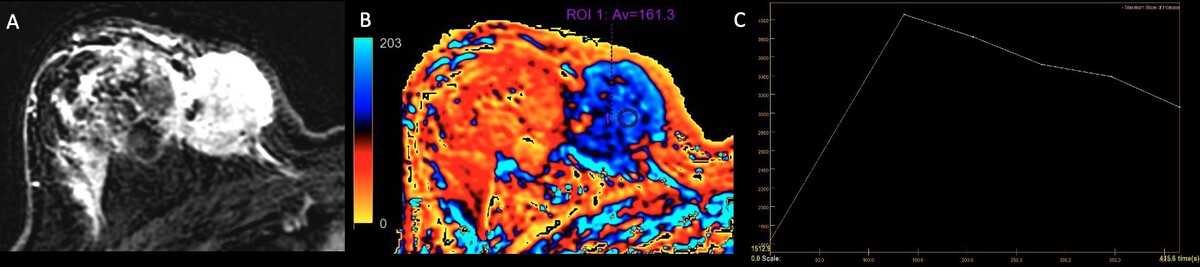
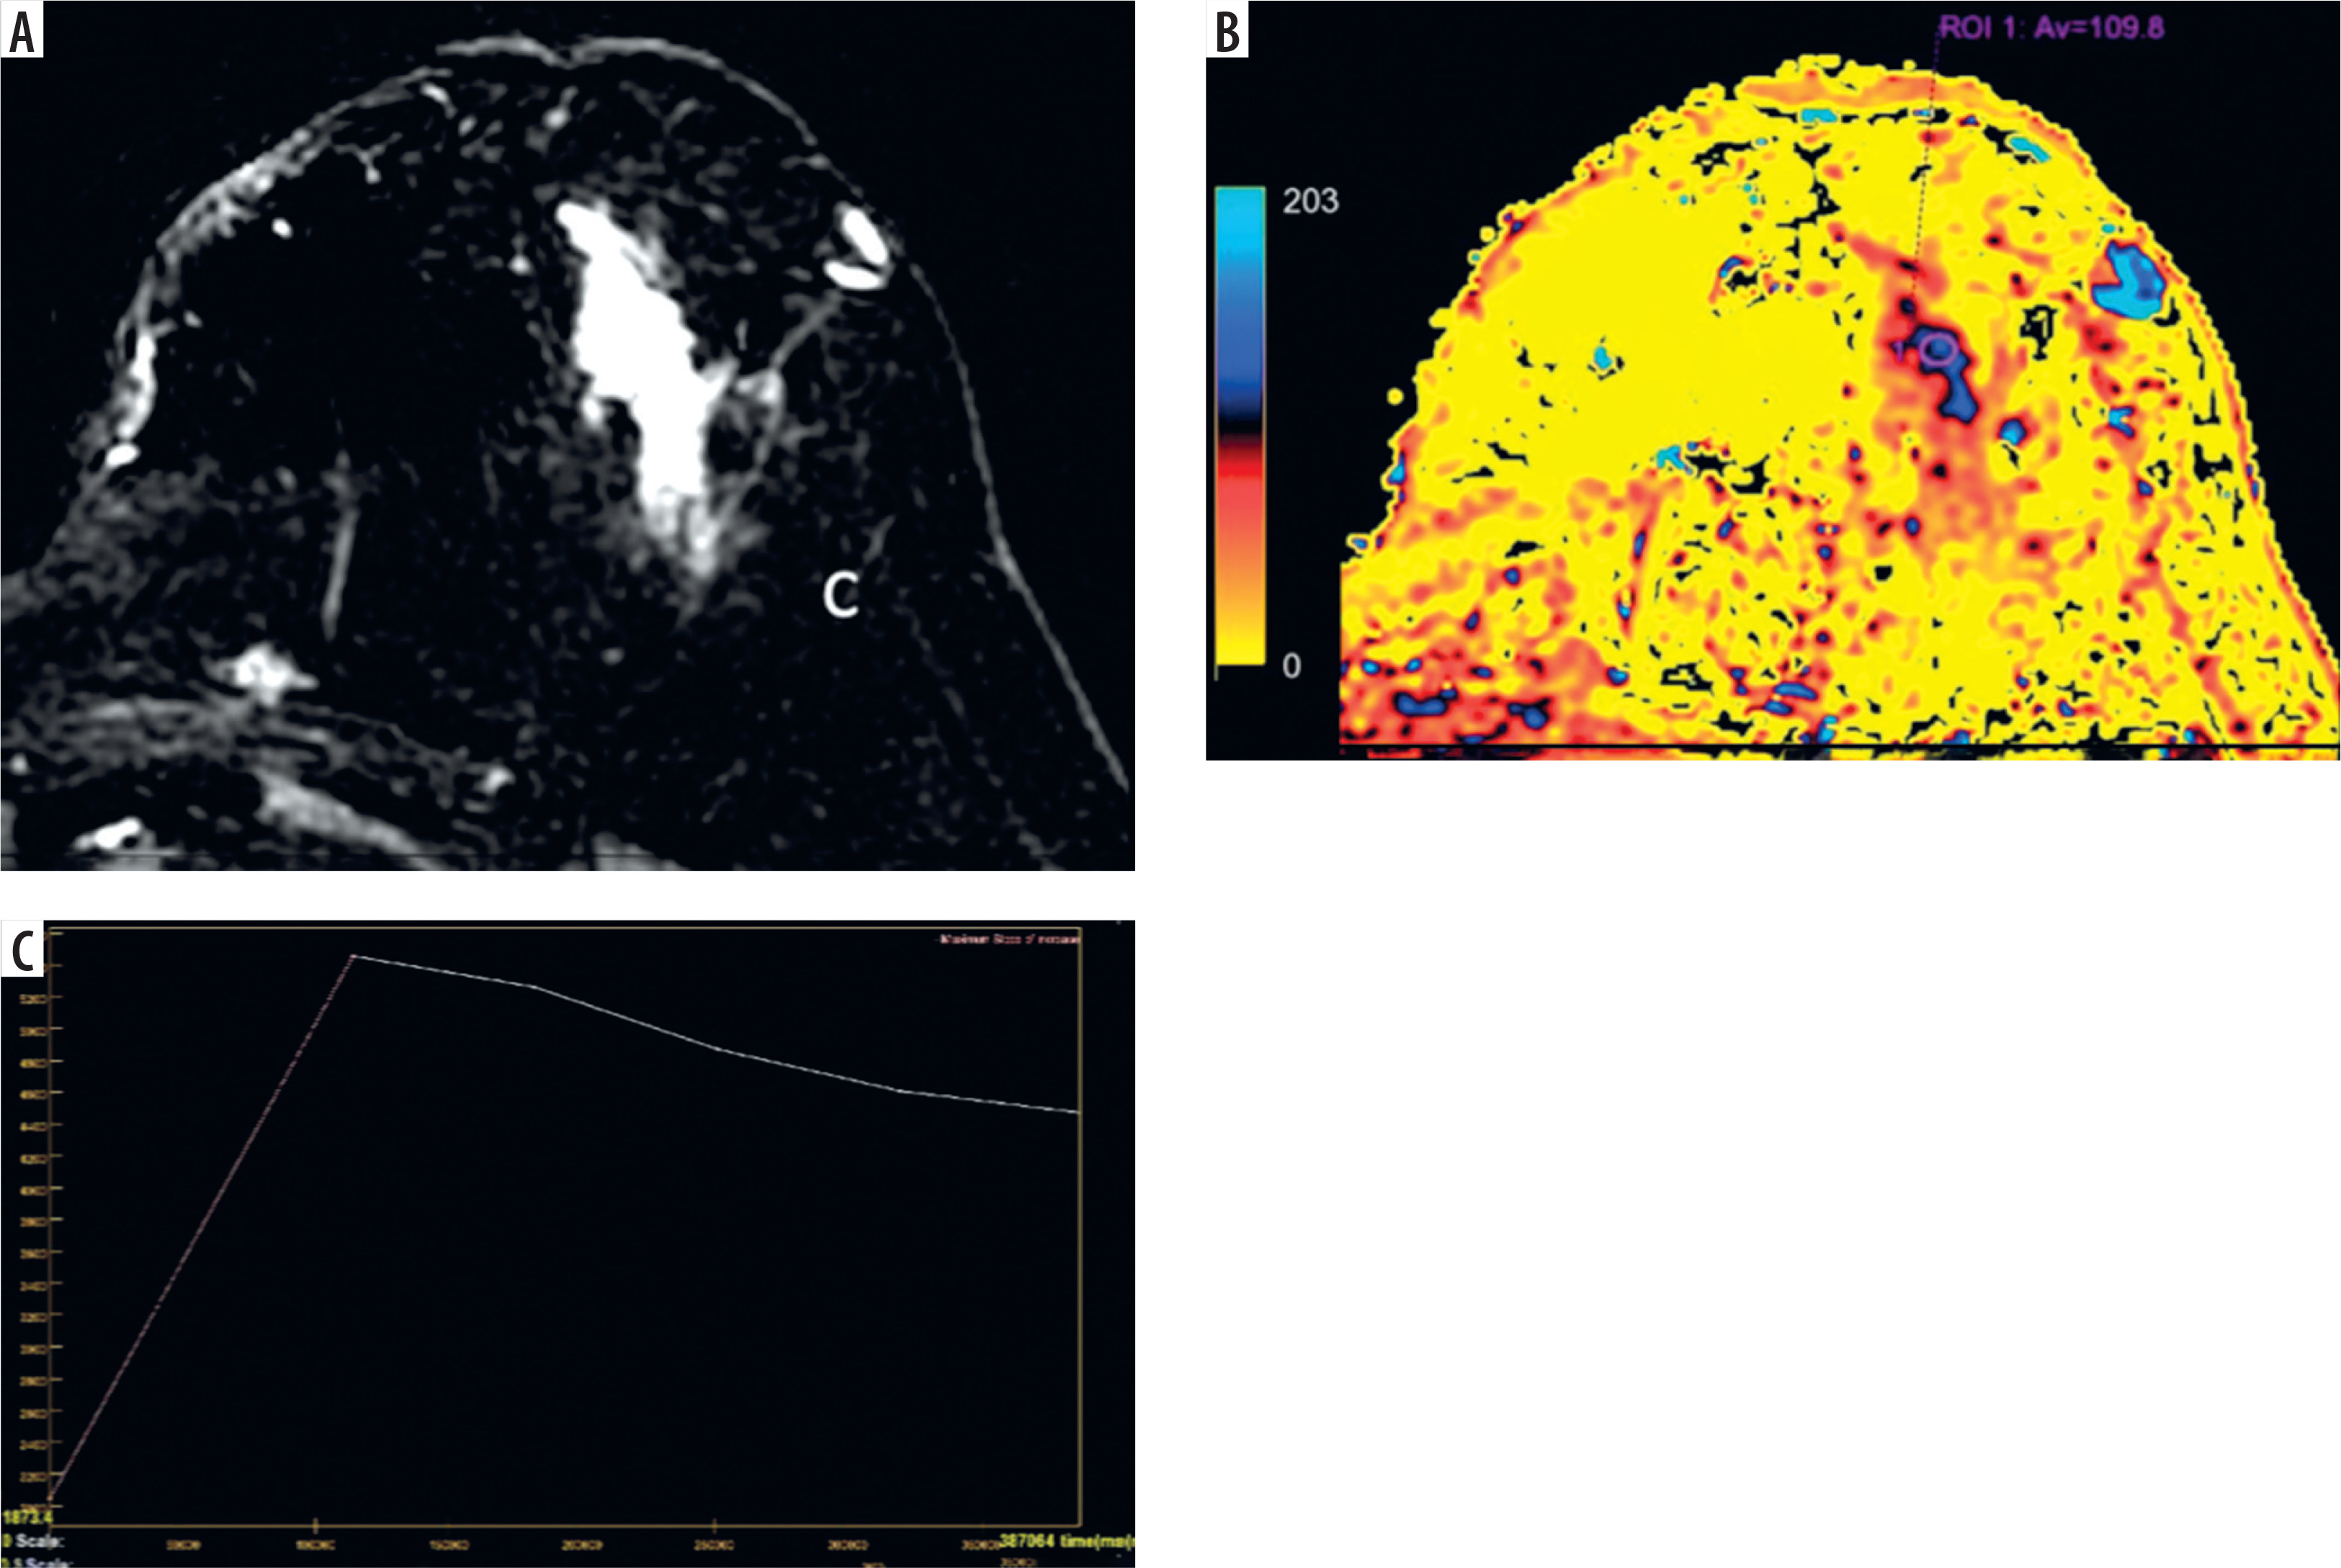
Representative imaging examples are shown in Figures 2-6. Cases with residual disease demonstrated high SER values with corresponding areas of increased enhancement on the SER maps and rapid washout on kinetic curves (Figures 2, 5, and 6). In contrast, two cases showed irregular rim or mass-like enhancement on subtraction images, raising suspicion morphologically, but the SER values remained low with persistent enhancement kinetics, and histopathology confirmed absence of residual tumour (Figures 3 and 4). These findings illustrate how quantitative SER analysis reduced false-positive interpretations compared with morphology alone.
Figure 2
A 29-year-old female patient who had undergone 6 cycles of neoadjuvant chemotherapy for infiltrating ductal carcinoma. A) Subtraction image shows a large heterogeneously enhancing residual mass with irregular shape and spiculated margins. B) SER map shows corresponding area of increased SER (blue-coloured area) with an absolute value of 161.3 obtained using small-sized 2D ROI. C) Corresponding kinetics analysis shows rapid contrast enhancement and washout. The patient further underwent modified radical mastectomy, which revealed residual invasive mammary carcinoma with minimal treatment effect in the breast (Residual cancer burden class III)
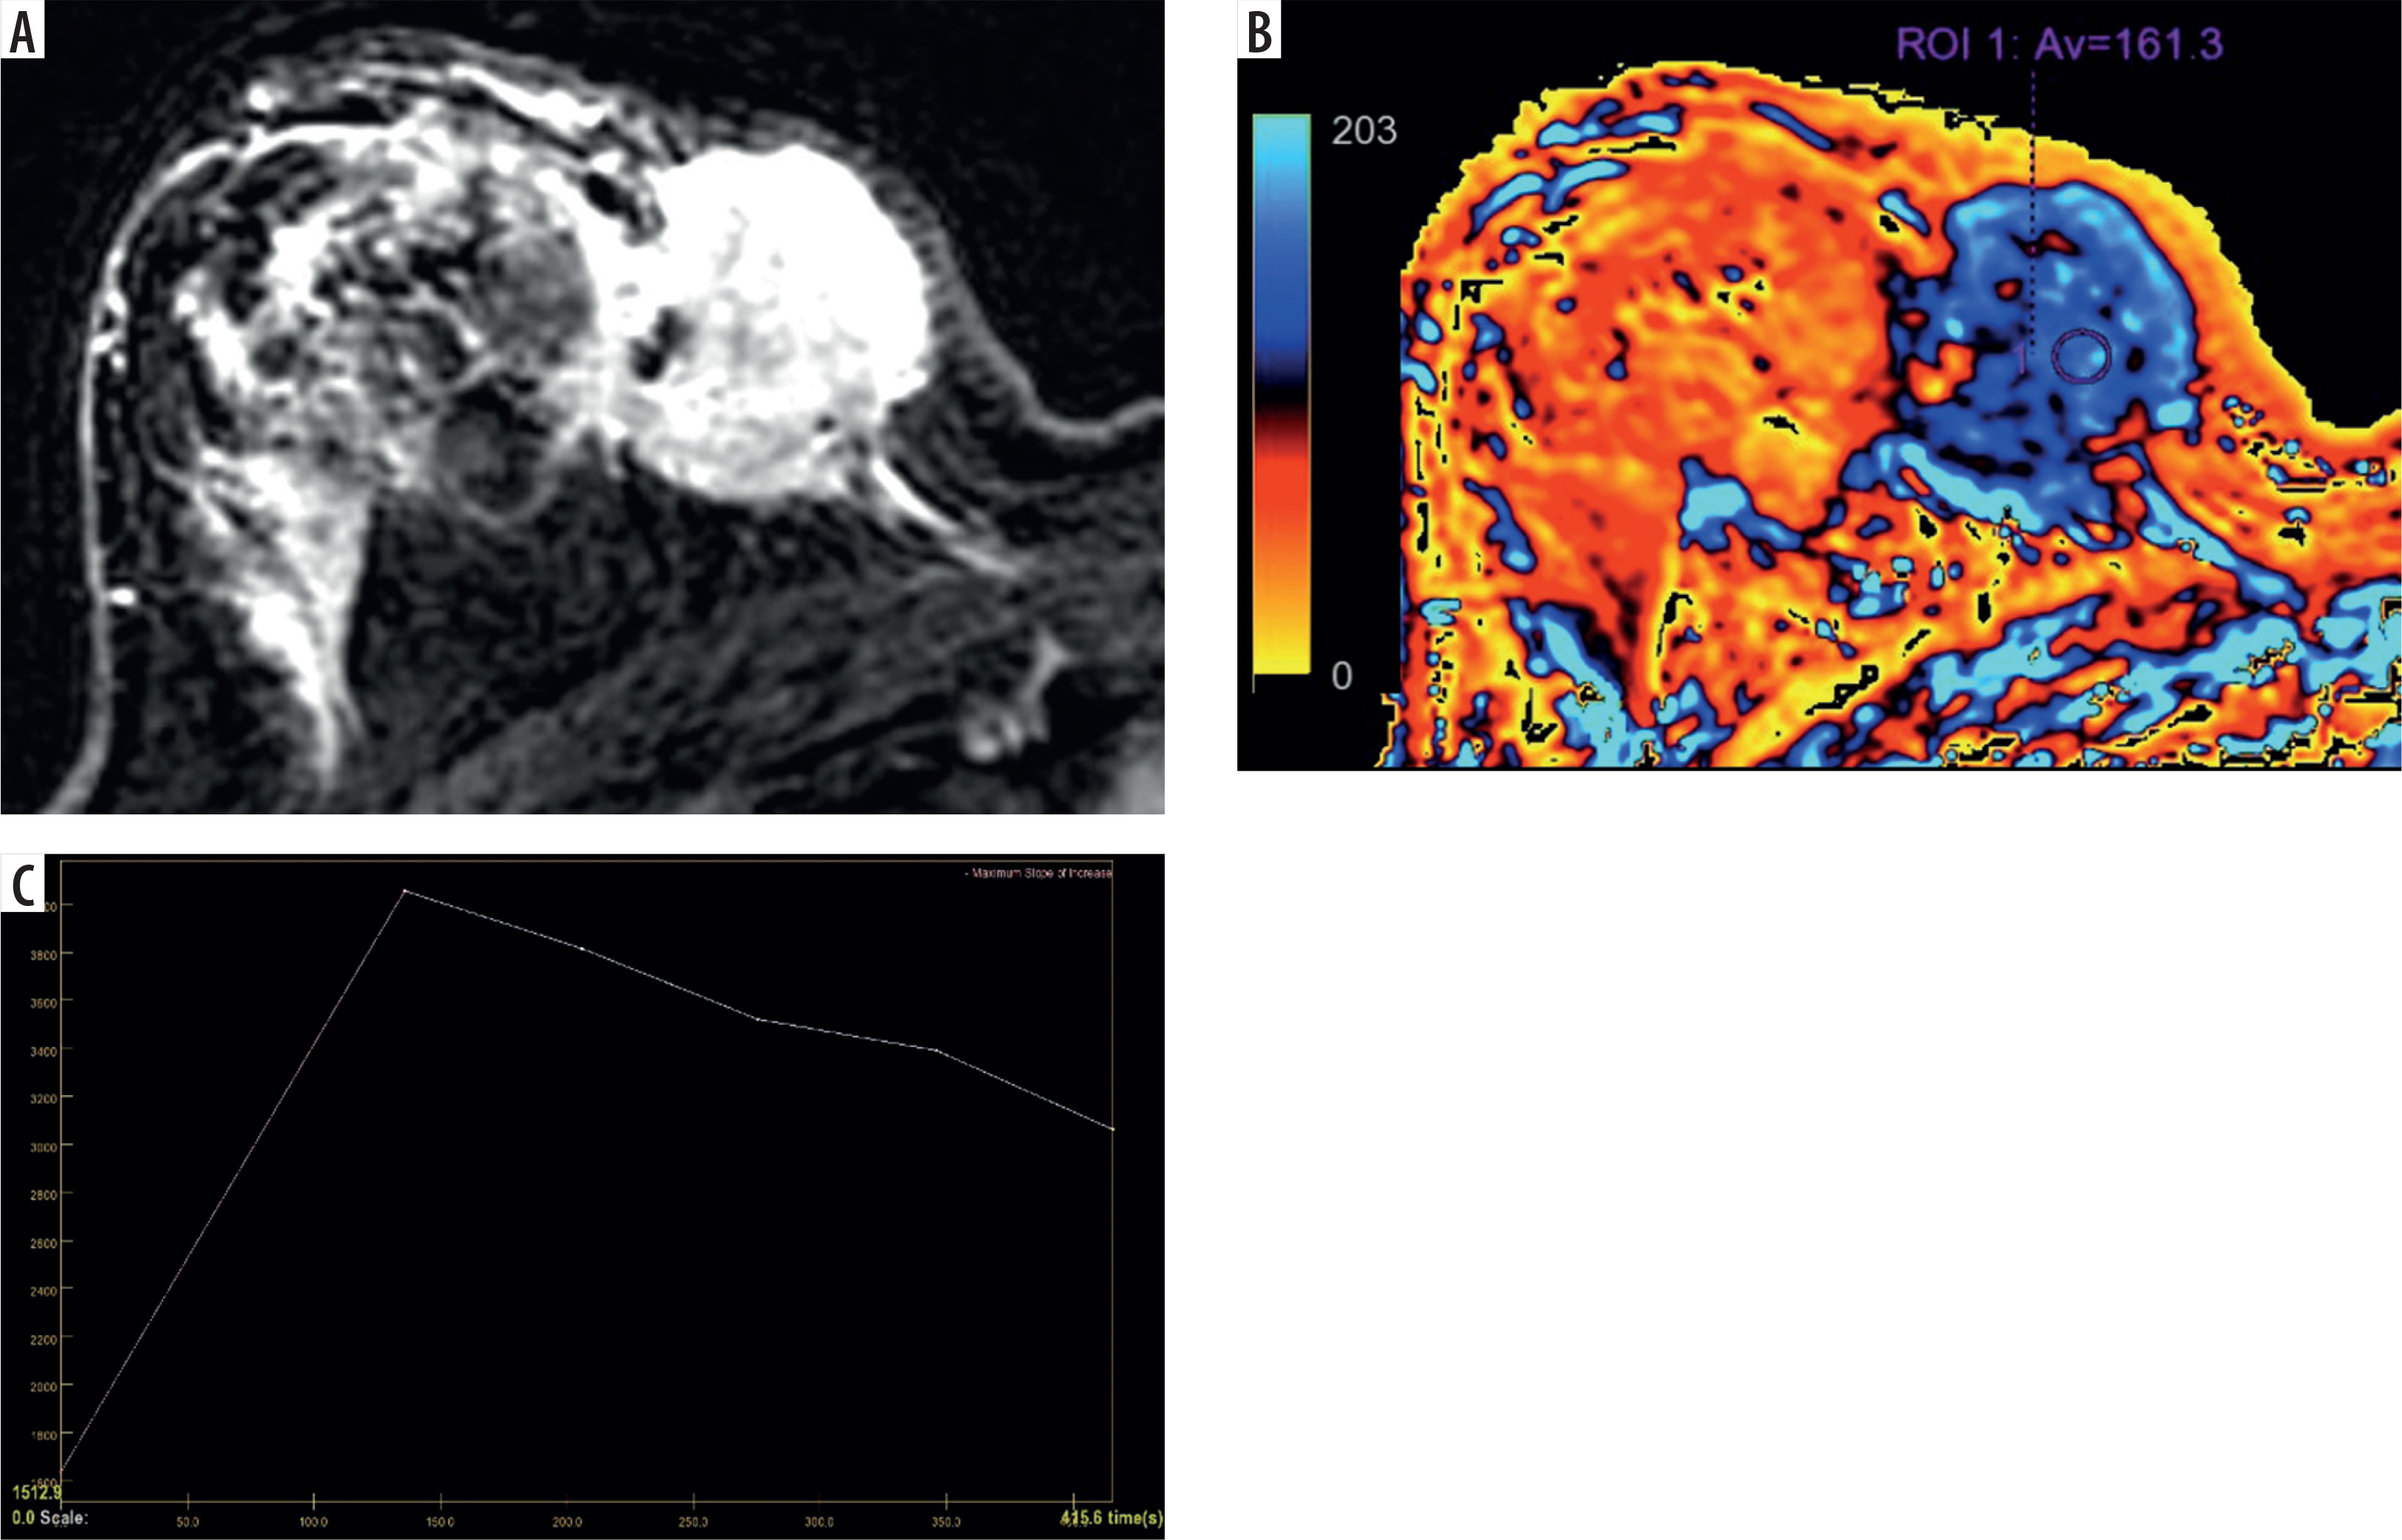
Figure 3
A 40-year-old female patient who had undergone 6 cycles of neoadjuvant chemotherapy for infiltrating ductal carcinoma. A) Subtraction image shows enhancing mass with irregular shape and spiculated margins with thick irregular rim enhancement. B) SER map shows no corresponding area of increased SER with a very low average value of 21.05. C) Kinetics analysis demonstrates persistent enhancement. The patient further underwent modified radical mastectomy, and histopathology revealed no residual tumour (Residual cancer burden class 0)
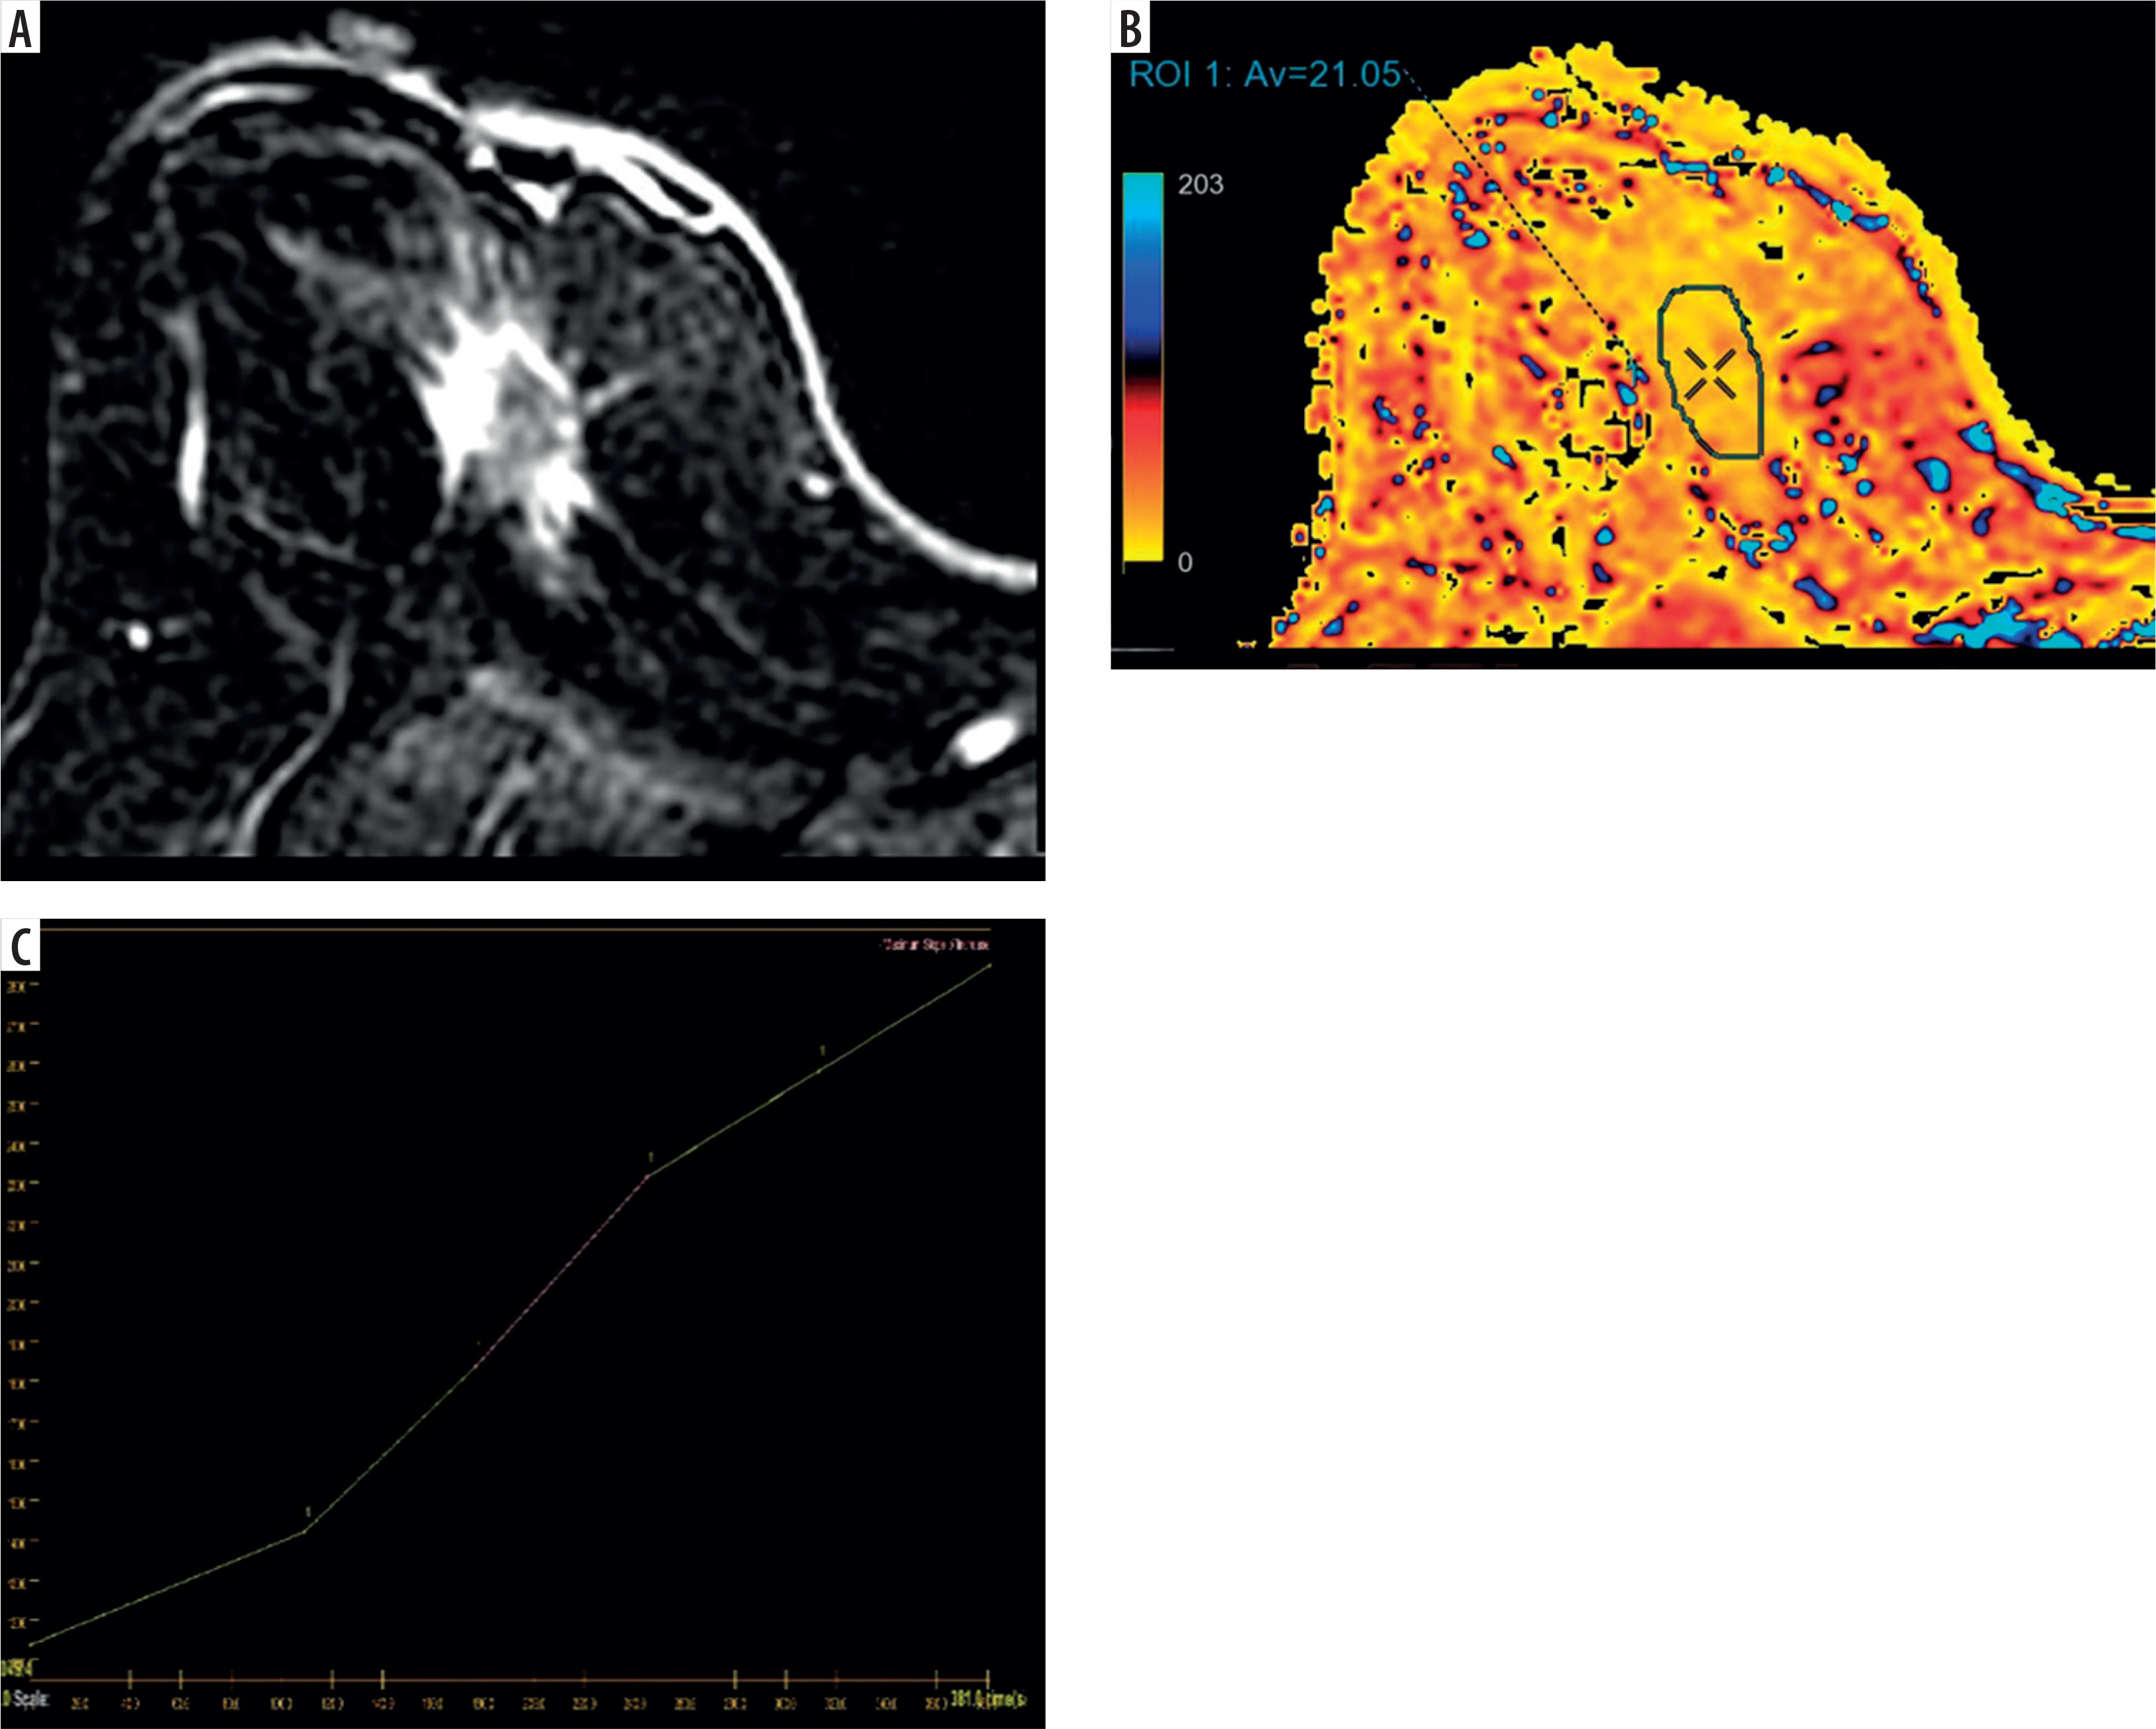
Figure 4
A 66-year-old female patient who had undergone wide local excision of a breast lump for infiltrating ductal carcinoma 1 month before MRI. A) Subtraction image showing postoperative cavity with irregular rim enhancement. B) Corresponding SER map does not show any area of increased SER, with an average value of 34.33 obtained by drawing a small 2D ROI on the enhancing rim and cloning them onto the SER map. C) Kinetics analysis demonstrates persistent enhancement. The patient further underwent re-excision, which revealed no residual atypia/malignancy
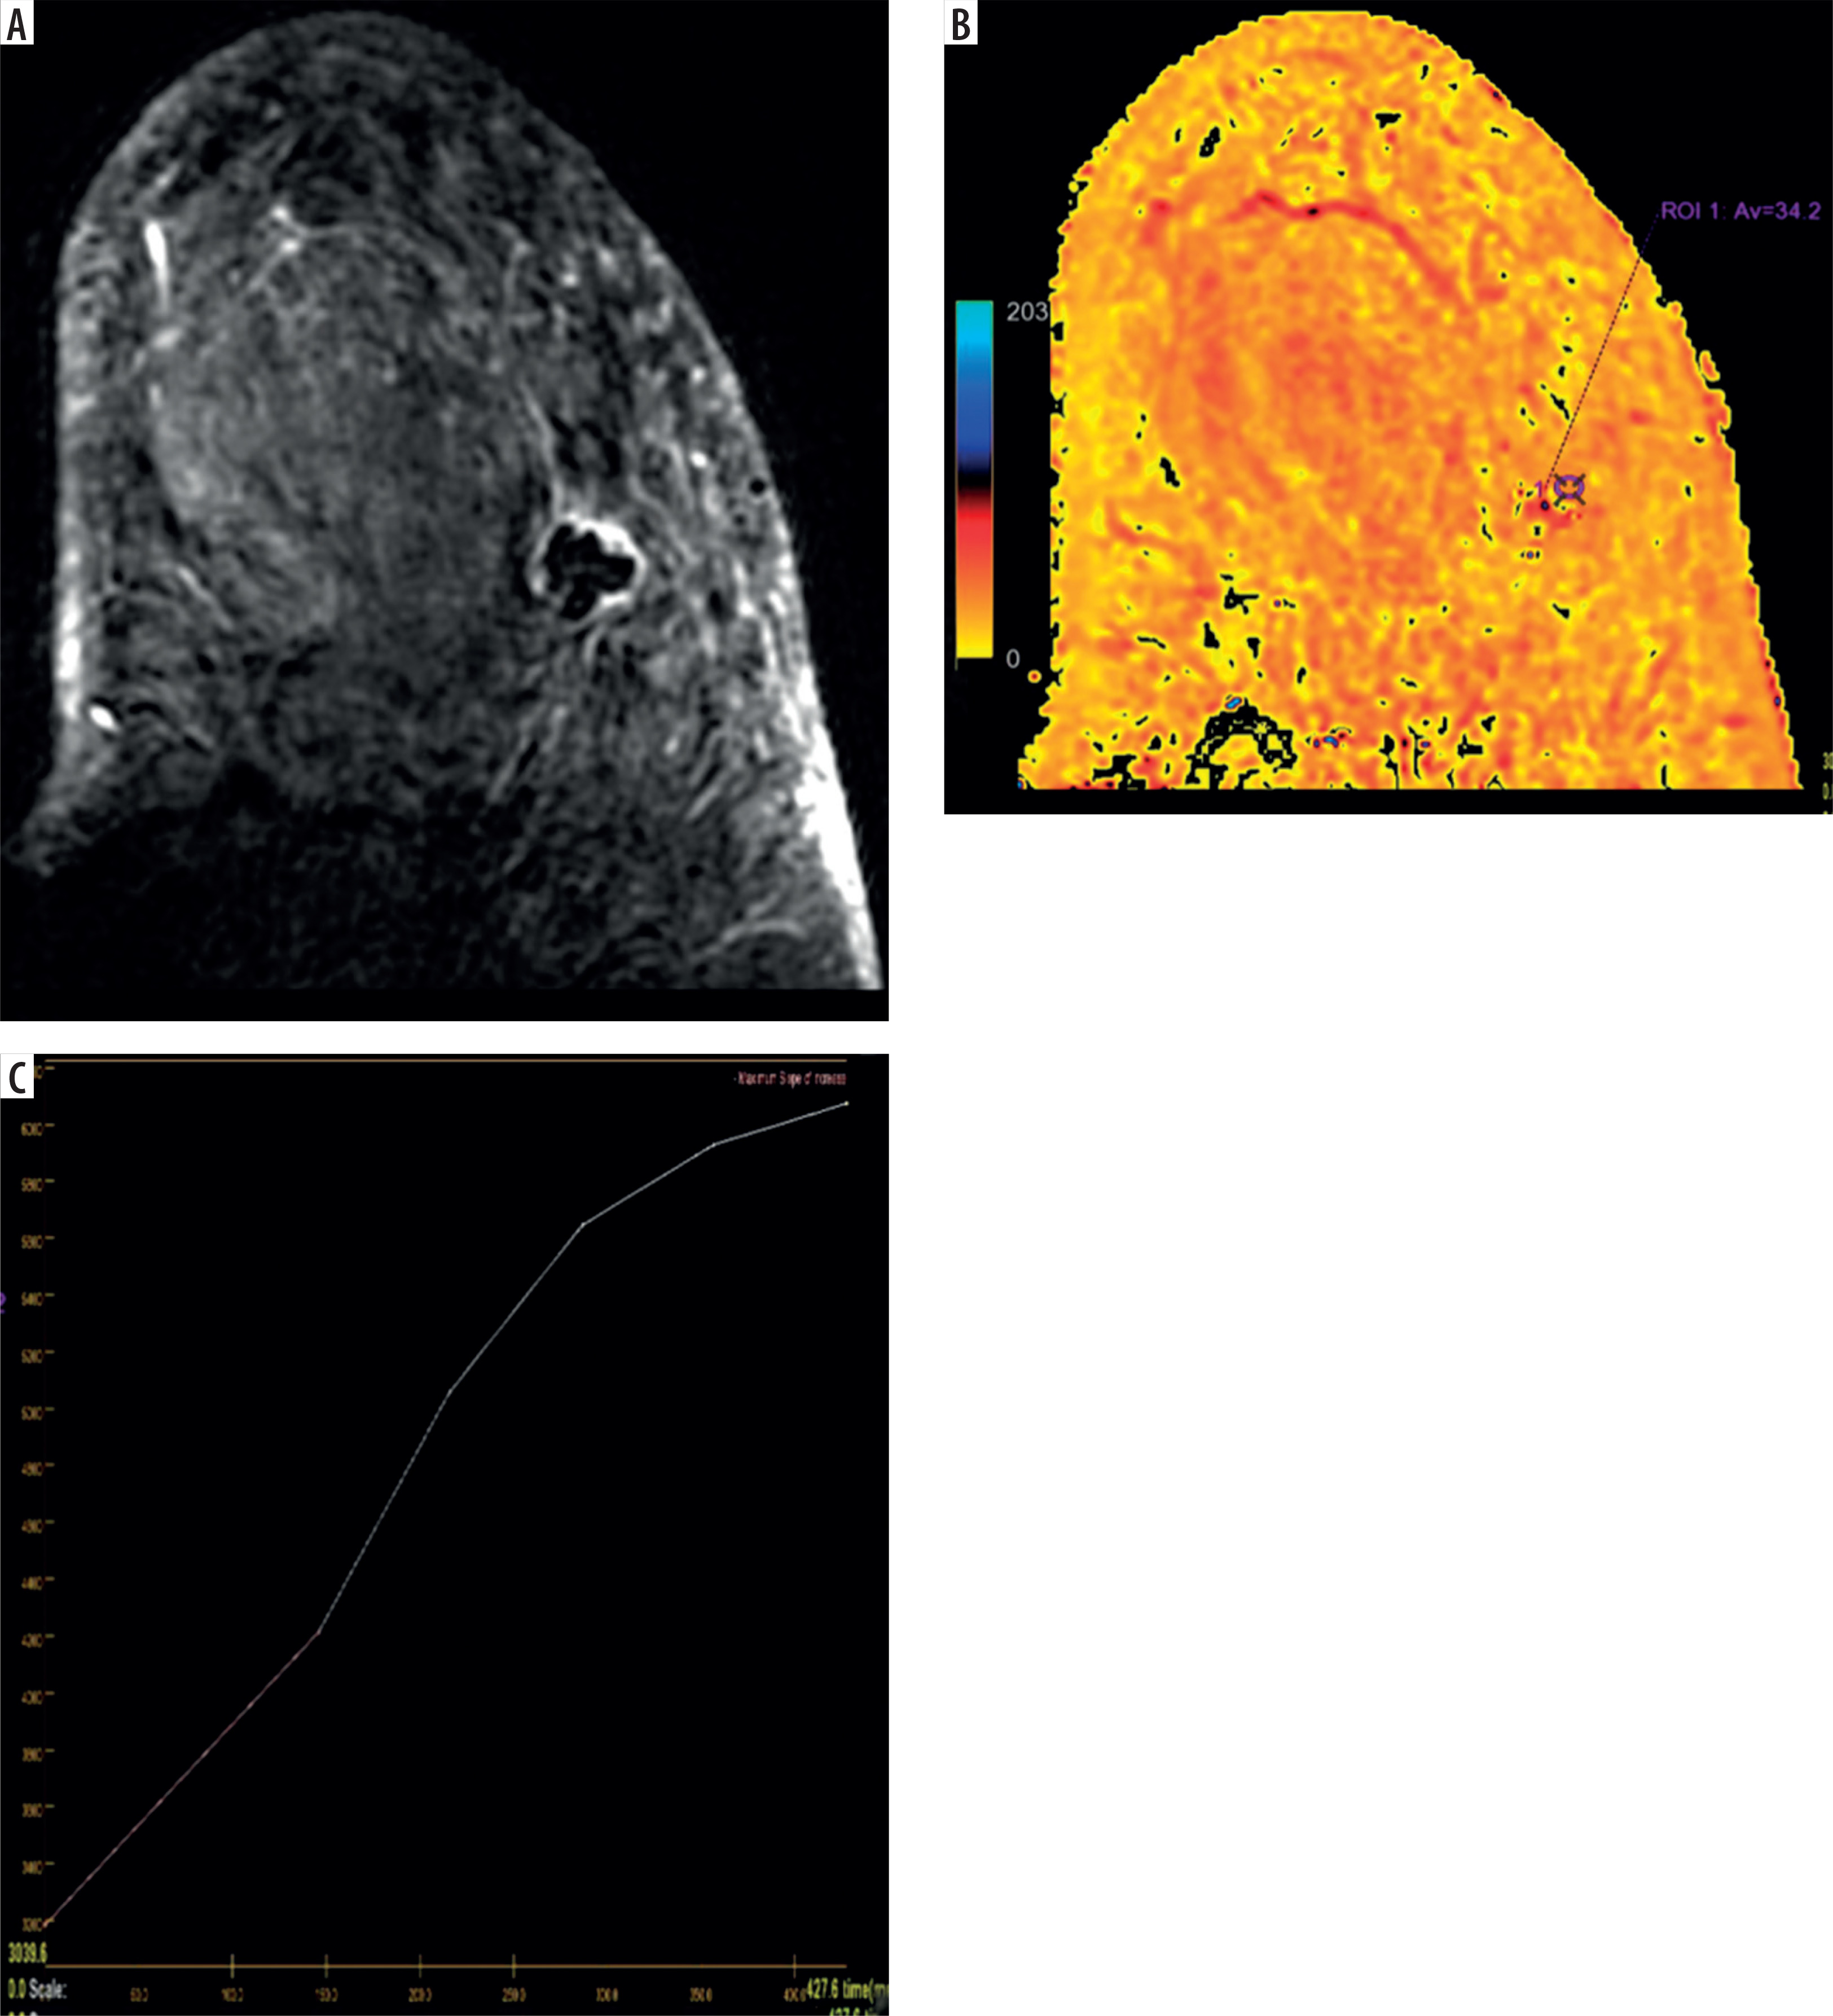
Figure 5
A 30-year-old female patient who had undergone wide local excision of a breast lump for infiltrating ductal carcinoma 3 weeks before MRI. A) Subtraction image showing postoperative cavity with irregular rim enhancement. B) Corresponding SER map shows areas of increased SER along the anterior wall of the cavity (blue-coloured area), with an average value of 168.1 obtained by drawing a small 2D ROI. C) Kinetics analysis demonstrates rapid contrast enhancement and washout. The patient further underwent modified radical mastectomy, which revealed foci of residual tumour
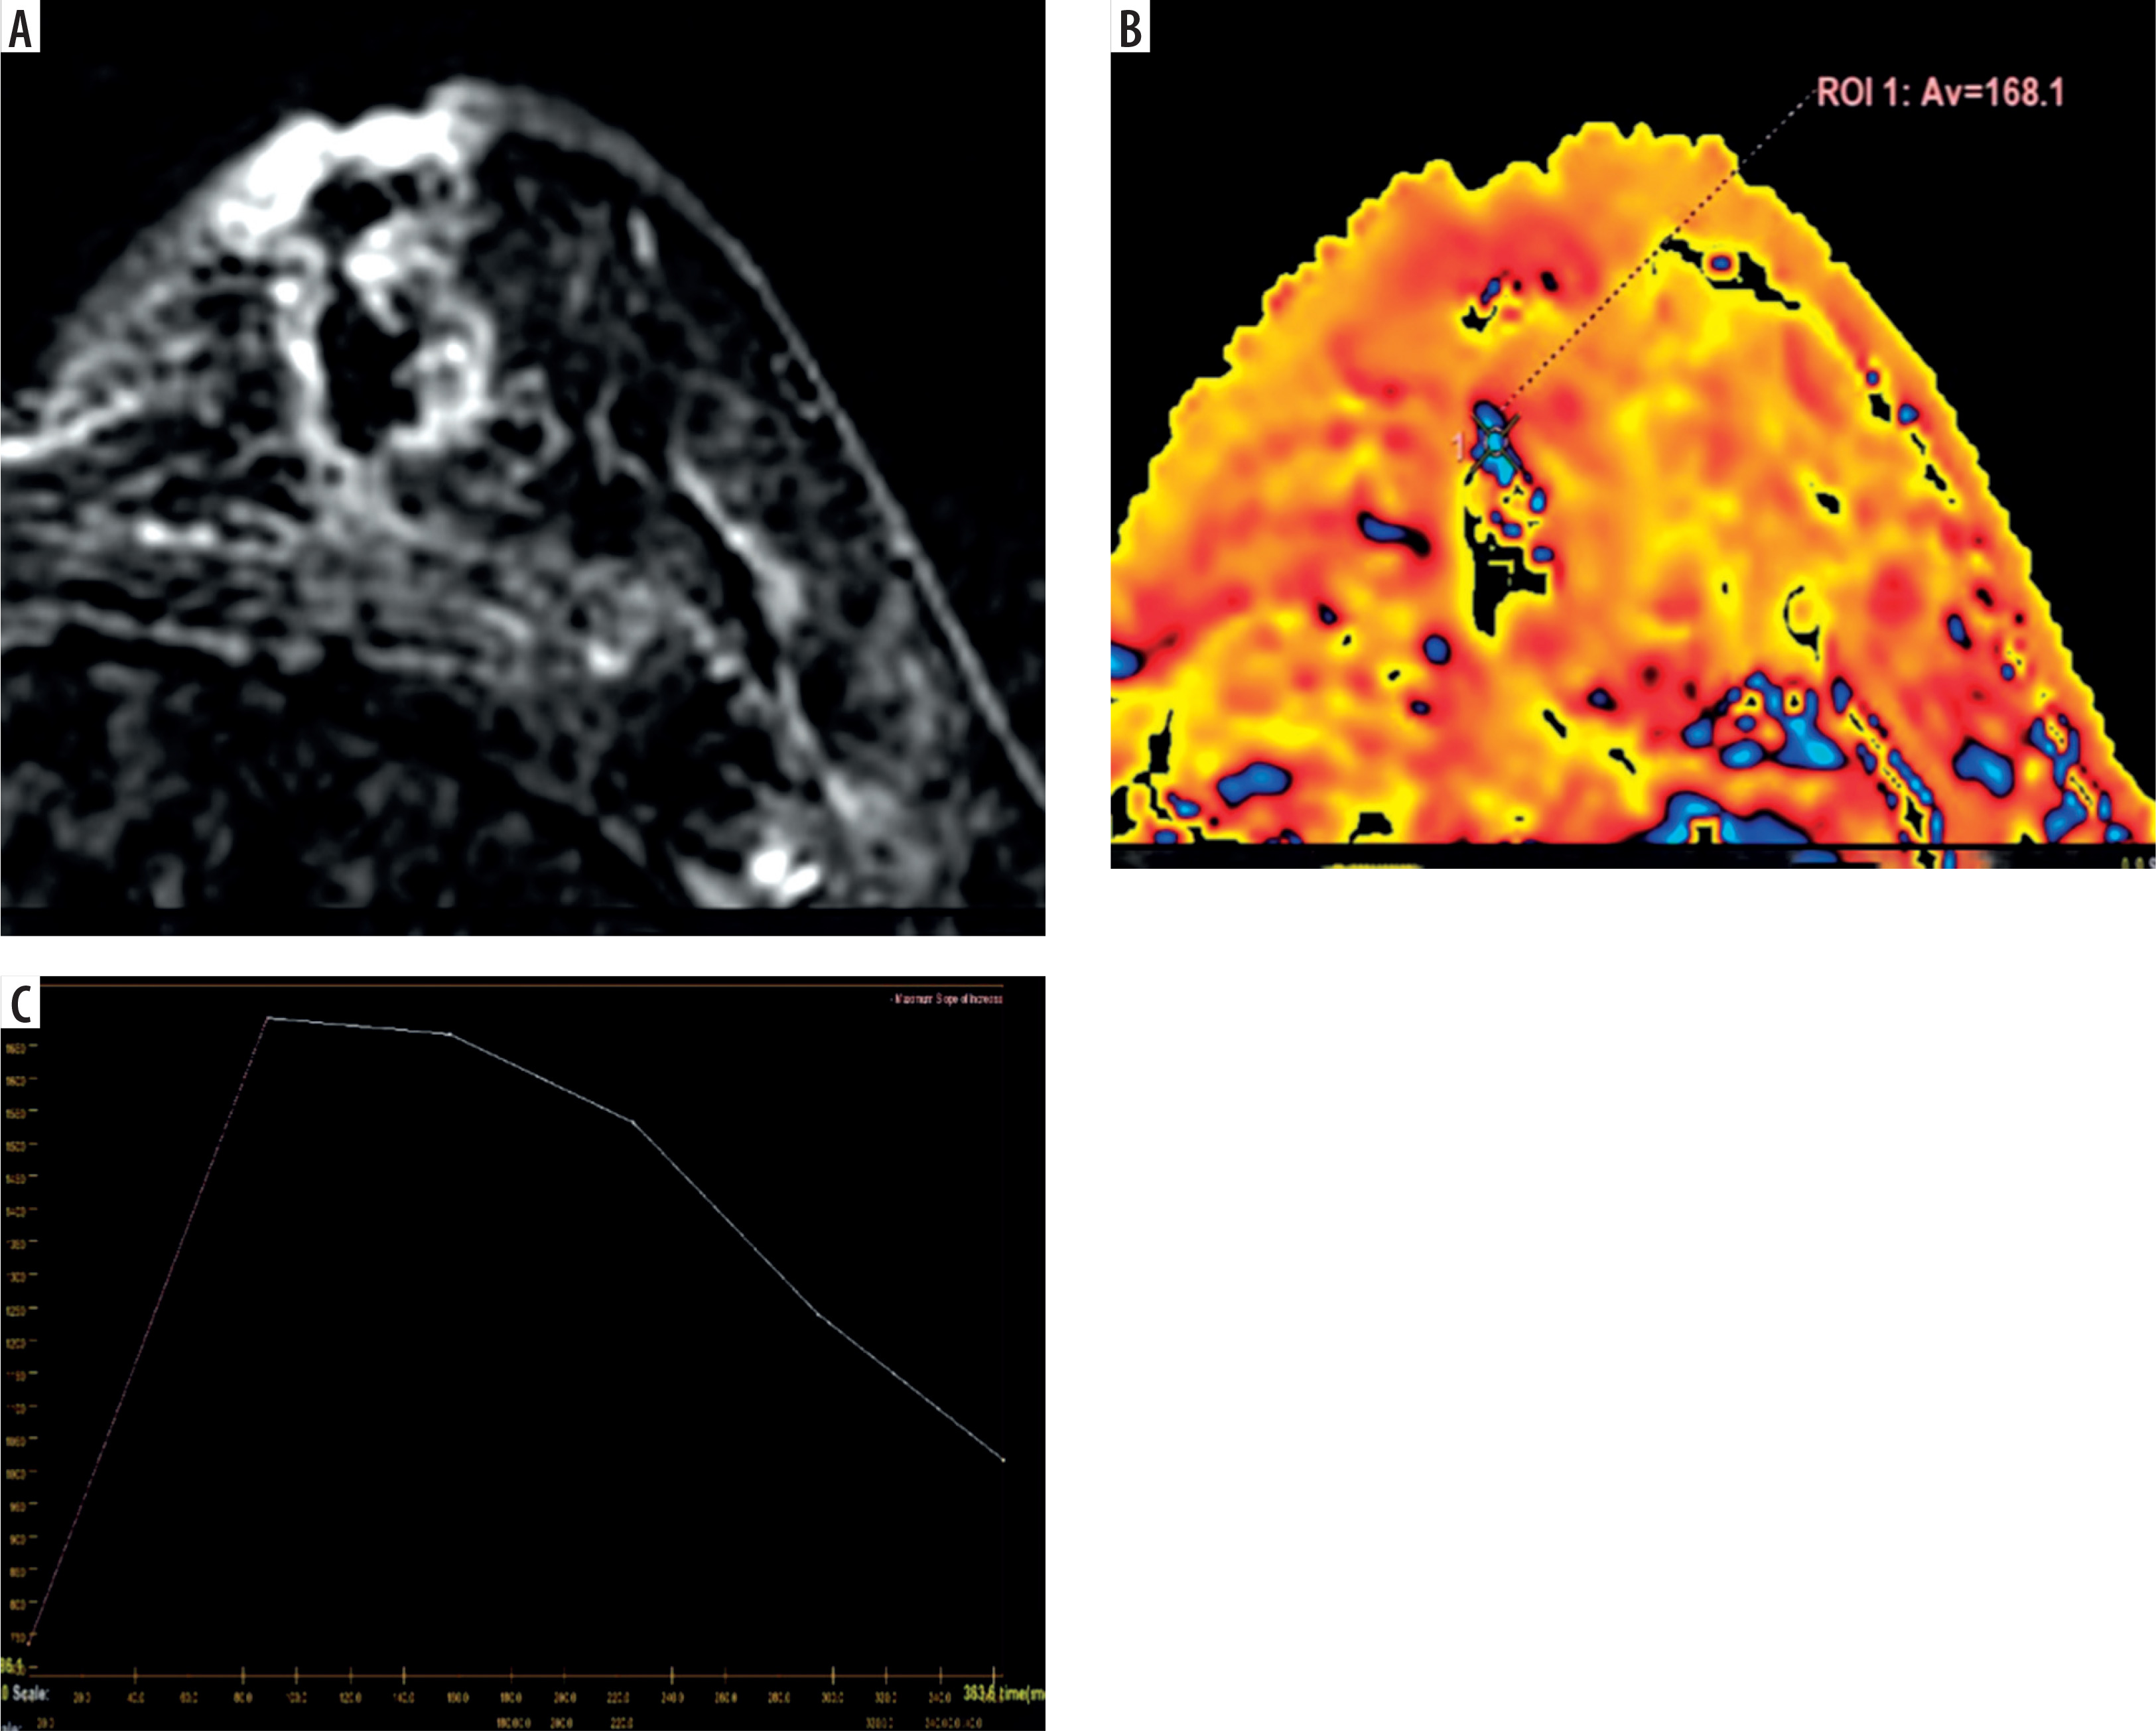
Figure 6
A 46-year-old female patient who had undergone wide local excision of a breast lump for infiltrating ductal carcinoma 4 months previously. A) Early subtraction image showing homogenous non-mass like enhancement in segmental distribution. B) SER map shows corresponding areas of increased SER (blue-coloured area), with an average value of 109.8 obtained using a small 2D ROI. C) Corresponding kinetics analysis shows rapid contrast enhancement and washout. Patient further underwent re-excision, which revealed extensive DCIS with foci of invasive ductal carcinoma
Discussion
Imaging the postoperative breast is challenging due to inflammatory changes that can obscure or mimic malignancy. In MR imaging, postsurgical contrast enhancement from inflammation can lower the specificity and positive predictive value for detecting residual disease. SER mapping provides a straightforward method for quantitatively assessing washout kinetics in post-treatment breasts, improving the detection of residual cancer.
This study highlights the utility of MRI and SER in identifying residual disease after breast cancer treatment. A strong correlation was found between higher SER values and residual cancer, supporting SER as a reliable quantitative marker. Thick or irregular rim enhancement, along with nodular or non-mass-like enhancement, showed high sensitivity (100%) but low specificity (50%), leading to false positives and potentially unnecessary surgeries. An SER cut-off of 90 significantly improved specificity to 90% while retaining 100% sensitivity, enhancing diagnostic accuracy.
Accurate delineation of residual disease after neoadjuvant therapy and surgery remains challenging on breast MRI. Meta-analyses show that while DCE-MRI is generally sensitive, its specificity is heterogeneous, leading to false-positive interpretations and potential overtreatment.
A key source of variability is reliance on qualitative morphology and reader-dependent kinetic curve categorisation (persistent/plateau/washout) in BI-RADS, which are sensitive but can be nonspecific, particularly in the setting of post-treatment inflammation, fibrosis, and granulation tissue. Moreover, kinetic curve assessment itself can vary across vendors and acquisition protocols; timing choices and system differences alter curve shapes and hence diagnostic calls [9]. These issues collectively motivate incorporating reproducible quantitative metrics.
Quantitative parameters derived from DCE-MRI including the SER offer a pragmatic bridge between fully qualitative reads and model-based pharmacokinetics. Early work linked SER to pharmacokinetic exchange terms and demonstrated that SER-based approaches can improve specificity compared with purely qualitative assessment, including reductions in unnecessary biopsy recommendations when volume-based SER metrics are used [10,11]. Our pilot’s higher specificity using an SER threshold (90% at SER > 90) alongside maintained sensitivity mirrors that trend toward fewer false positives without sacrificing detection.
Our voxel-wise SER mapping provides a simple, vendor-available quantitative readout of late washout that reduced false positives in morphologically suspicious cases in this cohort.
Our findings therefore align with broader evidence that quantitative or semi-quantitative DCE-MRI metrics enhance interpretive specificity in post-treatment breasts. The pilot design was intentional: this was a single-centre feasibility evaluation to assess workflow integration of voxel-wise SER mapping and to generate preliminary effect sizes for power calculations.
Limitations include the small sample size, single-reader measurements without inter-reader testing, and lack of subtype-stratified analyses known to influence MRI accuracy. The small sample size limits statistical power and reduces the robustness of ROC-derived estimates, including the AUC. In small cohorts, AUC values may be unstable and sensitive to single observations, and confidence intervals may be wide, increasing the risk of overestimation of diagnostic performance. Accordingly, the reported AUC should be interpreted as a preliminary indicator of discriminatory potential, rather than a definitive measure of performance. Larger, multi-centre cohorts will be required to confirm the observed AUC, refine optimal SER cut-offs, and establish reliable confidence bounds.
Future work should prospectively validate SER thresholds across platforms, incorporate multi-reader reliability, and compare SER against (and in combination with) standardised kinetic modelling and diffusion-weighted imaging to define an optimal multi-parametric strategy.
Conclusions
This pilot study demonstrated that voxel-wise SER mapping on DCE-MRI provides a quantitative, reproducible parameter that significantly improves the specificity of breast MRI for detecting residual disease after surgery or neoadjuvant chemotherapy, without compromising sensitivity. By reducing false-positive interpretations that arise with morphological assessment alone, SER mapping may help avoid unnecessary re-excisions or mastectomies, while ensuring timely identification of true residual disease. Although limited by small sample size, these findings support the clinical utility of SER as a practical adjunct in post-treatment breast imaging and provide feasibility data for larger prospective studies aimed at validating optimal thresholds and incorporating SER into multiparametric MRI protocols.