
Introduction
Parotid gland tumors (PGTs) are relatively rare neoplasms in head and neck and encompass a wide range of pathological subtypes [1]. Malignant PGTs have a poor prognosis, and total parotidectomy with radiotherapy is the major treatment modality [2], although the incidence of malignant PGTs is lower than that of benign PGTs [1]. In contrast, most benign PGTs can be managed conservatively or with superficial parotidectomy [3,4]. Therefore, accurate preoperative differentiation between benign and malignant parotid lesions is essential for optimizing treatment planning and improving prognostic assessment.
Fine needle aspiration cytology is a reliable diagnostic technique for obtaining pathological information on PGTs; however, its diagnostic performance may be limited by insufficient sampling and the potential risk of iatrogenic facial nerve injury associated with its invasive nature [5]. Magnetic resonance imaging (MRI), with its excellent soft-tissue contrast, serves as an essential modality for evaluating PGTs. Although conventional MRI provides detailed assessment of tumor anatomy, invasion, and extent, overlapping imaging characteristics often hinder the accurate differentiation of PGT subtypes [2]. Diffusion-weighted imaging (DWI), which applies motion-sensitizing gradients to characterize water diffusivity, together with its quantitative metric – the apparent diffusion coefficient (ADC) – provides valuable cellular-level microstructural information [6]. Moreover, dynamic contrast-enhanced (DCE)-MRI can assess tumor perfusion and vascular permeability following gadolinium contrast [7,8]. Previous studies have demonstrated that ADC values from DWI and parameters derived from DCE-MRI have the potential for differential diagnosis of PGTs [9-13]. However, these studies usually had suboptimal diagnostic performance.
Radiomics is a noninvasive and reproducible approach that extracts high-throughput quantitative features from medical images to support clinical decision-making [14,15], facilitating detailed characterization of intratumoral heterogeneity, and enabling exploration of underlying pathophysiological mechanisms reflected by radiomics signatures [14]. With the development of artificial intelligence and computational algorithms, radiomics has emerged as a valuable tool for pre-treatment diagnosis, prognostic evaluation, and gene prediction in head and neck tumors [16]. In particular, several prior studies have demonstrated the utility of radiomics analysis of CT or MR images in distinguishing PGTs [15,17-20]. Notably, machine learning has shown remarkable potential to revolutionize medical imaging, not only in lesion analysis but also in improving image capture efficiency, forecasting treatment outcomes, and refining the accuracy of radiation dosage assessment for both therapeutic and safety applications [21].
Therefore, selecting a suitable machine learning model is essential to enhance the reliability and clinical applicability of radiomics [20]. Different machine learning methods may exhibit varying performance across clinical scenarios [22]. Nevertheless, studies evaluating different machine learning models combined with radiomics based on DWI and DCE-MRI for the characterization of PGTs are limited, and the optimal classifier remains to be investigated.
This study implemented and compared multiple machine-learning algorithms to develop DWI- and DCE-MRI-based radiomics models, aiming to validate an integrated MRI-based model for distinguishing benign from malignant parotid gland lesions.
Material and methods
Patients
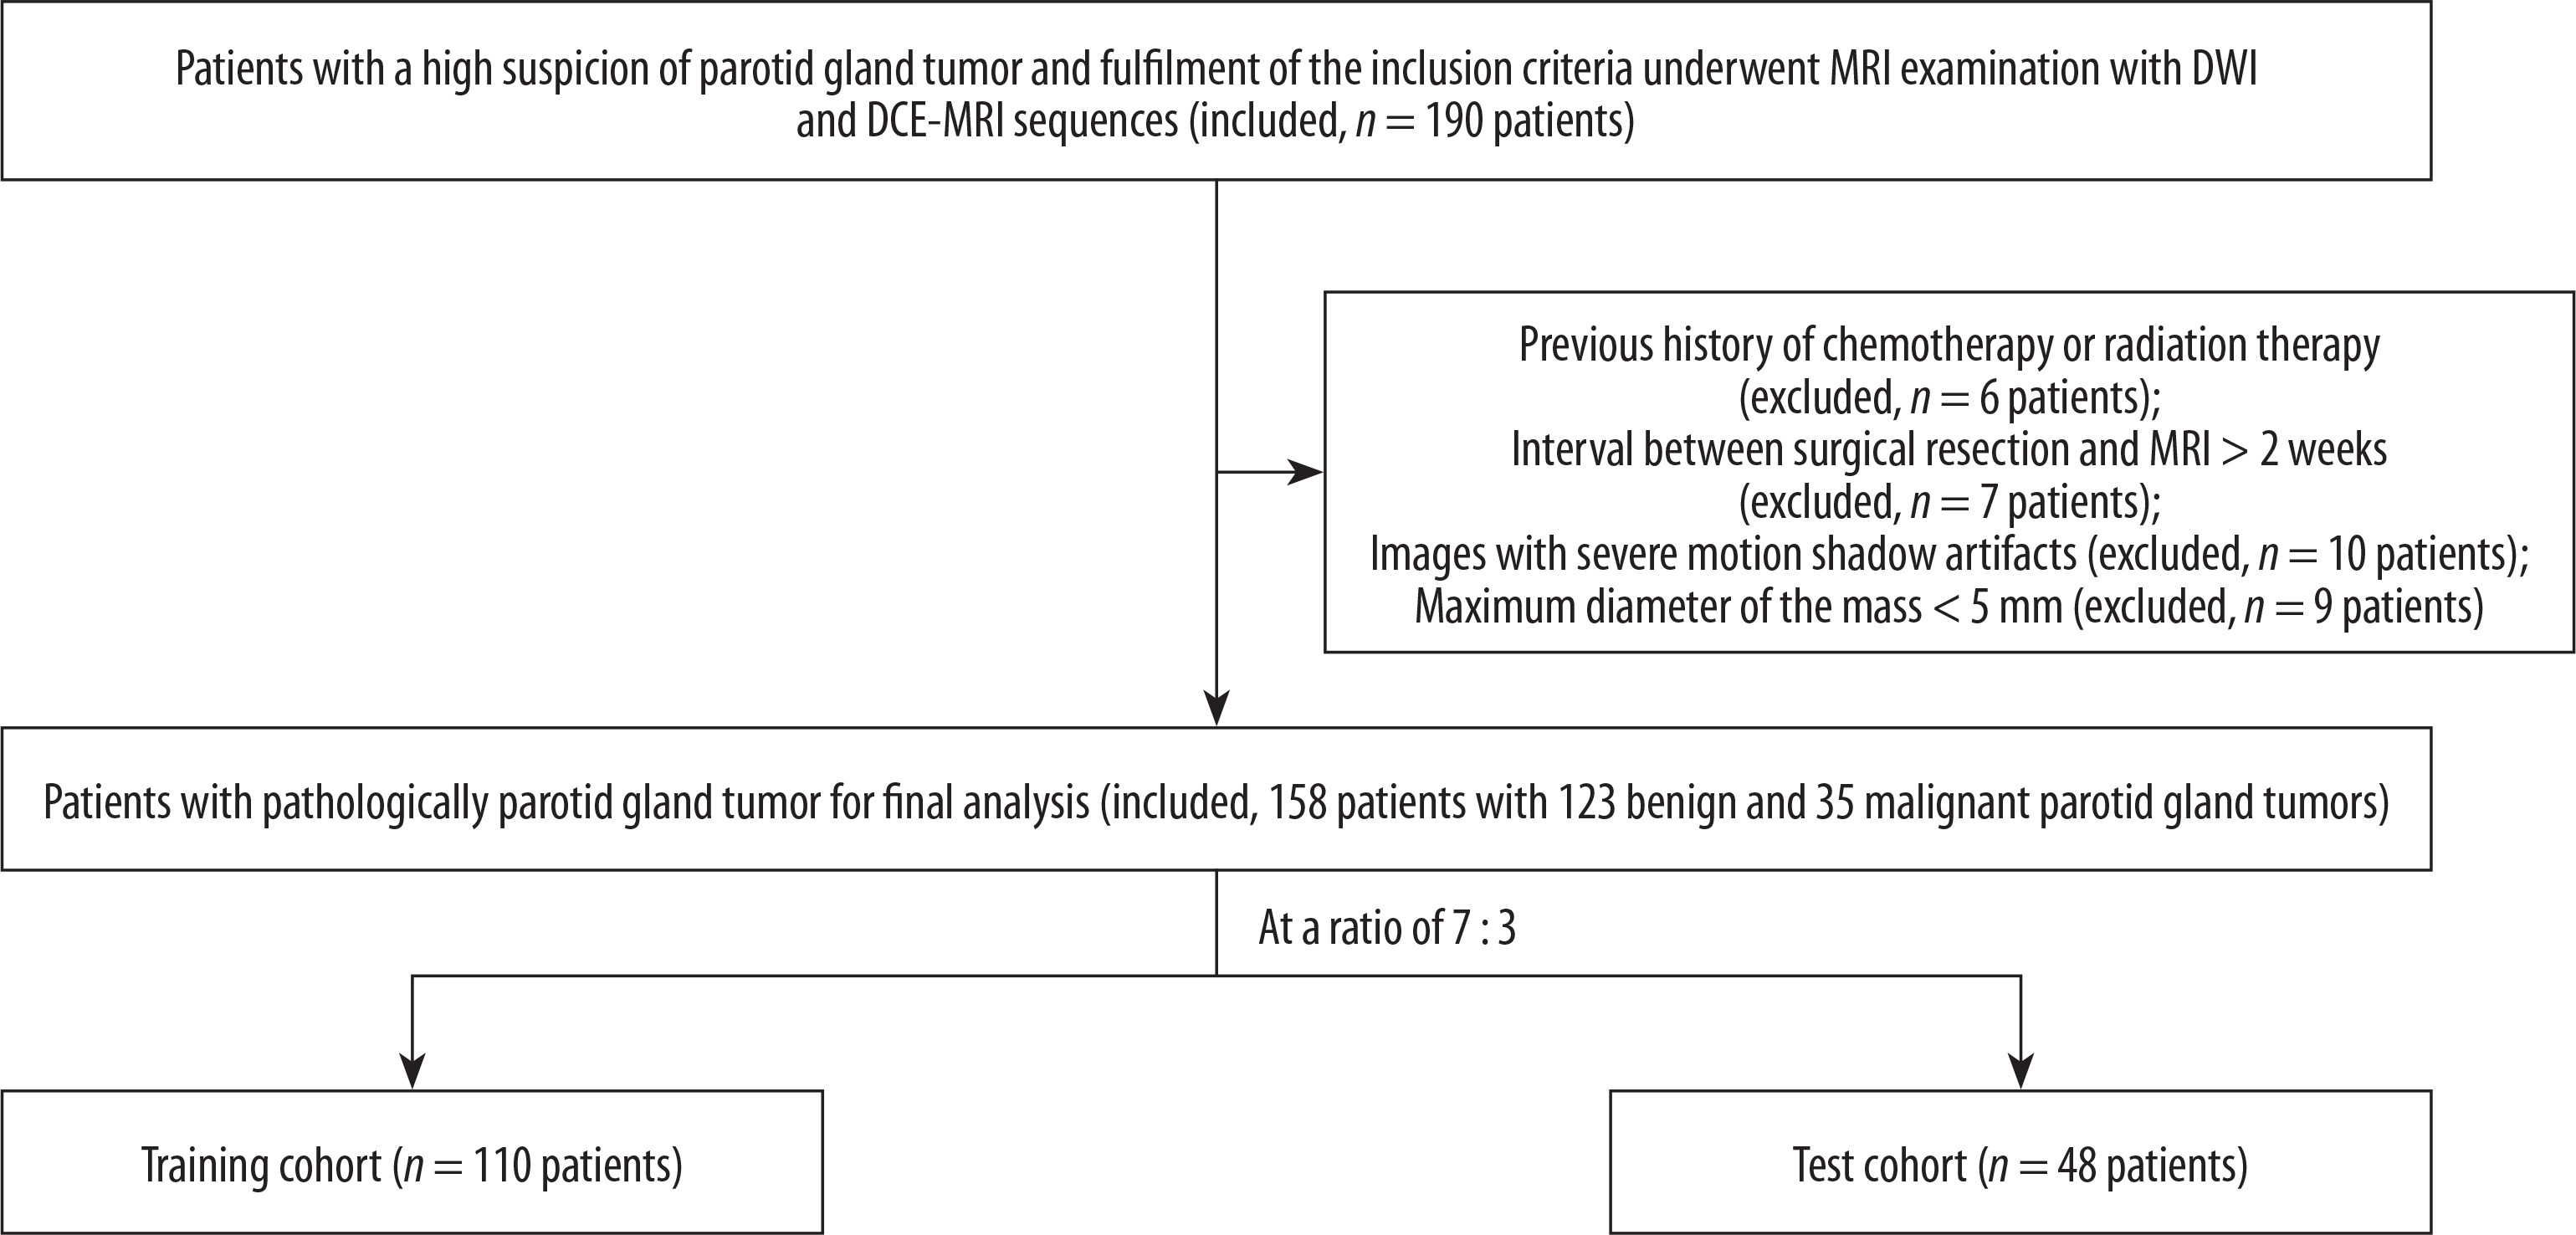
This single-center study received approval from the Institutional Review Board of Sun Yat-sen University, and written informed consent was obtained from all participants. The study included a total of 190 consecutive patients with suspected PGTs who underwent MRI including DWI and DCE-MRI sequences from January 2022 to October 2023. Patients were included if they met the following criteria: (1) a histological diagnosis of PGTs after surgical resection; (2) MRI performed within 14 days prior to treatment. Exclusion criteria were as follows: (1) images with severe motion shadow artifacts; (2) maximum diameter of the mass was less than 5 mm; (3) prior history of chemoradiotherapy for PGTs; (4) surgical resection performed more than two weeks after the MR examination. All eligible patients were randomly divided into a training cohort and a test cohort at a ratio of 7:3. Figure 1 shows the flowchart of the study selection process.
MRI acquisition
MRI examinations were performed using a 3.0 T system (Ingenia Digital Network Architecture 3.0 T, Philips Healthcare, Best, The Netherlands). The imaging protocol comprised conventional sequences, DWI and DCE-MRI acquired in the axial plane. First, axial and sagittal T1-weighted imaging (T1WI), axial T2-weighted imaging (T2WI) and coronal T2WI with fat suppression were acquired. Prior to injection of the contrast agent, DWI was conducted using single-shot echo planar imaging (EPI) sequence with two b-values of 0 and 800 s/mm2, and the ADC map was automatically generated. Before the DCE-MRI sequence, T1 maps were performed using variable flip angles (2°, 4°, 7°, 9°, and 12°). Then, the DCE-MRI scan consisted of 110 phases with a temporal resolution of 3 s. A bolus injection of Gd-DTPA-BMA (Omniscan, GE Healthcare, Ireland) at a rate of 3 ml/s (0.1 mmol/kg) was given, followed by flushing with 20 ml of saline. The acquisition of conventional contrast-enhanced T1WI was obtained after DCE imaging, using identical parameters to those of the unenhanced T1WI. The detailed protocols are summarized in Table 1.
Table 1
Imaging parameters of DWI, DCE-MRI and conventional MRI sequences
[i] DCE – dynamic contrast-enhanced, DWI – diffusion-weighted imaging, EPI – echo planar imaging, FOV – field of view, MRI – magnetic resonance imaging, NSA – number of signal averages, T1WI – T1-weighted imaging, T2WI – T2-weighted imaging, TE – echo time, TFE – turbo field echo, TR – repetition time, TSE – turbo spin echo
Image processing
Post-processing software (Omni-Kinetics, GE Healthcare, Shanghai, China) was used to generate the perfusion parametric maps from the DCE-MRI data. A circular region of interest was manually placed over the external carotid artery ipsilateral to the primary tumor as an arterial input function (AIF). Utilizing the AIF, the variable flip angle method and the two-compartment extended Tofts model were applied to obtain the pharmacokinetic and semi-quantitative parameter maps.
Image segmentation and feature extraction
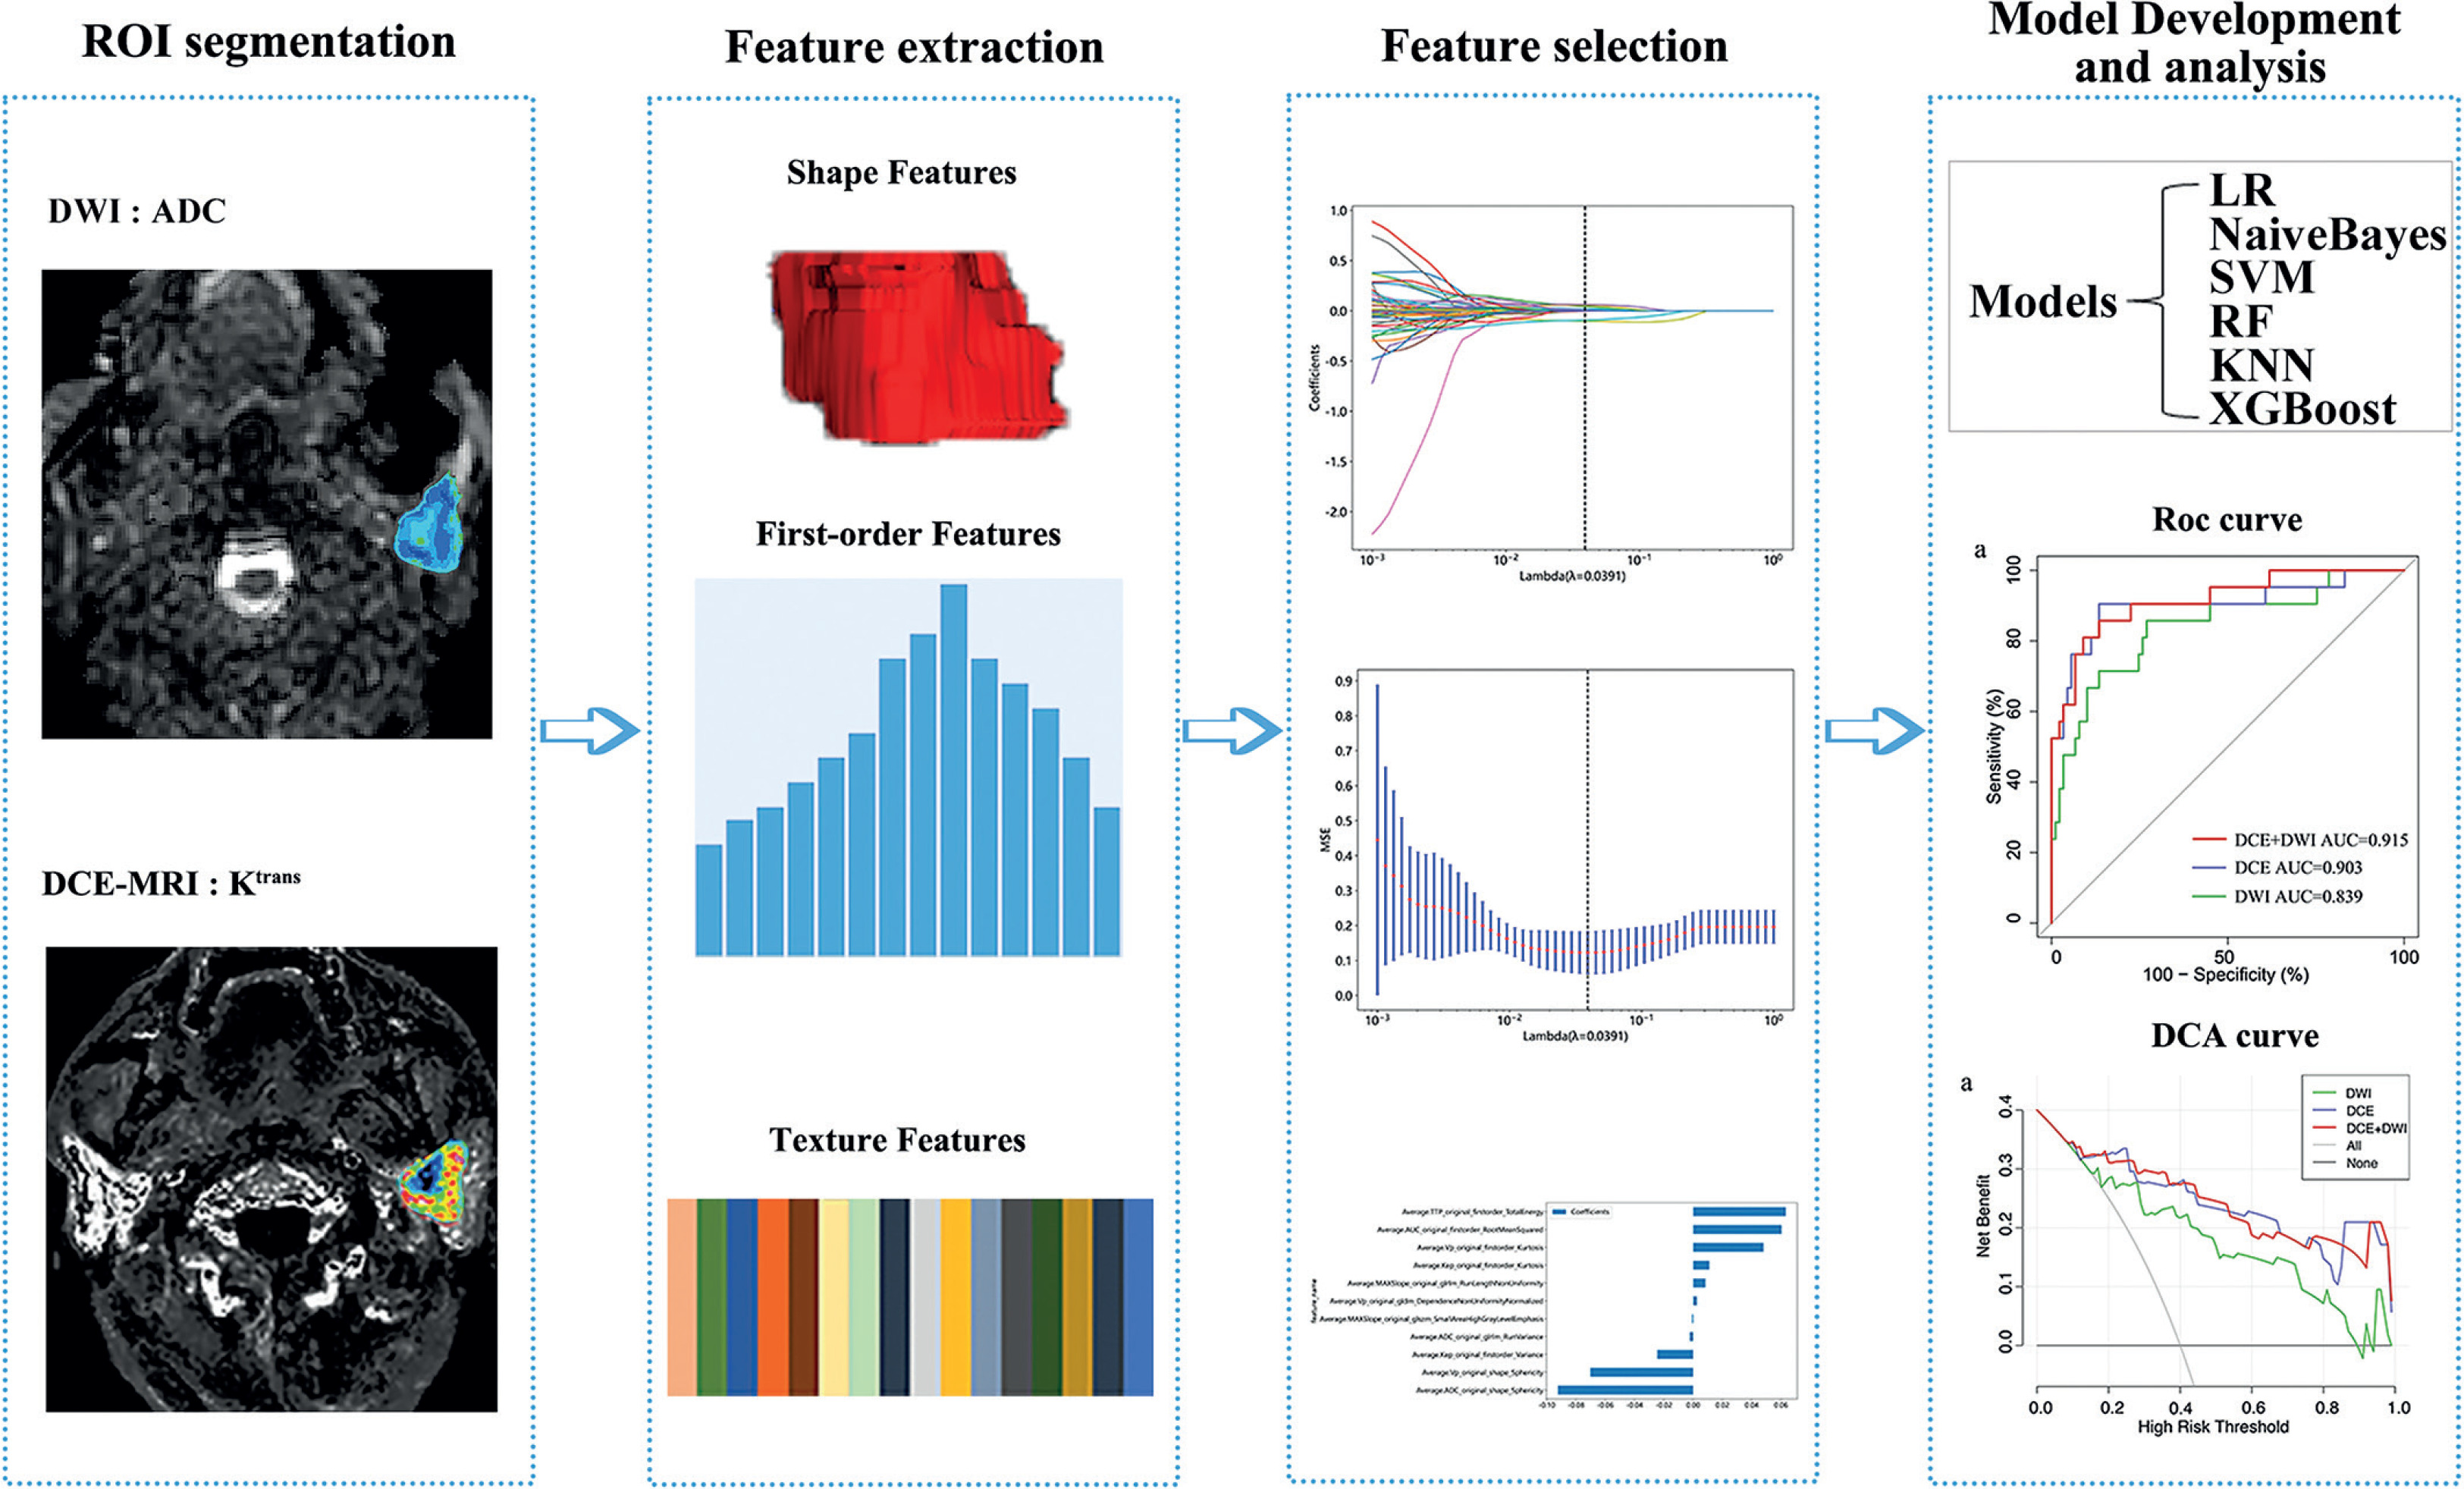
The region of interest (ROI) segmentation was manually annotated using ITK-SNAP software (http://www.itksnap.org). Two radiologists (with 11 and 13 years of experience in head and neck MRI, respectively), blinded to histopathological results, independently delineated the ROIs of all lesions and conducted subsequent feature extraction. The three-dimensional ROIs of the entire tumor were delineated slice-by-slice based on the isotropic map from DWI and the Ktrans map from DCE-MRI, which allowed for clearer visualization of the lesion. The axial T2WI and enhanced T1WI were used as references to exclude necrotic and cystic regions. Then, the ROIs on the Ktrans map and isotropic images were propagated to other parametric maps of DCE-MRI and ADC maps. These ROIs were then exported separately and duplicated to generate a series of ROIs with unique names. After importing the ROIs into the open-source software Feature Explorer (FAE, V 0.5.2) in batches, we selected first-order, shape, and texture features for the subsequent automated extraction of quantitative image features. Each parameter map generated 107 imaging features, including: (1) 18 first-order features; (2) 14 shape features; (3) 75 texture features, including 24 gray-level co-occurrence matrix features, 14 gray-level dependence matrix features, 16 gray-level run-length matrix features, 16 gray-level size zone matrix features, and 5 neighborhood gray-tone difference matrix features [17]. Finally, a total of 963 imaging features were extracted from the initial ROIs of 8 kinds of parameter maps of DCE-MRI and ADC maps. The workflow for the radiomics analysis and model development is illustrated in Figure 2.
Figure 2
Radiomics analysis and model building workflow
ADC – apparent diffusion coefficient, DCA – decision curve analysis, DCE – dynamic contrast-enhanced, DWI – diffusion-weighted imaging, KNN – K nearest neighbor, LR – logistic regression, RF – random forest, ROC – receiver operating characteristic, ROI – region of interest, SVM – support vector machine, XGBoost – eXtreme Gradient Boosting
Radiomics feature selection
Dimensionality reduction and feature selection were performed on the radiomic features in the training cohort. First, evaluation of the measurement consistency between the two radiologists was performed using the intraclass correlation coefficient (ICC), and only features with excellent reproducibility (ICC > 0.75) were retained. Second, all feature parameters were standardized using the Z-score method, and the correlation between features was calculated using the Spearman correlation coefficient. Third, the Mann-Whitney U test was conducted on the extracted features to identify features that demonstrate statistical significance.
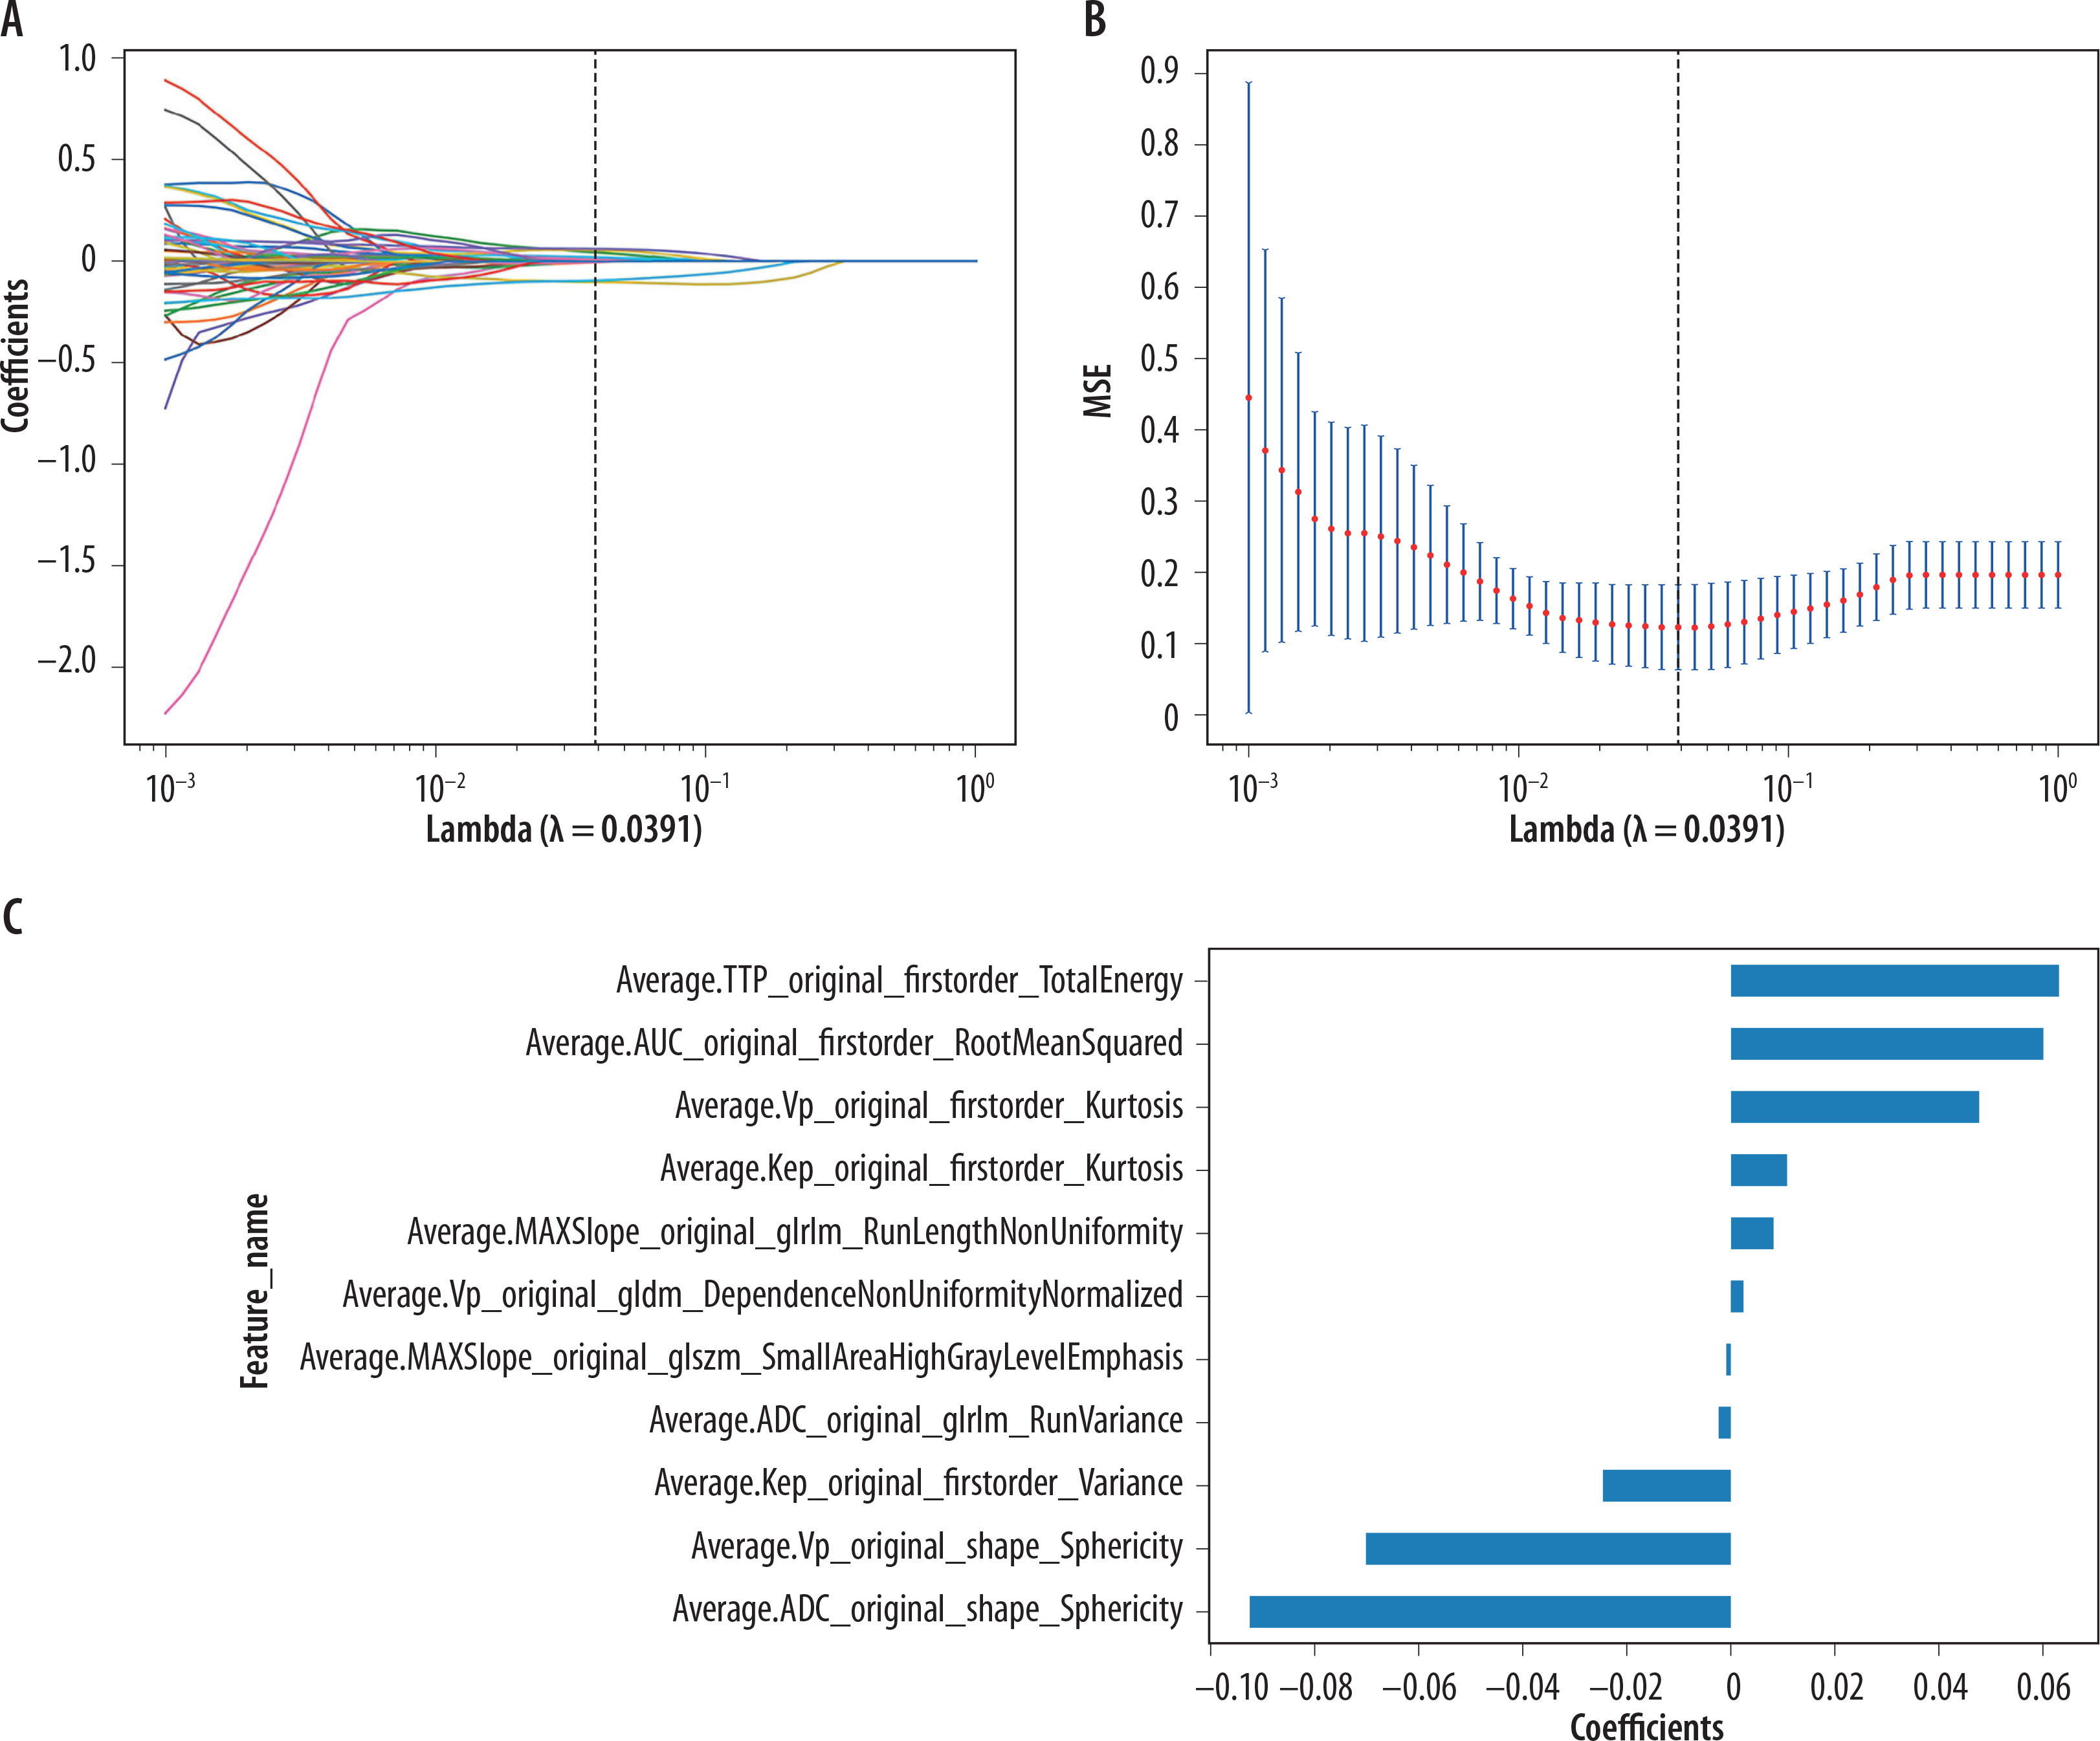
Finally, a tenfold cross-validation least absolute shrinkage and selection operator (LASSO) regression was applied to the training cohort for feature reduction to select the features for models (Figure 3). Features with coefficients reduced to zero were removed, and the remaining nonzero features were selected.
Figure 3
Radiomics features dimension reduction and selection. (A) LASSO coefficient profiles of the features. Different color line shows corresponding coefficient of each feature. (B) Tuning parameter selection in LASSO model. (C) Selected features weight coefficients. LASSO, least absolute shrinkage and selection operator
MSE – mean squared error
Construction performance and validation of the radiomics model
The features selected were used to construct the radiomics model. Several mainstream machine learning algorithms, including logistic regression (LR), NaiveBayes, support vector machine (SVM), K nearest neighbor (KNN), random forest (RF), and eXtreme Gradient Boosting (XGBoost), were implemented to determine the optimal classifier with superior discriminative capability for tumor characterization. The receiver operating characteristic (ROC) curve analysis was performed on these models to calculate areas under the curve (AUCs), accuracy, sensitivity, specificity, positive prediction value (PPV), and negative prediction value (NPV) for quantifying the discriminative efficacy for PGTs. Subsequently, the classifier with the highest AUC in the test cohort was screened to develop the optimal radiomics model constructed separately using DWI-based features, DCE-MRI-based features, and combined DWI + DCE-MRI features, referring to a prior study [23]. Decision curve analysis (DCA) was performed to assess the clinical utility of the predictive model in both the training and test cohorts by calculating net benefits across various threshold probabilities.
Statistical analyses
SPSS version 25.0 (IBM, New York, USA) and R software 4.0.1 (https://www.r-project.org/) were used for this study. Continuous variables were expressed as mean values ± standard deviation and categorical variables were presented as numbers (percentages). The DeLong test was used for multiple comparisons of the AUCs of different models.
Results
Participant characteristics
Finally, 158 patients (age range, 19-80 years) participated in this study and were divided into the training cohort (110 patients, including 89 benign and 21 malignant PGTs) and the test cohort (48 patients, including 34 benign and 14 malignant PGTs). Table 2 presents clinical characteristics and general information of different kinds of PGTs.
Table 2
Basic clinical information of enrolled patients
Selected features
Among all the extracted features, 260 features were excluded due to the ICC values between observers being less than 0.75. After feature downscaling and selection, finally, the LASSO classifier selected 4 radiomics features for the DWI model, 11 radiomics features for the DCE-MRI model, and 11 radiomics features for the DWI + DCE-MRI model, as shown in Supplementary Table S1. The AUCs of six radiomics models (including LR, NaiveBayes, SVM, KNN, RF and XGBoost) in the training and test cohorts are shown in Table 3. In the training cohort, relatively high AUC values exhibit outstanding performance in the SVM (AUC value: 0.905-0.948), KNN (AUC value: 0.903-0.946), RF (AUC value: 0.999-1), and XGBoost (AUC value: 0.990-1) radiomic models. However, in the test cohort, the AUC analysis demonstrated poor predictive ability for the SVM (AUC value: 0.716-0.815), KNN (AUC value: 0.688-0.77), RF (AUC value: 0.701-0.761), and XGBoost (AUC value: 0.672-0.713) radiomic models. The four models of the training and test cohorts exhibited a tendency of overfitting. In order to ensure the stability and sustainability of the radiomic model, we ultimately selected the LR as the optimal classifier.
Table 3
Diagnostic performance of different models for predicting parotid tumors in training and test cohorts
Performance of the radiomics models and clinical use
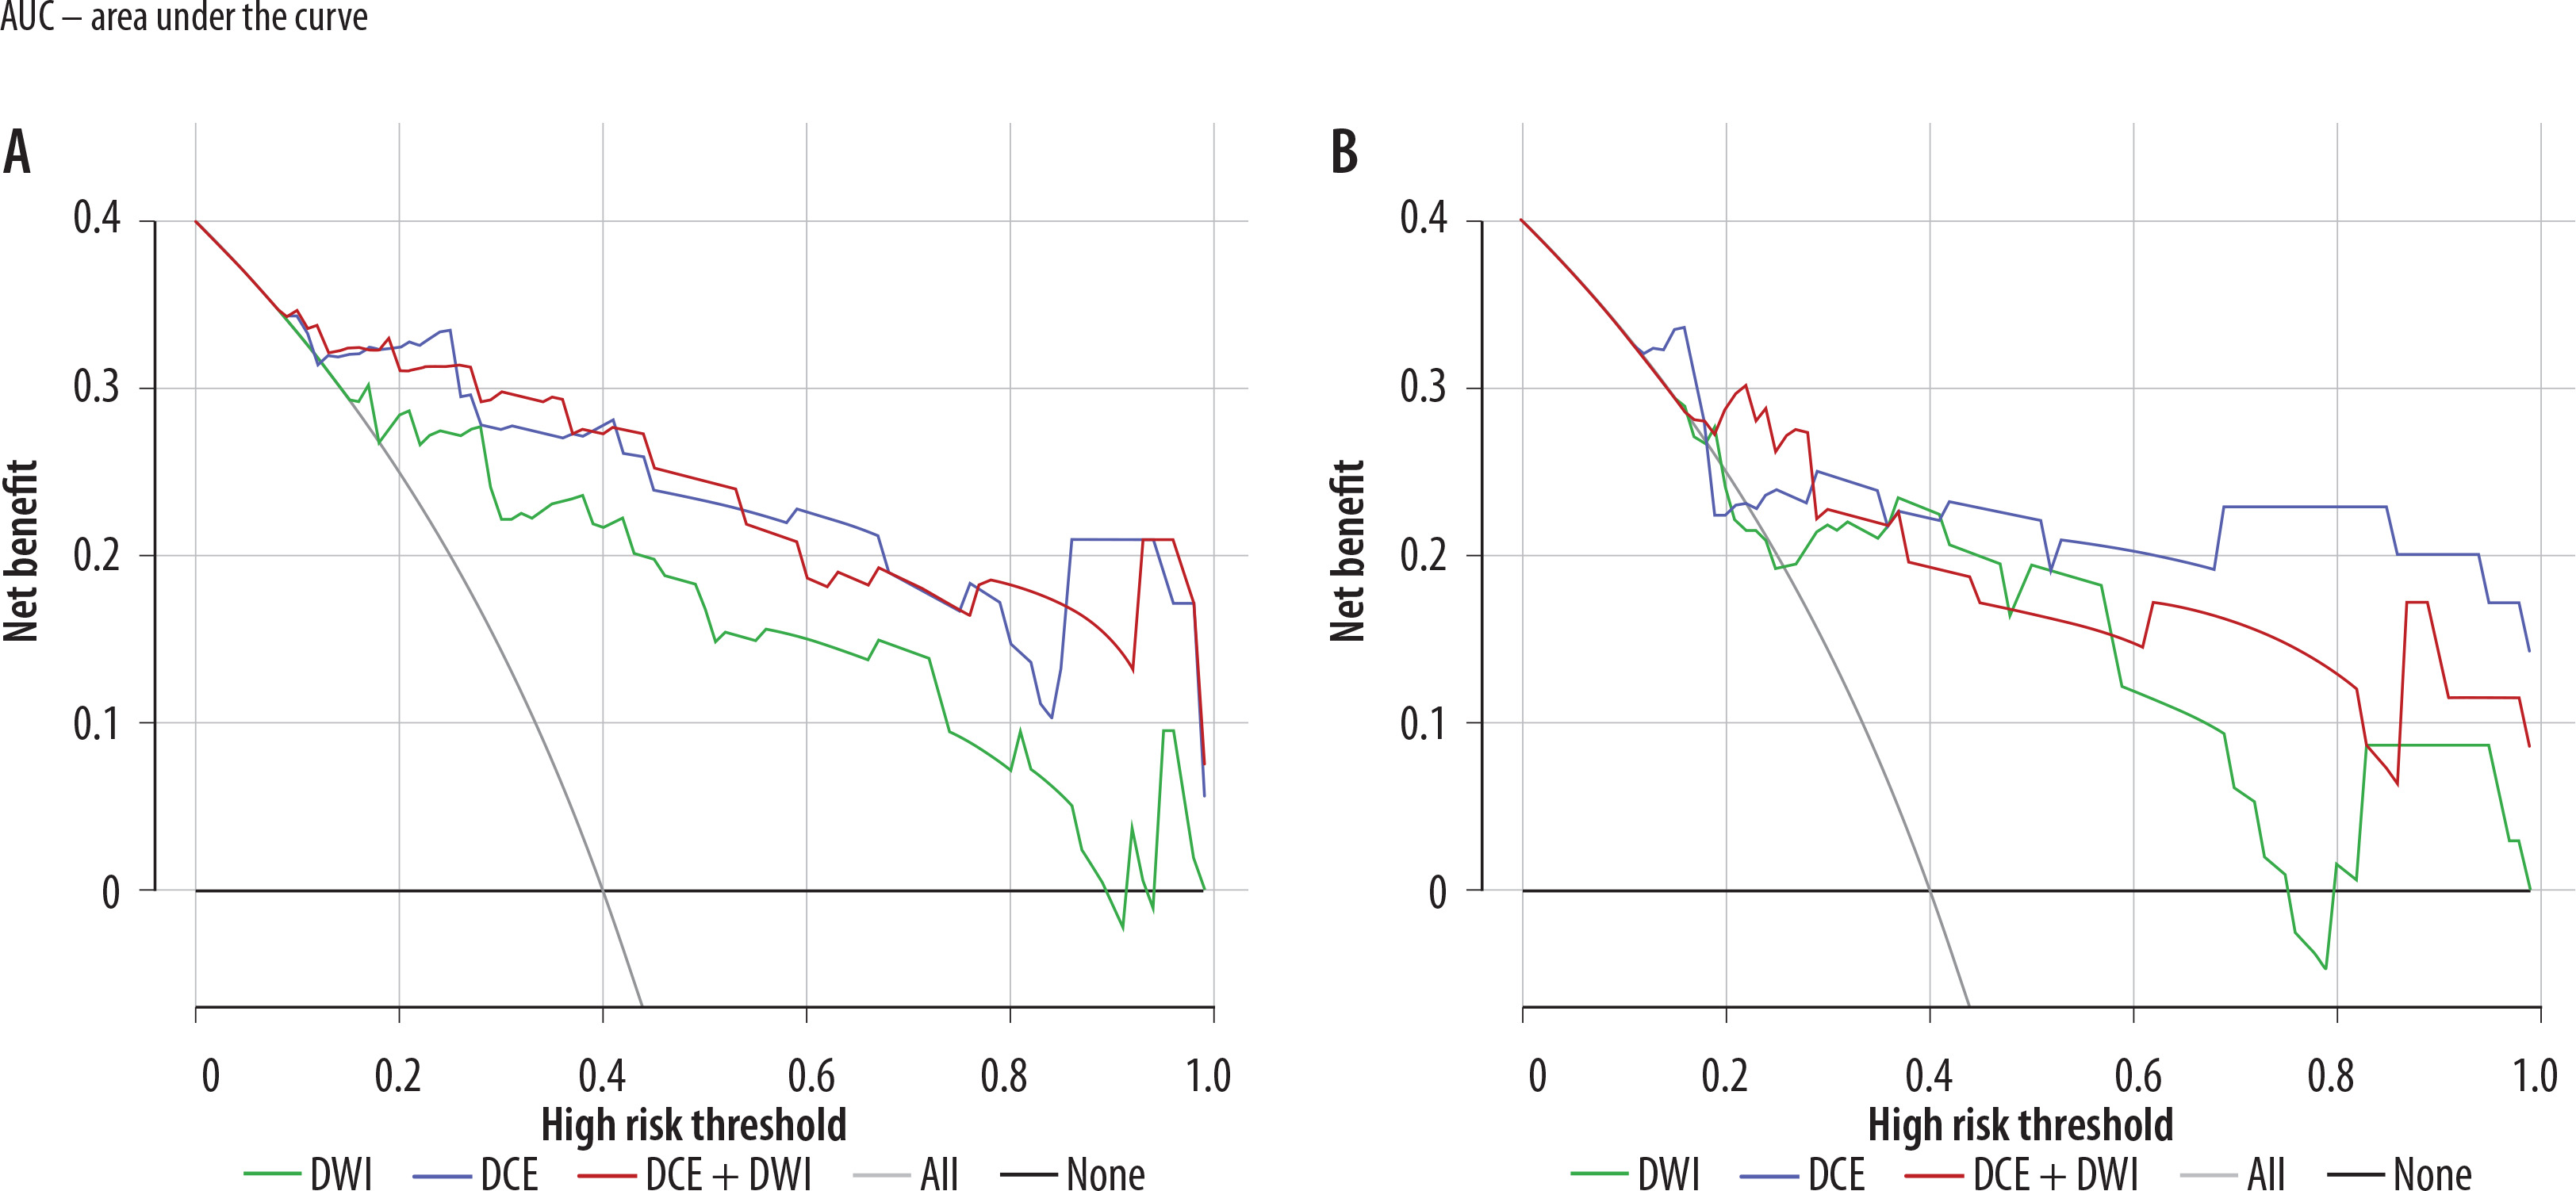
Based on the LR classifier, the performances of DWI, DCE-MRI, and DWI + DCE-MRI radiomics models are displayed in Table 4, and ROC curves are shown in Figure 4. In the training cohort, the AUCs of DWI, DCE-MRI, and DWI + DCE-MRI were 0.839, 0.903, and 0.915, respectively. In the test cohort, the AUCs of DWI, DCE-MRI, and DWI + DCE-MRI were 0.769, 0.847, and 0.861 respectively. The DWI+DCE-MRI combined radiomics model demonstrated a higher AUC compared to the DWI-only model (p = 0.05), but no significant difference was observed between the DCE-only model and the combined radiomics model (p = 0.549). The decision curve demonstrated sufficient performance of the DWI + DCE-MRI radiomics models for preoperative PGT prediction (Figure 5).
Table 4
Diagnostic performance of various radiomics models for differential diagnosis
Figure 4
Receiver operative characteristic curves of diffusion-weighted imaging (DWI) or dynamic contrast-enhanced (DCE)-magnetic resonance imaging (MRI) only, as well as combined DWI and DCE-MRI for distinguishing benign from malignant parotid gland tumors (PGTs) in the training (A) and test (B) cohorts, respectively
AUC – area under the curve
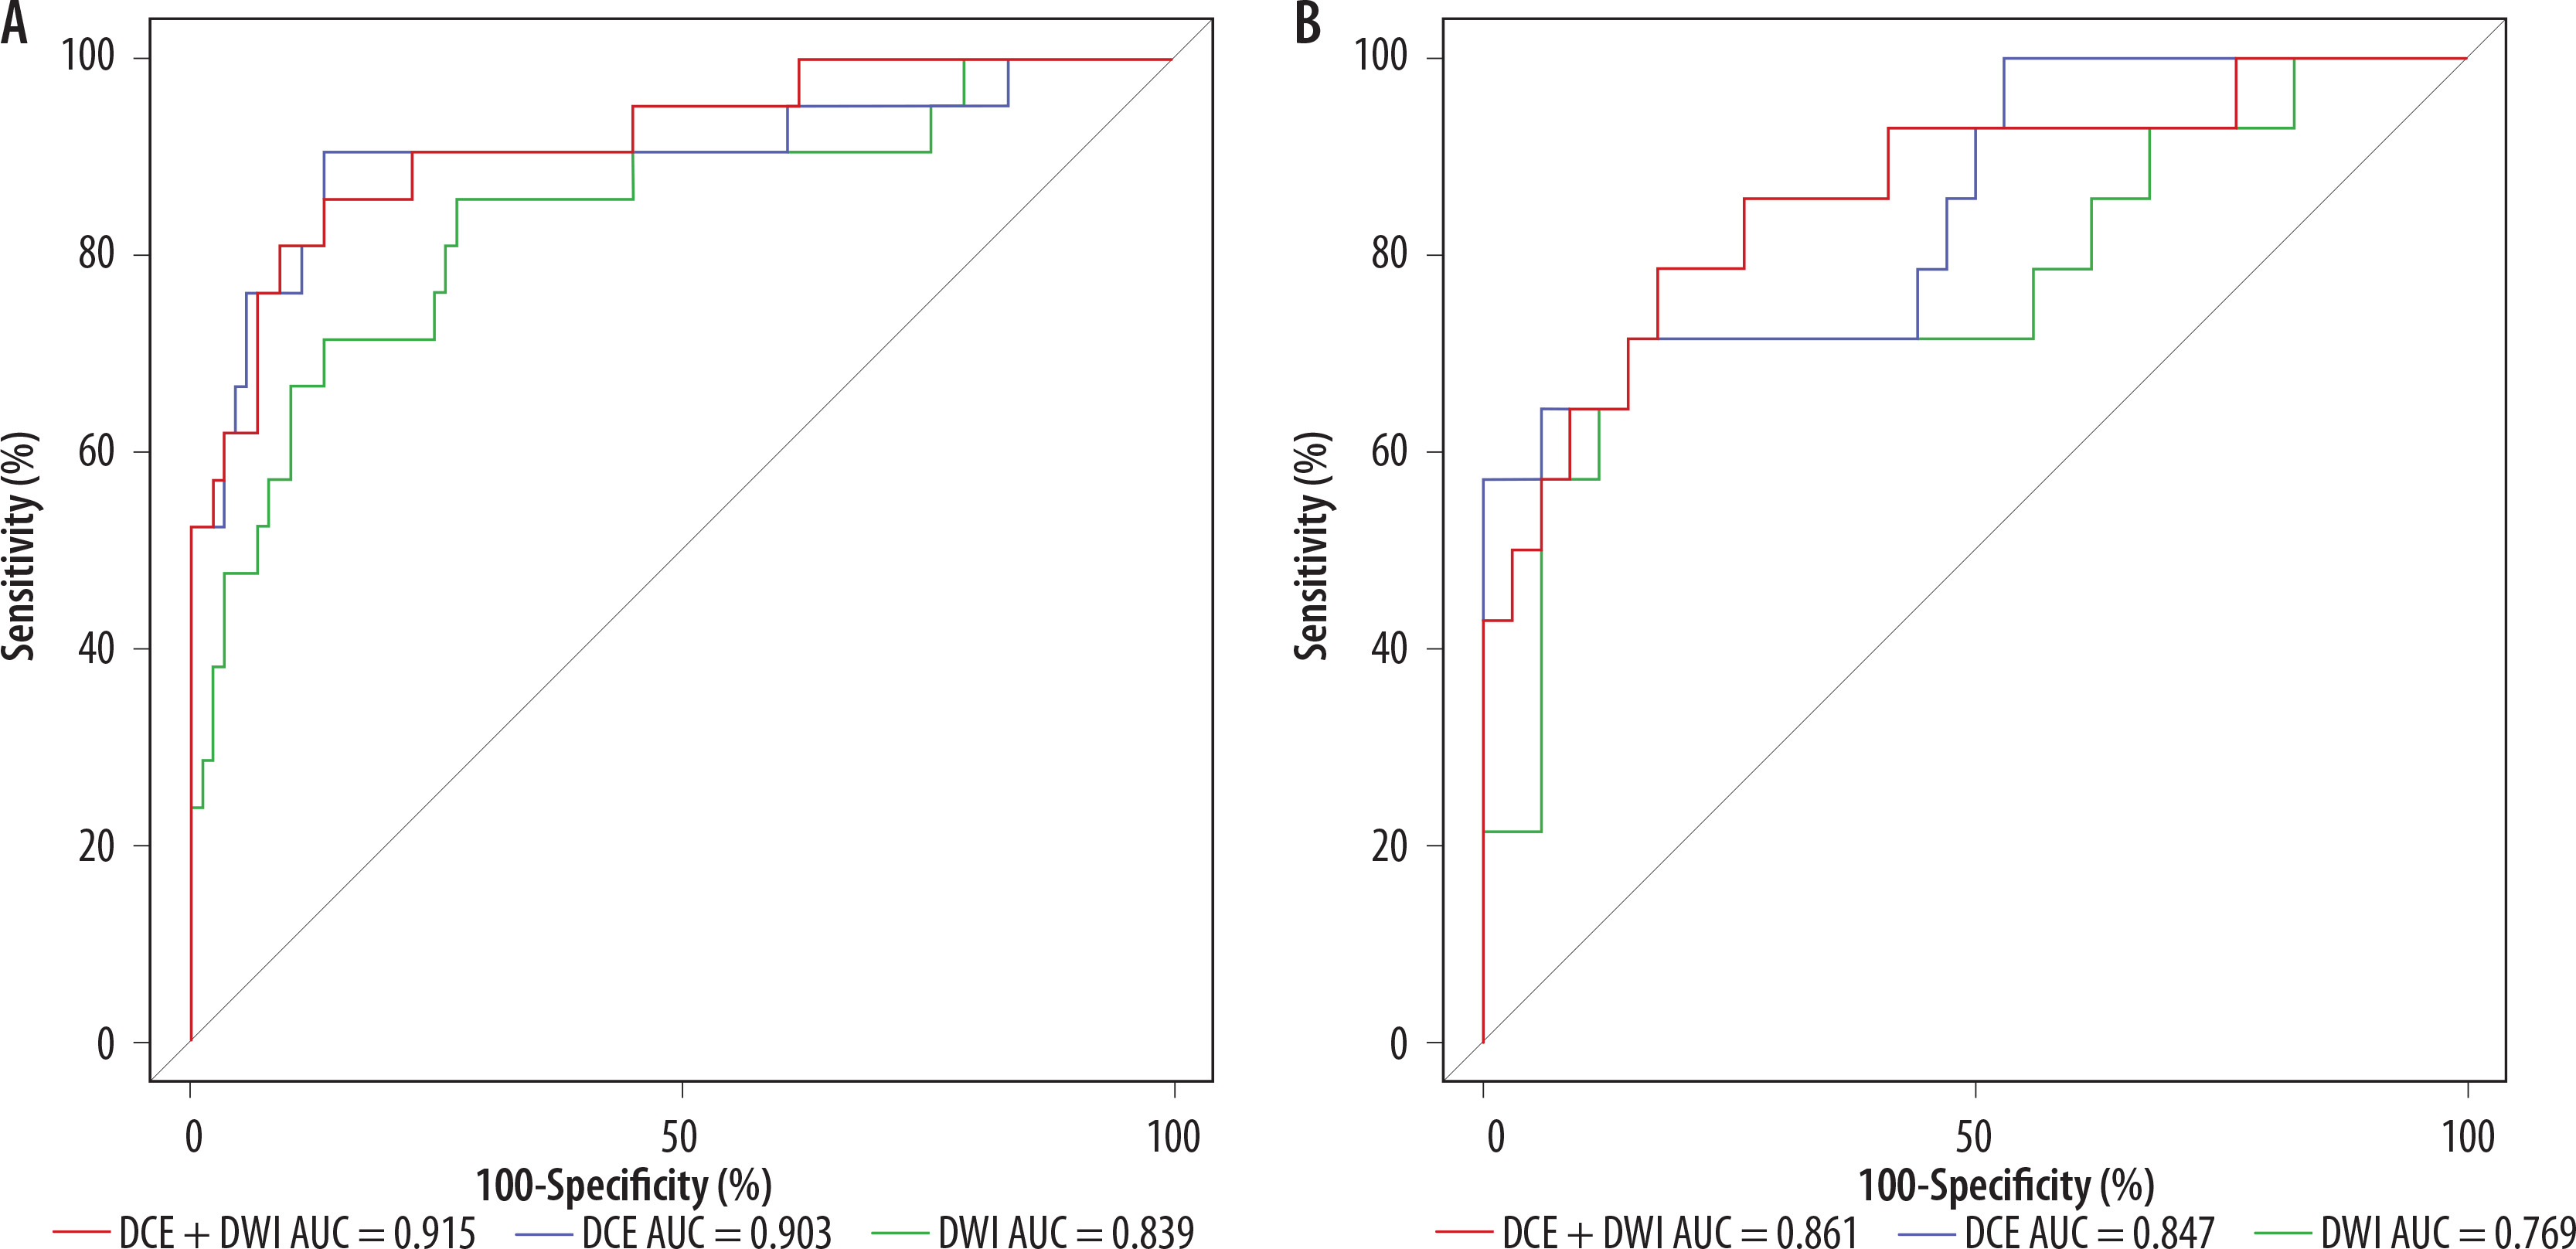
Figure 5
DCA curve of the radiomics model for the prediction of differentiation of PGTs in the training (A) and test (B) cohorts. Y-axis represents the net benefit, which is calculated by subtracting the proportion of false positives from the proportion of true positives. The X-axis is the probability threshold
DCA – decision curve analysis, DCE – dynamic contrast-enhanced, DWI – diffusion-weighted imaging
Discussion
The present study developed radiomics models based on DWI and DCE-MRI using several commonly applied machine-learning algorithms to differentiate benign and malignant PGTs. Our findings indicated that the radiomics based on DWI and DCE-MRI may effectively discriminate malignant from benign parotid lesions, and the LR was selected as the optimal classifier. It holds promise as a feasible and reliable noninvasive method for evaluating PGTs.
Accurate differentiation between benign and malignant PGTs is crucial due to their significant differences in treatment and prognosis, and radiological characteristics have the potential to facilitate their precise discrimination. The semi-quantitative and quantitative parameters from DWI and/or DCE-MRI have been investigated for PGT characterization, but have demonstrated variable and generally moderate diagnostic efficiency (AUC: 0.615-0.85) [10-13]. These semiquantitative and quantitative parameters analyses are highly susceptible to variability in contrast media injection, standardizing scanning techniques, and image post-processing calculation [24]. Additionally, these studies have had limited sample sizes, contributing to discrepancies in the results. Hence, it is desirable to have more reliable markers that use large sample sizes to identify the status of parotid gland lesions. This study developed and validated radiomics models based on DWI, DCE-MRI, and DWI + DCE-MRI for differentiating benign and malignant parotid gland lesions. To our knowledge, this is the first study to apply MRI-based radiomics integrating both DWI and DCE-MRI for PGT classification. The DWI, DCE-MRI, and DWI + DCE-MRI radiomics models exhibited AUCs of 0.839, 0.903, 0.915 in the training cohort and of 0.769, 0.847, 0.861 in the test cohort, respectively. The radiomics models based on the DWI and DCE-MRI sequences in our study have higher AUCs than the semi-quantitative or quantitative parameters alone in most previous studies [10-13], indicating that radiomics models based on functional sequences can improve the efficiency of differential diagnosis. This finding is consistent with the previous understanding that radiomics can extract numerous quantitative features from imaging data to quantify tumor heterogeneity, which have significance for improving the diagnosis efficacy, prognosis, and individualized treatment [25].
The combined radiomics model based on DWI + DCE-MRI achieved the highest AUC compared with the DWI or DCE-MRI radiomics model in this study. Similar results were observed in the evaluation of isocitrate dehydrogenase 1 mutation and angiogenesis in gliomas [26] and breast cancer diagnosis [27], where the radiomics model based on DWI and DCE-MRI yielded the highest AUC relative to single-sequence models. This could be due to the fact that DWI and DCE-MRI provide distinct complementary information about tumor characteristics. DCE-MRI reflects tumor neoangiogenesis required for malignant progression [28], while DWI captures microstructural information related to cellularity and cell density [10]. Multiparametric MRI allows multidimensional evaluation of tumor development and provides crucial information on tumor heterogeneity. Consequently, the DWI+DCE-MRI radiomics model offers a more comprehensive depiction of tumor complexity than single-sequence models, thereby substantially improving diagnostic performance.
Previously, several studies have used radiomics analysis based on multi-sequence MRI to differentiate malignant from benign PGTs [15,17,18]. As recently reviewed by Gündüz et al. [29], this research confirms the broad potential of radiomics for differentiating malignant from benign PGTs. The reported AUC values for MRI-based models typically range from approximately 0.7 to over 0.9. Zheng et al. [15] reported that a radiomics signature from T1W and fat-saturated T2W images performed well in differentiating malignant from benign PGTs, with an AUC of 0.944 in the training cohort and 0.908 in the test cohort. Qi et al. [17] reported good diagnostic performance for discriminating between benign and malignant PGTs (AUC = 0.863) using a multi-sequence combined radiomics model (fat-saturated T2WI, ADC maps, and contrast-enhanced T1WI). In a recent study, Muntean et al. [18] also verified the effectiveness of a radiomic signature extracted from conventional T2 and contrast-enhanced T1 sequences (test AUC = 0.786). The diagnostic performance of our study was comparable or superior to that of the studies cited above, indicating that radiomics based on multiparameter functional MRI (DWI and DCE-MRI) has good predictive performacnence for differentiating between benign and malignant PGTs. Conventional MRI primarily depicts morphological features and lacks the ability to capture detailed physiological changes within tumors. Conversely, functional DWI and DCE-MRI sequences provide complementary biological information, with DWI assessing water diffusion related to tumor cellularity and DCE-MRI capturing perfusion dynamics reflecting microvascular alterations [30]. Therefore, their combined radiomics model can reflect different tumor histopathology, and yield the optimal diagnostic performance in our study. In clinical practice, the model can function as a non-invasive auxiliary tool to aid radiologists and head-neck surgeons in categorizing patients into risk-based management strategies. For example, patients identified as having a high risk of malignancy by the model can be given priority for more comprehensive preoperative planning, which includes the consideration of total parotidectomy, facial nerve monitoring, or intraoperative frozen section analysis. In contrast, patients with low-risk scores may be suitable candidates for conservative or limited resection methods, thus reducing unnecessary surgical morbidity. Furthermore, the radiomics signature can be integrated into a multimodal diagnostic panel along with conventional MRI features and fine-needle aspiration cytology results. Such an integrated approach may enhance diagnostic certainty, especially in cases with ambiguous imaging manifestations or inconclusive biopsy outcomes.
The success of radiomics depends largely on the selection of an appropriate machine learning model to ensure reliable and efficient model performance [14]. Machine learning methods can accurately capture complex relationships among numerous variables, which is often challenging for traditional statistical models [31]. Previous studies have shown that radiomics combined with machine learning improves evaluation of tumor heterogeneity [32]. Nevertheless, the optimal machine learning algorithm may vary across different clinical scenarios [22]. In this study, we trained LR, NaiveBayes, SVM, KNN, RF, and XGBoost classification algorithms to establish models for differentiation of PGTs. Our results showed that LR achieved the most favorable performance with strong stability and computational efficiency, which is similar to the previous studies [33,34]. LR has been widely applied due to its simple structure and high coefficient interpretability [35]. However, in another study, Zheng et al. [20] developed CT-based radiomics models using LR, RF, and SVM for differentiating benign and malignant PGTs, and found that SVM and RF models performed better than the LR model, which is inconsistent with our findings. The reasons for the inconsistency might be different sample size. Complex models, such as the RF algorithm, which integrates multiple decision trees through ensemble learning, can face challenges in terms of generalization ability when dealing with small sample cohorts, potentially resulting in overfitting [20,36]. The overfitting observed in complex models (RF, XGBoost) highlights a significant methodological risk in radiomics studies with restricted samples. Nonlinear models with high capacity have numerous parameters and can readily memorize dataset-specific noise and spurious correlations when training data are insufficient, particularly under class imbalance conditions [37]. This results in an overestimated performance of the model on the training set and a suboptimal generalization ability to independent data, which represents a crucial limitation for its clinical application. Conversely, relatively simple regularized models, such as logistic regression, demonstrate lower variance and higher robustness under these circumstances [38]. Consequently, in small-sample scenarios, selecting simpler and more interpretable models is a prudent approach to guarantee reliable and clinically significant results [39]. Our finding provides further confirmation that radiomics combined with LR can serve as a valuable problem-solving tool in clinical diagnosis for small-sample applications.
This research acknowledges several limitations. Firstly, the dataset employed in this study has intrinsic constraints. It is sourced from a single institution, which hinders external validation and may restrict the model’s generalizability across various populations and imaging protocols. Furthermore, the cohort exhibits a class imbalance with a notably smaller number of malignant cases, a factor that could affect model calibration and warrants validation in a larger, more balanced sample. Thirdly, methodological aspects are amenable to refinement. Despite ensuring feature reproducibility via rigorous inter-observer intra-class correlation coefficient (ICC) analysis, the manual delineation of regions of interest (ROIs) remains vulnerable to subjective variability and constitutes a potential source of segmentation-related bias. Finally, the scope of the analysis was purposefully confined in our study. In order to establish a distinct benchmark for functional MRI radiomics, we refrained from integrating patient clinical features or other advanced MRI sequences (e.g., diffusion kurtosis imaging), which have demonstrated utility in previous investigations.
Future research ought to concentrate on several crucial enhancements. Firstly, the implementation of semi-automated or fully automated segmentation methods can mitigate observer dependency and augment reproducibility. Secondly, the construction of larger, multi-center cohorts is indispensable for validating and enhancing the generalizability of models across diverse clinical contexts. Thirdly, the exploration of advanced modeling methodologies, such as deep learning for feature extraction or end-to-end classification, may further elevate diagnostic performance and operational efficacy.
Conclusions
In conclusion, a radiomics model that combines DWI and DCE-MRI is valuable for differentiating between benign and malignant PGTs. The combined model using LR demonstrated superior diagnostic performance, which can provide valuable information for clinical decision-making regarding treatment for PGTs.