Introduction
Lung cancer is the leading cause of cancer morbidity and mortality worldwide [1]. As the understanding of lung cancer has deepened, numerous subtypes of lung cancer have come to the attention of a wide spectrum of researchers. Cystic lung cancer, a form of lung cancer with unique imaging characteristics, has attracted the attention of clinicians with the increasing number of case reports. Cystic lung cancer is a localised lesion with a round or irregular air-containing cystic cavity with clear boundaries, accompanied by solid nodules and/or hairy glass components, with the maximum diameter of the cystic cavity ≥ 5 mm, the thickness of the cystic wall ≤ 4 mm, and the extent of the cystic wall ≥ 1/2 [2]; its incidence accounts for 3.7-9.3% of the total number of lung cancers [3,4], and the prognosis is worse than that of patients with the same stage of non-cystic lung cancers [5]. Meanwhile, the cystic lung cancer may have thin and homogeneous cystic walls, and the early imaging presentation is atypical, making it difficult to differentiate it from benign cystic lesions, because this type of lung cancer is easy to misdiagnose and is hence underdiagnosed [6]. In 2022, the Fleischner Society updated the guidelines for the management of atypical lung cysts to include lesions with atypical features of endogenous or exogenous wall nodules, thickening of the cyst wall, and cystic luminal changes in the lung cysts [7]. In one study, 18.8% of atypical lung cysts were eventually diagnosed as cystic lung cancer [8]. Therefore, correctly recognising cystic lung nodules, including atypical lung cysts, is important for the early detection of cystic lung cancer.
In recent years, a range of models useful for lung nodule diagnosis has significantly increased the detection rate of malignant nodules and made it easier to create individualised treatments that benefit more patients [9]. Existing studies have rarely explored the relationship between imaging and the nature of disease in cystic lung cancer. Based on this, this paper aims to build a risk prediction model for malignant cystic lung nodules by combining the imaging features of this type of lung nodule with the clinical case characteristics to provide clinical guidance.
Material and methods
Baseline information
Patients who attended our hospital from January 2019 to December 2022 with cystic lung nodules on lung CT imaging were selected, and a total of 258 patients with pulmonary cystic nodules were included. The enrolled cases were divided into a benign group (n = 104) and a malignant group (n = 154) based on the results of surgical and pathological examinations. Inclusion criteria: 1) Single cystic lung nodule on imaging (The Fleischner Society defines a cystic nodule as any well-defined lesion surrounded by epithelium or fibres, usually with a wall thickness of < 2 mm, based on the differentiation of a cavitary nodule [wall thickness > 2 mm] [7]. The inclusion of patients in the present study included atypical pulmonary cystic nodules updated by the Fleischner Society for the year 2022 [10]). 2) No treatment before surgery. 3) No combination of emphysema, bronchiectasis, interstitial lung disease, lung abscess, and other diseases. Exclusion criteria: 1) Those with poor respiratory control, resulting in poor quality of imaging images and affecting judgment. 2) Those with a history of combined malignant tumours, such as breast cancer, renal cancer, and liver cancer. 3) Those with combined psychiatric disorders and haematological disorders. 4) Those with multiple foci of disease in both lungs.
Imaging
The instrumentation was the Siemens spiral computed tomography (CT) machine. Scanning order: from lung apices to lung base; scanning range: neck to upper abdomen. Observations: under the same criteria, both mediastinal and lung window ima-ges were independently read by 2 thoracic surgeons with senior titles under double-blind conditions, and if there was a controversy between the 2 diagnostic conclusions, they were deliberated.
Imaging data recording content: 1. Cystic structure data: length-to-diameter ratio (on the CT image, select the level with the largest nodule, take the same level as the basis, the largest long axis of the nodule is recorded as a, and the corresponding short axis is recorded as b, the largest long axis of the cavity containing the balloon is recorded as c, and the same short axis is recorded as d; length-to-diameter ratio is (c + d)/(a + b)), shape, thickness of the cystic wall, nature of the inner and outer edges of the cystic wall (the degree of smoothness, burr, and lobulation), nature of the nodule (ground glass/solid density), and number of cystic cavities. 2. Peripheral features: vascular penetration, bronchial penetration, and pleural stretching (according to the ‘Fleischner Society: Glossary of Terms for Thoracic Imaging [11]).
Serological tests
The following indicators were recorded based on the patient’s preoperative serological indicators: NLR (neutrophil-to-lymphocyte ratio), PLR (platelet-to-lymphocyte ratio); and oncological indicators, such as CEA, CA199, CA125, NSE, and squamous cell keratin.
Pathological information
Postoperative pathological history data were collected, and for pathological reports of confirmed malignant nodules, data related to pathological type, grading, and immunohistochemistry of the patients were obtained. The pathological classification was based on the 2021 WHO (World Health Organisation) lung tumour classification standard.
Pathological histological grading was defined as follows: 1) carcinoma in situ: lesions confined to the epithelial layer; 2) low differentiation: high-grade component of any lung adenocarcinoma ≥ 20%; 3) medium differentiation: predominantly vesicular or papillary, no high-grade component or high-grade component < 20%; and 4) high differentiation: predominantly adherent wall growth, no high-grade component or high-grade component < 20%.
Statistical analysis
Data analysis was performed using SPSS 25.0 statistical software. Measurement data were expressed as means or medians and analysed using t-tests; count data were expressed as frequencies (n) and percentages (%), and preliminary univariate analysis was conducted using chi-square tests. Statistically significant indicators were included in a multivariate Cox regression model and visualised using forest plots. All tests were two-sided, and p < 0.05 was considered statistically significant.
Results
General information
The differences between benign and malignant patients in terms of gender, smoking, and general serological indices (neutrophils/lymphocytes, platelets/lymphocytes) were not statistically significant; however, age (p = 0.021) and tumour-related indices, such as CEA (p = 0.027) and CA199 (p < 0.001), were statistically significant (Table 1).
Table 1
Clinical baseline characteristics
| Factor | Diagnose | χ2/Za | p-value | |
|---|---|---|---|---|
| Malignancy, n = 154 | Benign, n = 104 | |||
| Smoke, n (%) | ||||
| Yes | 56 (58.95) | 39 (41.05) | 0.034 | 0.853 |
| No | 98 (60.12) | 65 (39.88) | ||
| Sex, n (%) | ||||
| Famale | 66 (42.9) | 46 (44.2) | 0.048 | 0.827 |
| Male | 88 (57.1) | 58 (55.8) | ||
| Age (years), mean ± SD | 58.34 ± 11.75 | 51.47 ± 12.20 | 4.538 | 0.021* |
| CEA | 4.16 ± 5.91 | 2.27 ± 1.53 | 5.009 | 0.027* |
| CA125 | 12.38 ± 7.05 | 12.91 ± 7.55 | 0.183 | 0.670 |
| CA199 | 12.71 ± 8.47 | 8.87 ± 5.75 | 8.074 | < 0.01** |
| NSE | 15.54 ± 6.31 | 17.17 ± 10.91 | 1.349 | 0.247 |
| SCC | 1.35 ± 0.97 | 1.11 ± 0.54 | 2.661 | 0.105 |
| Lymphocyte | 1.51 (1.17, 1.85) | 1.54 (1.13, 1.88) | –0.031 | 0.976 |
| Platelet | 207.50 (164,240.25) | 210.50 (182,273.75) | –2.937 | 0.103 |
| NLR | 3.44 ± 3.55 | 4.05 ± 3.69 | –1.337 | 0.263 |
| PLR | 165.40 ± 118.23 | 177.14 ± 93.28 | –0.844 | 0.400 |
Imaging
This study included 258 patients, including 154 cases of cystic lung cancer and 104 cases of benign cystic nodules of the lung. The diameter of the cavity of benign lesions was closer to the overall diameter of the nodule than that of malignant cystic pulmonary nodules, and it was noteworthy that the length-to-diameter ratios of the lesions were statistically significant in both groups of patients (p < 0.001). Malignant lesions often showed irregularity (n = 90), burr sign around the lesion, pleural pulling, grinding glass sign around the lesion, uneven thickness of the cystic wall, multiple cystic cavities, and non-smooth lining of the cystic cavity (p < 0.01) (Table 2).
Table 2
Image characteristics
| Factor | Benign, n = 104 | Malignancy, n = 154 | χ2/Za | p-value | ||
|---|---|---|---|---|---|---|
| Position, n | ||||||
| Top right | 42 | 47 | 7.741 | 0.102 | ||
| Right centre | 7 | 14 | ||||
| Bot right | 23 | 32 | ||||
| Top left | 11 | 35 | ||||
| Bot left | 21 | 26 | ||||
| Shape, n | Regular | Irregular | Regular | Irregular | 5.728 | 0.017* |
| 56 | 48 | 64 | 90 | |||
| Length-to-diameter ratio (M,P25-P75) | 0.95 (0.73,0.96) | 0.77 (0.50,0.86) | –7.847 | 0.501 | ||
| Burr sign, n (%) | ||||||
| No | 49 (31.8) | 59 (56.7) | 15.831 | < 0.01** | ||
| Yes | 105 (68.2) | 45 (43.3) | ||||
| Lobulation, n (%) | ||||||
| No | 89 (57.8) | 63 (60.6) | 0.199 | 0.156 | ||
| Yes | 65 (42.2) | 41 (39.4) | ||||
| Pleural indentation sign, n (%) | ||||||
| No | 96 (61.0) | 93 (89.4) | 25.074 | < 0.01** | ||
| Yes | 60 (39.0) | 11 (10.6) | ||||
| Vascular penetration, n (%) | ||||||
| No | 111 (72.1) | 78 (75.0) | 0.271 | 0.603 | ||
| Yes | 43 (27.9) | 26 (25.0) | ||||
| Bronchial penetration, n (%) | ||||||
| No | 129 (83.8) | 96 (92.3) | 4.060 | 0.440 | ||
| Yes | 25 (16.2) | 8 (7.7) | ||||
| Ground-glass, n (%) | ||||||
| No | 59 (38.3) | 73 (70.2) | 25.251 | < 0.01** | ||
| Yes | 95 (61.7) | 31 (29.8) | ||||
| Mural nodule, n (%) | ||||||
| No | 123 (79.9) | 86 (82.7) | 0.321 | 0.571 | ||
| Yes | 31 (20.1) | 18 (17.3) | ||||
| Homogeneity of cyst wall thickness, n (%) | ||||||
| Yes | 29 (18.8) | 67 (64.4) | 55.228 | < 0.01** | ||
| No | 128 (81.2) | 37 (35.6) | ||||
| Number of cystic cavities, n (%) | ||||||
| = 1 | 59 (38.6) | 69 (66.3) | 19.118 | < 0.01** | ||
| > 1 | 94 (61.4) | 35 (33.7) | ||||
| Smooth lining of the cystic cavity, n (%) | ||||||
| Yes | 58 (37.3) | 71 (68.3) | 23.261 | < 0.01** | ||
| No | 96 (62.3) | 33 (31.7) | ||||
Factors associated with the prognosis of cystic pulmonary nodules
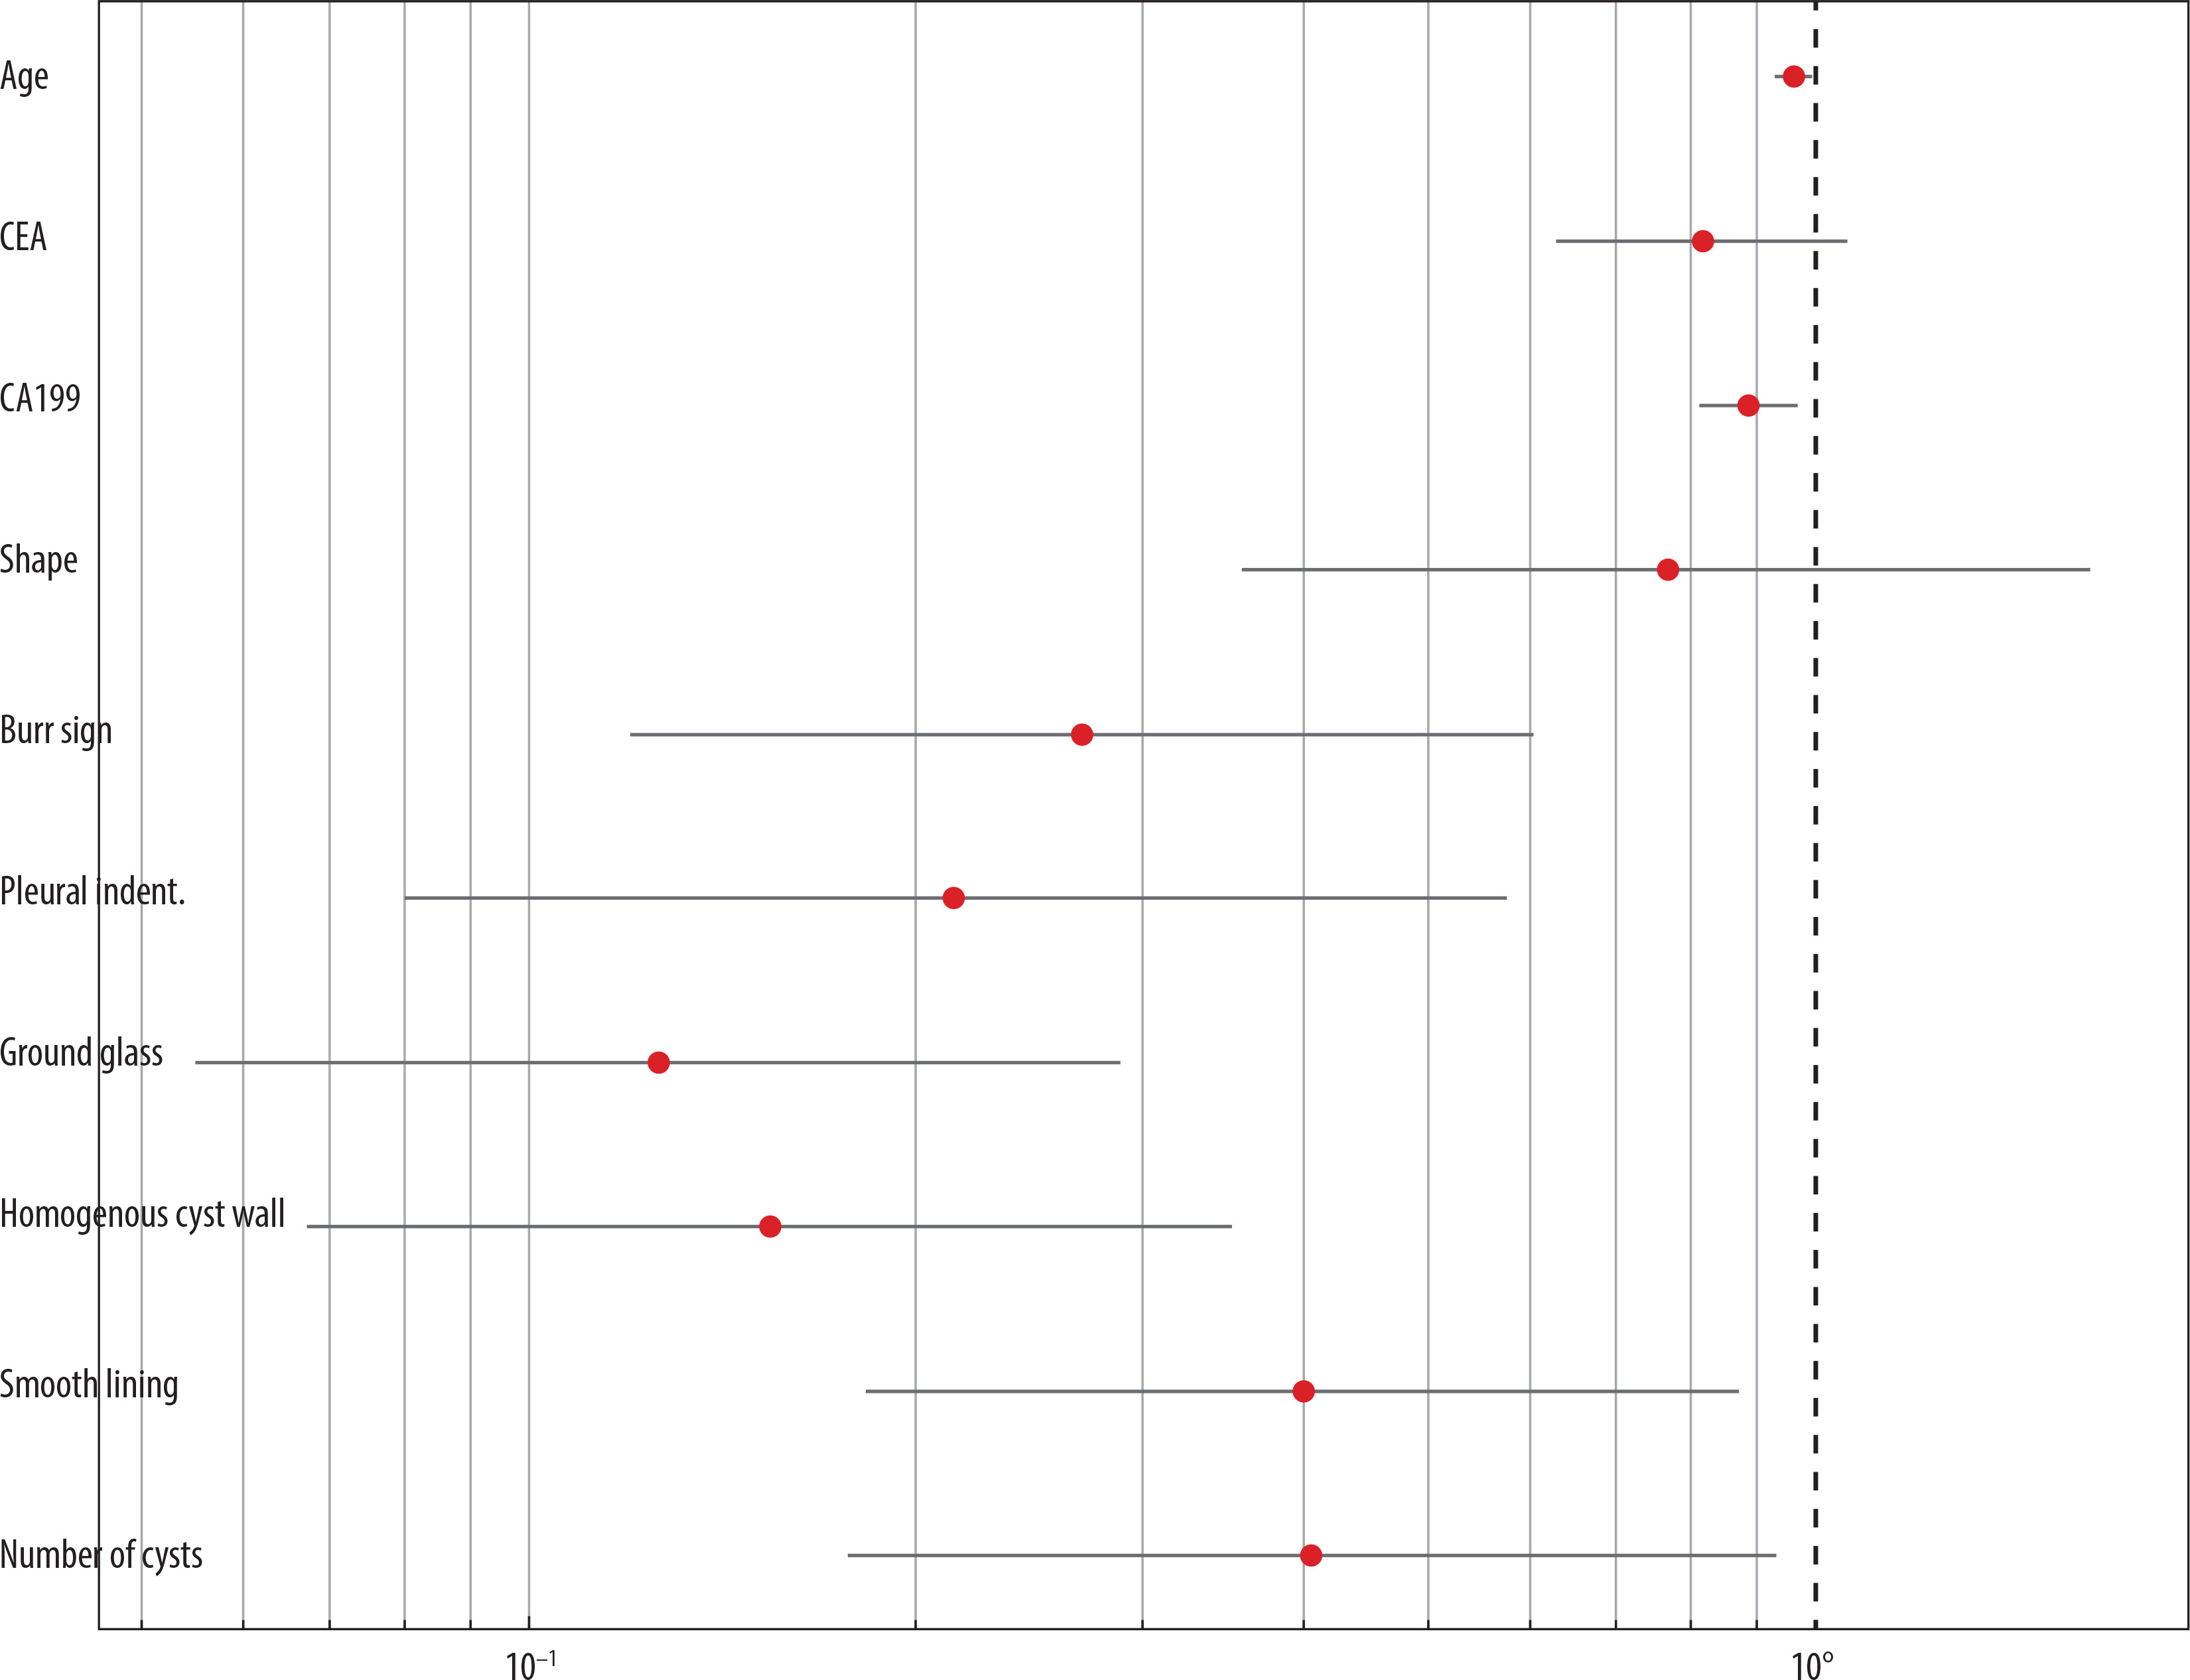
Indicators that were statistically significant in the univariate analysis-age, CEA, CA199, lesion shape, number of cystic cavities, smoothness of the cystic wall, homogeneity of cystic wall thickness, ground glass sign, burr, and pleural depression sign were included in the multifactorial COX regression model, in which age, CA199, burr sign, pleural depression sign, ground glass sign, homogeneity of cystic wall thickness or not, whether the capsule wall was smooth or not, and the number of capsule cavities, showed significant correlation in the multifactorial predictive modelling (p < 0.05) (Table 3, Figure 1).
Table 3
Multifactor regression analysis of COX
| Factor | β | Wald χ2 | p-value | HR (95% CI) |
|---|---|---|---|---|
| Age | –0.038 | 4.896 | 0.027* | 0.963 (0.931~0.996) |
| CEA | –0.202 | 2.306 | 0.195 | 0.817 (0.629~1.061) |
| CA199 | –0.118 | 6.785 | < 0.01** | 0.888 (0.813~0.971) |
| Shape | –0.265 | 0.468 | 0.474 | 0.767 (0.358~1.641) |
| Burr sign | –1.313 | 10.136 | < 0.01** | 0.269 (0.120~0.604) |
| Pleural indentation sign | –1.542 | 9.325 | < 0.01** | 0.214 (0.080~0.576) |
| Ground-glass | –2.073 | 23.758 | < 0.01** | 0.126 (0.055~0.289) |
| Homogeneity of cyst wall thickness | –1.873 | 19.574 | < 0.01** | 0.154 (0.067~0.352) |
| Smooth lining of the cystic cavity | –0.917 | 5.275 | 0.027* | 0.400 (0.183~0.874) |
| Number of cystic cavities | –0.901 | 4.512 | 0.027* | 0.406 (0.177~0.933) |
Pathological features of malignant cystic pulmonary nodules
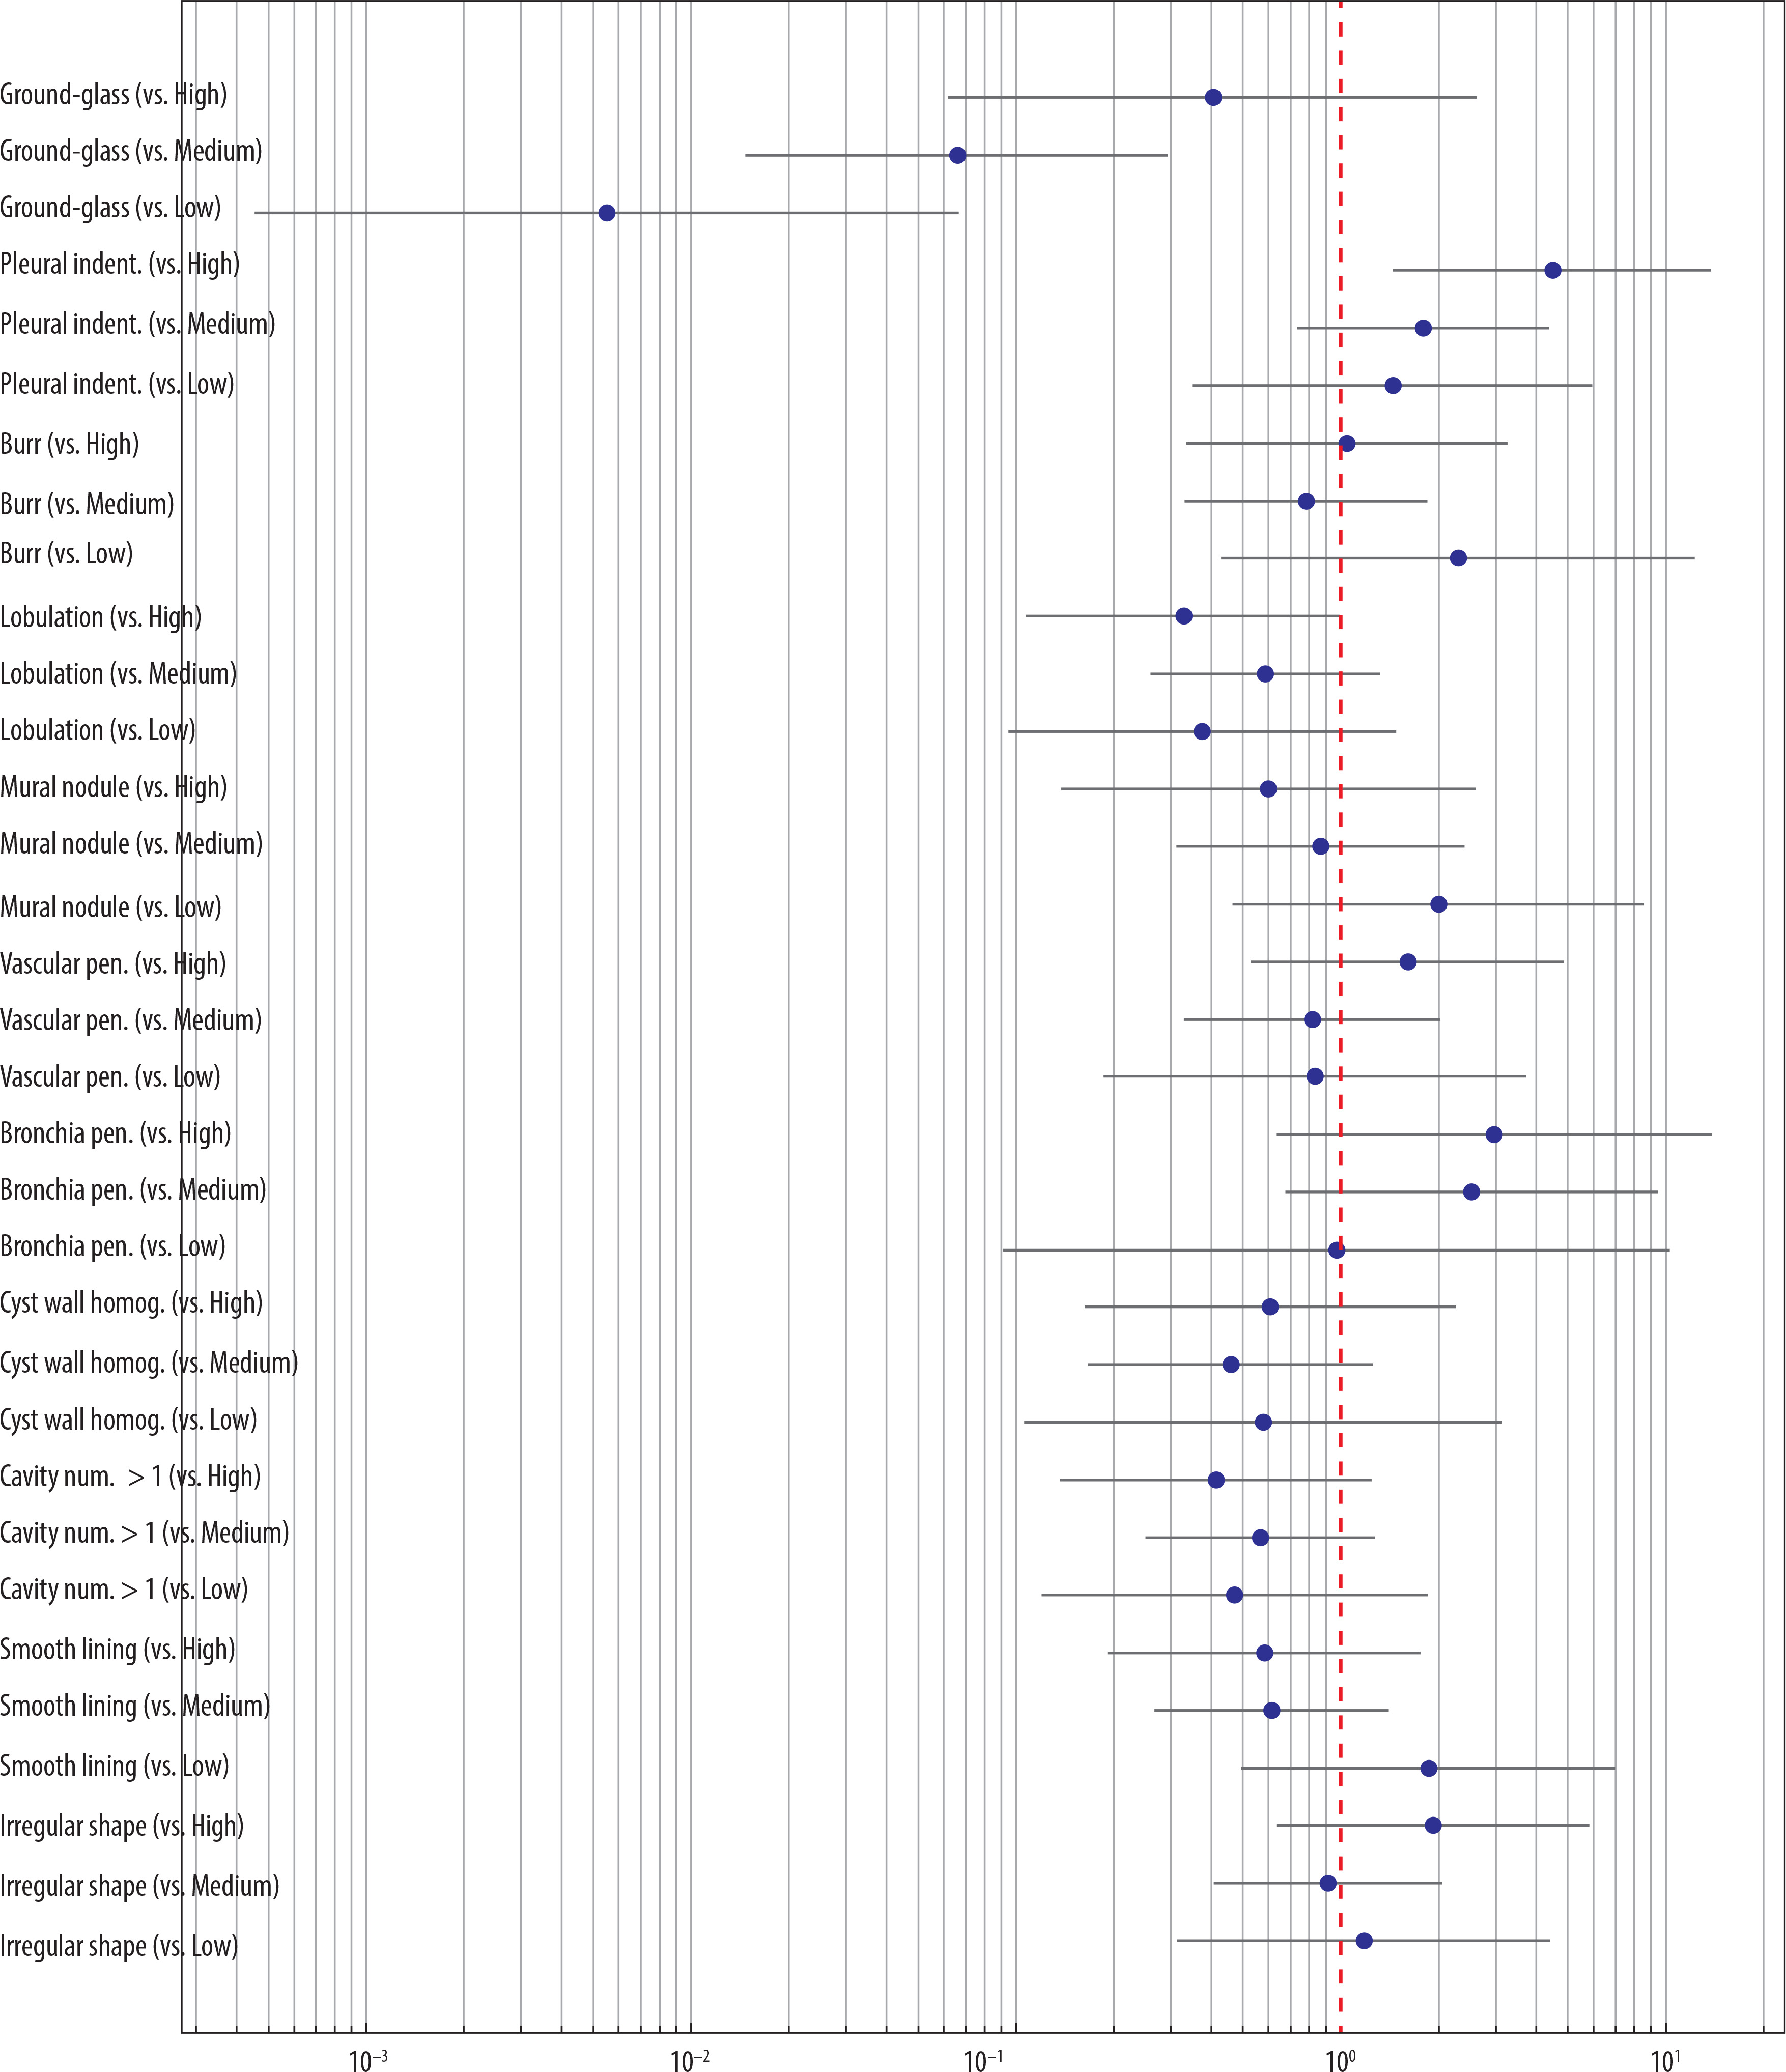
In this study, there were 143 adenocarcinomas and 11 non-adenocarcinomas in patients with malignant cystic lung nodules. Pathological characterisation of these 143 adenocarcinomas was performed, and subgroup analysis was performed according to pathological grading to investigate the differences between the imaging features and the different cystic adenocarcinoma infiltration models. The results showed that there was a statistically significant difference in the ground glass sign (p < 0.001) among the different pathologic grades (Table 4, Figure 2).
Table 4
Relationship between imaging features and pathologic grading
| Factor | AIS/MIA, n = 35 | High differentiation, n = 23 | Medium differentiation, n = 73 | Low differentiation, n = 12 | χ2/Z | p-value |
|---|---|---|---|---|---|---|
| Position, n (%) | ||||||
| Top right | 8 (22.9) | 6 (26.1) | 28 (38.4) | 1 (8.3) | 10.449 | 0.557 |
| Right centre | 5 (14.3) | 2 (8.7) | 6 (8.2) | 1 (8.3) | ||
| Bot right | 6 (17.1) | 7 (30.4) | 13 (17.8) | 4 (33.3) | ||
| Top left | 11 (31.4) | 4 (17.4) | 14 (19.2) | 3 (25) | ||
| Bot left | 5 (14.3) | 4 (17.4) | 12 (16.4) | 3 (25) | ||
| Shape, n (%) | ||||||
| Regular | 16 (45.7) | 7 (30.4) | 35 (47.9) | 5 (41.7) | 2.246 | 0.523 |
| Irregular | 19 (54.3) | 16 (69.6) | 38 (52.1) | 7 (58.3) | ||
| Burr, n (%) | ||||||
| No | 11 (31.4) | 7 (30.4) | 27 (37.0) | 2 (16.7) | 2.253 | 0.539 |
| Yes | 24 (68.6) | 16 (69.6) | 46 (63.0) | 10 (83.3) | ||
| Lobulation, n (%) | ||||||
| No | 15 (42.9) | 16 (69.6) | 41 (56.2) | 8 (66.7) | 4.725 | 0.193 |
| Yes | 20 (57.1) | 7 (30.4) | 32 (43.8) | 4 (33.3) | ||
| Pleural indentation sign, n (%) | ||||||
| No | 26 (74.3) | 9 (39.1) | 45 (61.6) | 8 (66.7) | 7.383 | 0.061 |
| Yes | 9 (25.7) | 14 (60.9) | 28 (38.4) | 4 (33.3) | ||
| Vascular penetration, n (%) | ||||||
| No | 25 (71.4) | 14 (60.9) | 55 (75.3) | 9 (75.0) | 1.798 | 0.615 |
| Yes | 10 (28.6) | 9 (39.1) | 18 (24.7) | 3 (25.0) | ||
| Bronchia penetration, n (%) | ||||||
| No | 32 (91.4) | 18 (78.3) | 59 (80.8) | 11 (91.7) | 3.334 | 0.343 |
| Yes | 3 (8.6) | 5 (21.7) | 14 (19.2) | 1 (8.3) | ||
| Ground-glass, n (%) | ||||||
| No | 2 (5.7) | 3 (13.0) | 35 (47.9) | 11 (91.7) | 45.214 | < 0.01** |
| Yes | 33 (94.3) | 20 (87.0) | 38 (52.1) | 1 (8.3) | ||
| Mural nodule, n (%) | ||||||
| No | 28 (80.0) | 20 (87.0) | 60 (82.2) | 8 (66.7) | 2.052 | 0.562 |
| Yes | 7 (20.0) | 3 (13.0) | 13 (17.8) | 4 (33.3) | ||
| Homogeneity of cyst wall thickness, n (%) | ||||||
| Yes | 9 (25.7) | 4 (17.4) | 10 (13.7) | 2 (16.7) | 2.257 | 0.521 |
| No | 26 (74.3) | 19 (82.6) | 63 (86.3) | 10 (83.3) | ||
| Number of cystic cavities, n (%) | ||||||
| = 1 | 17 (48.6) | 16 (69.6) | 45 (62.5) | 8 (66.7) | 2.280 | 0.516 |
| > 1 | 18 (51.4) | 7 (30.4) | 27 (37.5) | 4 (33.3) | ||
| Smooth lining of the cystic cavity, n (%) | ||||||
| Yes | 15 (42.9) | 7 (30.4) | 23 (31.5) | 7 (58.3) | 4.234 | 0.237 |
| No | 20 (57.1) | 16 (69.6) | 50 (68.5) | 5 (41.7) | ||
Discussion
Lung cancer is a major problem affecting public health, which brings a heavy burden to the governmental healthcare system and social economy [12]. Lung cancer with cystic lesions is a rare imaging presentation, and lung cancer associated with cystic cavities (LCCA) usually leads to missed or delayed diagnosis and is often misinterpreted as inflammation or infection [13]. Therefore, solid or ground-glass nodules containing cystic structures, which are cystic cavitary nodules of the lung with specific imaging manifestations, deserve to be explored with more covariate effect models consistent with diagnosis and prognosis.
Advanced age is a recognised risk factor for malignant lung nodules [14]. Our study showed that advanced age is a risk factor for malignant nodules, which is consistent with previous studies [15]. There is also a strong relationship between the development of lung cancer and smoking [16]. However, in the univariate analysis of this study, there was no significant difference in smoking history between benign and malignant cystic lesions, which could be attributed to differences in patient gender, age distribution, and level of patient health perceptions, all of which reduce the effect of smoking status on the malignant outcome. Serum tumour markers can reflect the presence and growth of tumours [17], and in this study, among the tumour indicators related to lung cancer, there was a significant correlation only with the CA199 indicator. Previous studies have suggested that the levels of tumour markers are influenced by the inflammatory state [18], which suggests that the levels of tumour markers do not have good sensitivity and specificity. The neutrophil-to-lymphocyte ratio (NLR) and platelet-to-lymphocyte ratio (PLR) are frequently utilised haematological parameters in clinical practice. Prior investigations have demonstrated that both NLR and PLR can exhibit varying degrees of elevation in both neoplastic and inflammatory conditions, although their patterns and magnitudes of change differ [19]. The findings of our study suggest that the diagnostic efficacy of NLR or PLR used in isolation was limited; however, the integration of these parameters with other biomarkers, such as the tumour markers CEA and CA125, can significantly enhance diagnostic accuracy.
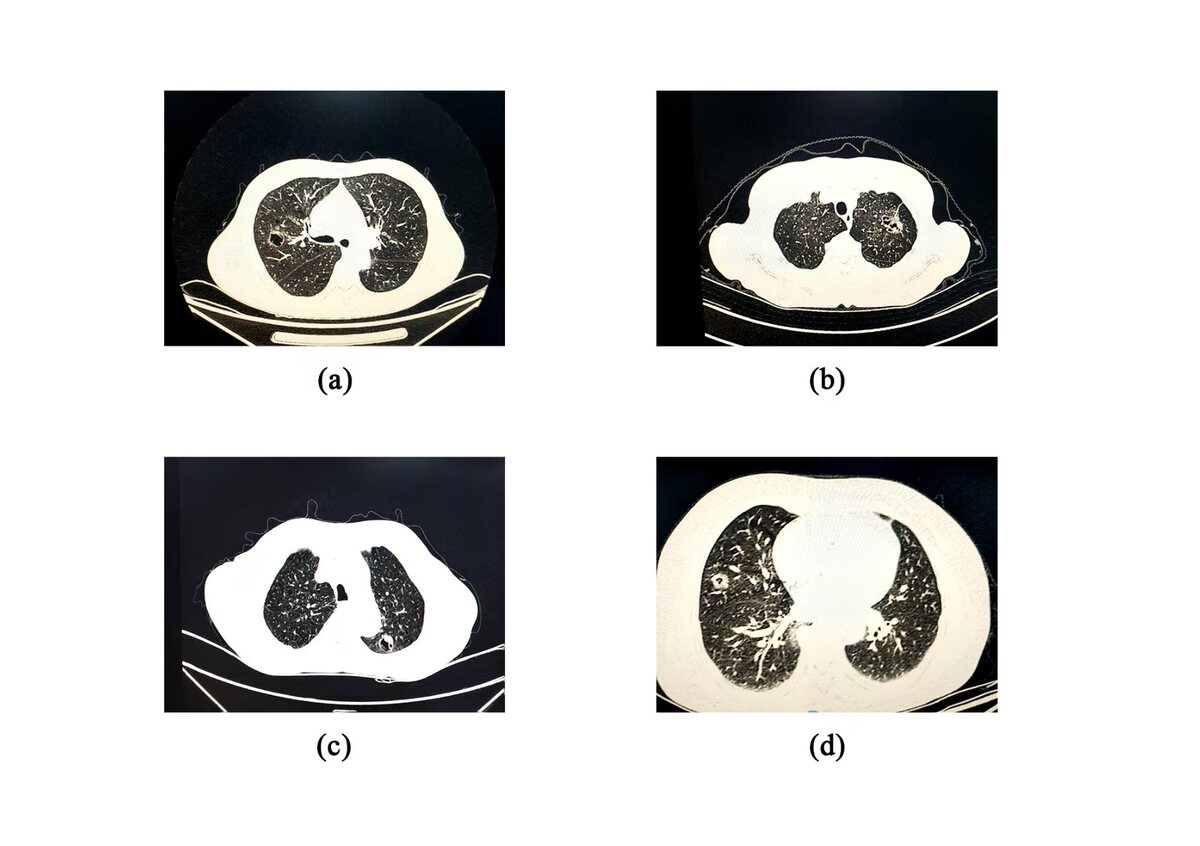
Cystic lung cancer presents with heterogeneous features on CT; however, key imaging characteristics suggestive of malignancy include irregular cyst wall thickness, internal septation, mural nodules, and uneven margins (Figure 3) [20]. In our study, we also incorporated the relationship between pulmonary nodules and surrounding tissues to explore imaging signs associated with malignancy. Malignant lung cancer cells are highly invasive, often resulting in irregular margins and the appearance of fine spiculations [21]. Consistent with previous findings by Si et al. [22], our results showed that the presence of a burr sign was an independent predictor of cystic lung cancer (p = 0.001, OR = 0.269). In the malignant transformation of pulmonary nodules, the growth of the lesion becomes unbalanced, leading to fibrous band formation [23]. Our data revealed a statistically significant association between the pleural indentation sign and malignant cystic nodules (p = 0.002, OR = 0.214). However, some studies [24] have questioned the diagnostic value of this sign in assessing the invasiveness of lung nodules. A study by Jung et al. [25] proposed that the imaging manifestations of cystic lung carcinoma are developmental, with a gradual increase in malignancy correlating with the progressive thickening of the capsule wall. Our findings partially align with this theory. Specifically, intracystic features such as the number of lumens (p = 0.034), wall smoothness (p = 0.022), homogeneity of wall thickness (p < 0.001), and the ground-glass opacity (GGO) sign (p < 0.001) were significantly associated with malignancy. Conversely, vascular penetration and lobulation were not significantly associated with GGO aggressiveness, possibly due to the smaller average size of the nodules and the relatively mild variation in growth across regions. In addition, intracystic septation and mural nodules were not statistically significant in our analysis, likely due to sample size limitations or confounding factors, highlighting the need for larger sample sizes and more refined statistical modelling in future studies.
Figure 3
A) Burr sign with vascular penetration, (B) separation is seen inside the cystic cavity, (C) ground glass shadow around the cystic cavity wall, and (D) thickening of the wall of the cystic cavity and visible wall nodules
As a separate subtype of lung cancer, cystic lung adenocarcinoma (LCA) has a worse prognosis than LCA without cystic air spaces [25], with LCA being the most prevalent subtype of cystic lung cancer [26]. Our results support this, showing a significantly higher proportion of adenocarcinoma cases compared to non-adenocarcinoma types. Moreover, most malignant nodules in our cohort demonstrated low to moderate differentiation (Table 4). The study posited that a diagnostic model, constructed from imaging and pathological data, could assess the risk of non-malignant lung nodules and provide insights into the pathological subtype and infiltration grade of lung cancer [27]. In our study, GGO was present in 92 cases (64%), and it was more frequently observed in nodules with low to moderate differentiation. This association was statistically significant in multivariate analysis, suggesting that GGO is correlated with histological differentiation and thus has prognostic value in cystic LCA. Wang et al. [28] analysed 123 patients with LCA, finding that certain imaging features (cystic wall components, intracystic surface irregularities) were independent risk factors for moderately/poorly differentiated (M/P) subtypes; the mural nodular type of cystic lung cancer exhibited the highest degree of malignancy. They noted that mural nodules indicated the highest degree of malignancy. However, although we observed a high proportion of invasive adenocarcinoma in our cohort, the statistical significance of mural nodules and wall smoothness was not established, probably due to the limited number of such cases. Similarly, the number and proportion of cystic cavities were predominantly single-lumen, and not significantly associated with invasive grade (p = 0.516), consistent with the conclusions of Wang et al. [28].
Several guidelines and consensus suggest that clinicians use probabilistic prediction models of malignancy to inform the clinical identification of malignant tumours and invasive lesions [29]. Several predictive models have been devised, but the known VA model has lost clinical relevance because it is based on X-ray data; the prospective Mayo model was described 20 years ago [30]. In this paper, we collected baseline information on cystic lung nodule disease and further analysed the possible relationship between the clinical data and the disease, to promote deeper research in the field of pulmonary cystic nodules, particularly cystic lung cancer. The results of this study were commensurate with the consistency of current clinical guidelines recommending high-risk factors for the malignant evolution of lung nodules, and predictive modelling is informative. Furthermore, our study integ-rated clinical features and tumour-related serological indicators, imaging, and pathological tissue features, not only analysing high-risk imaging factors and manifestations of malignant cystic lesions in the lungs but also attempting to obtain factors associated with the prognosis of malignant lesions: for example, we clarified the value of the milled-glass sign for clinical application in predicting the prognosis of malignant cystic lesions. Due to the limited sample size of cystic lung cancer included, this study only preliminarily correlated it with disease imaging features and malignant infiltration degree; in the future, we can increase the external validation of the model or construct a deep learning model with a superior fitting effect and expand the sample size of patients and other variables for further optimisation.