Introduction
Lung cancer is the second most common type of cancer diagnosed, and non-small cell lung cancer (NSCLC) is the most common type, representing about 85% of cases [1]. Brain metastases develop in up to 90% of all cases of lung cancer and are associated with a shorter survival time and a poor prognosis [2-4]. Survival and prognosis are worse in cases with brain metastases. Prior to treatment in lung cancer, molecular testing for the epidermal growth factor receptor (EGFR), v-Raf murin sarcoma viral oncogene homologue B (BRAF), anaplastic lymphoma kinase (ALK), and ROS oncogene 1 (ROS1) genes are commonly used, and treatment options are based on the mutation status detected in the cancer. The treatment options for cases of non-small cell lung cancer have recently been expanded, and molecularly targeted therapies have been added to the protocol. Pharmacological agents that may enter the central nervous system in NSCLC patients have been reported to have a positive effect on survival in the treatment of brain metastases. Therefore, the availability of molecular information is essential for the planning of treatment and the prediction of survival [5].
However, invasive biopsy or surgical resection of metastases for molecular diagnosis is not practical because brain metastases are usually small and widely distributed. Consequently, most metastatic brain lesions are detected by magnetic resonance imaging (MRI) without histopathological confirmation. Thus, non-invasive imaging modalities are currently the preferred approach to evaluate the mutational status of lung cancer brain metastasis [6,7].
Radiomic analysis can be used to comprehensively study spatially and temporally heterogeneous tumours through the extraction of a large number of points from radiological images [8]. Conventional radiologic imaging evaluates brain lesions for size, location, signal characteristics, and peritumoral area. However, the human eye may fail to discriminate features related to tumour texture, shape, and image intensity in radiological analysis [9,10]. Since microstructural features of tumour tissue can be determined by radiomic analysis, it is a potentially useful tool for the identification of genetic mutations and personalised treatment protocols.
The focus of radiomics may be to obtain high-dimensional features in order to capture all of the features of the image under investigation [11]. In radiomics, first-order methods typically rely on histogram analysis based on analysis of individual voxels [12,13]. Second-order methods are typically based on texture analysis and reveal statistical relationships between voxels as a function of contrast values [14,15]. Higher-order methods can extract repetitive or non-repetitive patterns using various filters [16,17]. Examples of higher-order methods include Gaussian bandpass filtering and Minkowski filtering [18,19].
In our study, we hypothesise that radiomics of tumour segmentation on post-contrast T1-weighted (W) imaging in lung cancer patients with brain metastases can be used to predict EGFR, BRAF, ALK, and ROS1 mutation status on contrast-enhanced brain MRI. Therefore, decision tree machine learning models were developed to determine mutation status. The models were optimised considering the imbalanced dataset problem and evaluated using 5-fold cross-validation with the layered convolutional method.
Material and methods
Study design
A retrospective study was performed on lung cancer cases with brain metastasis in our hospital between January 2014 and April 2024. The study was approved by the institutional review board. The data of the study population were collected in a retrospective manner from the hospital information system. Histopathologic data were extracted from pathology reports after tissue biopsy, noting tumour subtype and EGFR, BRAF, ALK, and ROS1 mutation status. The presence of brain metastases was confirmed on post-contrast T1A series obtained after using gadolinium-based contrast. Patients were excluded from the study for the following reasons: (1) previous neurosurgery (n = 25), (2) previous brain radiotherapy (n = 21), (3) presence of another primary tumour (n = 7), (4) poor image quality (n = 5), (4) EGF, BRAF, ALK, and ROS1 mutation status not checked (n = 42), (5) failure to select detectable brain metastases (n = 3), and (6) cases without contrast-enhanced brain MRI (n = 3). In addition, due to the difficulty of assessment, metastases with a largest diameter of less than 5 mm were not included in the study. After all exclusions, 84 patients were included in the study. For cases with multiple metastases, the largest single metastasis was included in the study. Informed consent was waived due to the retrospective nature of the study. All data were made completely anonymous by masking personal information.
Pathological mutation analysis
The specimens were fixed in 10% formalin and cut into 5 to 10 mm thick sections. To evaluate tumour morphology and expression of IHC markers, haematoxylin and eosin (H&E) slides and IHC were examined by a thoracic pathologist. All cases were staged in accordance with the American Joint Committee on Cancer (AJCC) 8th edition.
The AmoxyDx EGFR 29 Mutation Detection Kit is a real-time PCR assay for the qualitative detection of 29 somatic mutations in exons 18, 19, 20, and 21 of the EGFR gene in human genomic DNA extracted from formalin-fixed paraffin-embedded tumour tissue, and it was used for mutation analysis.
The AmoyDx BRAF Mutation Detection Kit is a realtime PCR test for the qualitative detection of V600E, V600E2, V600K, V600D, V600D2, V600A, and V600R mutations in the BRAF gene, and it was used for mutation analysis.
It is designed for the qualitative detection of translocations involving the ALK and ROS1 genes by fluorescence in situ hybridisation (FISH). Fluorescently labelled DNA fragments and complementary target DNA strands are denatured together and then allowed to bind to each other during the hybridisation process. This method has been used to investigate the presence of mutations.
Imaging process
A total of N = 84 patients were included in the study. A flow chart summarising the criteria for the study is shown in Figure 1. The radiomic parameters from patient images and segmentation files in .nrrd format were extracted with PyRadiomics (version 3.1.0, with Python 3.11.7) [20]. The textural features, including Gray Level Co-occurrence Matrix (GLCM, 24 features), Gray Level Run Length Matrix (GLRLM, 16 features), Gray Level Size Zone Matrix (GLSZM, 16 features), and Neighboring Gray Tone Difference Matrix (NGTDM, 5 features), with a total of n = 107 original radiomics parameters and n = 13 diagnostic parameters, were extracted. Data were recorded in .csv format, edited in Microsoft Excel software, and imported to Stata 15.1 software (StataCorp 4905 Lakeway Drive, College Station, Texas 77845 USA). The patient database and radiomics databases were combined by using Stata 15.1 via established key variables. All data visualisations, including biplots, ROC curves, and heat maps, were performed with Stata 15.1. Heat maps (including histograms and correlation matrices) were created with the heatplot module [21]. The scheme for visualising metastasis in postcontrast T1W sequences on MRI, segmentation, extraction radiomics features, and making predictions is shown in Figure 2.
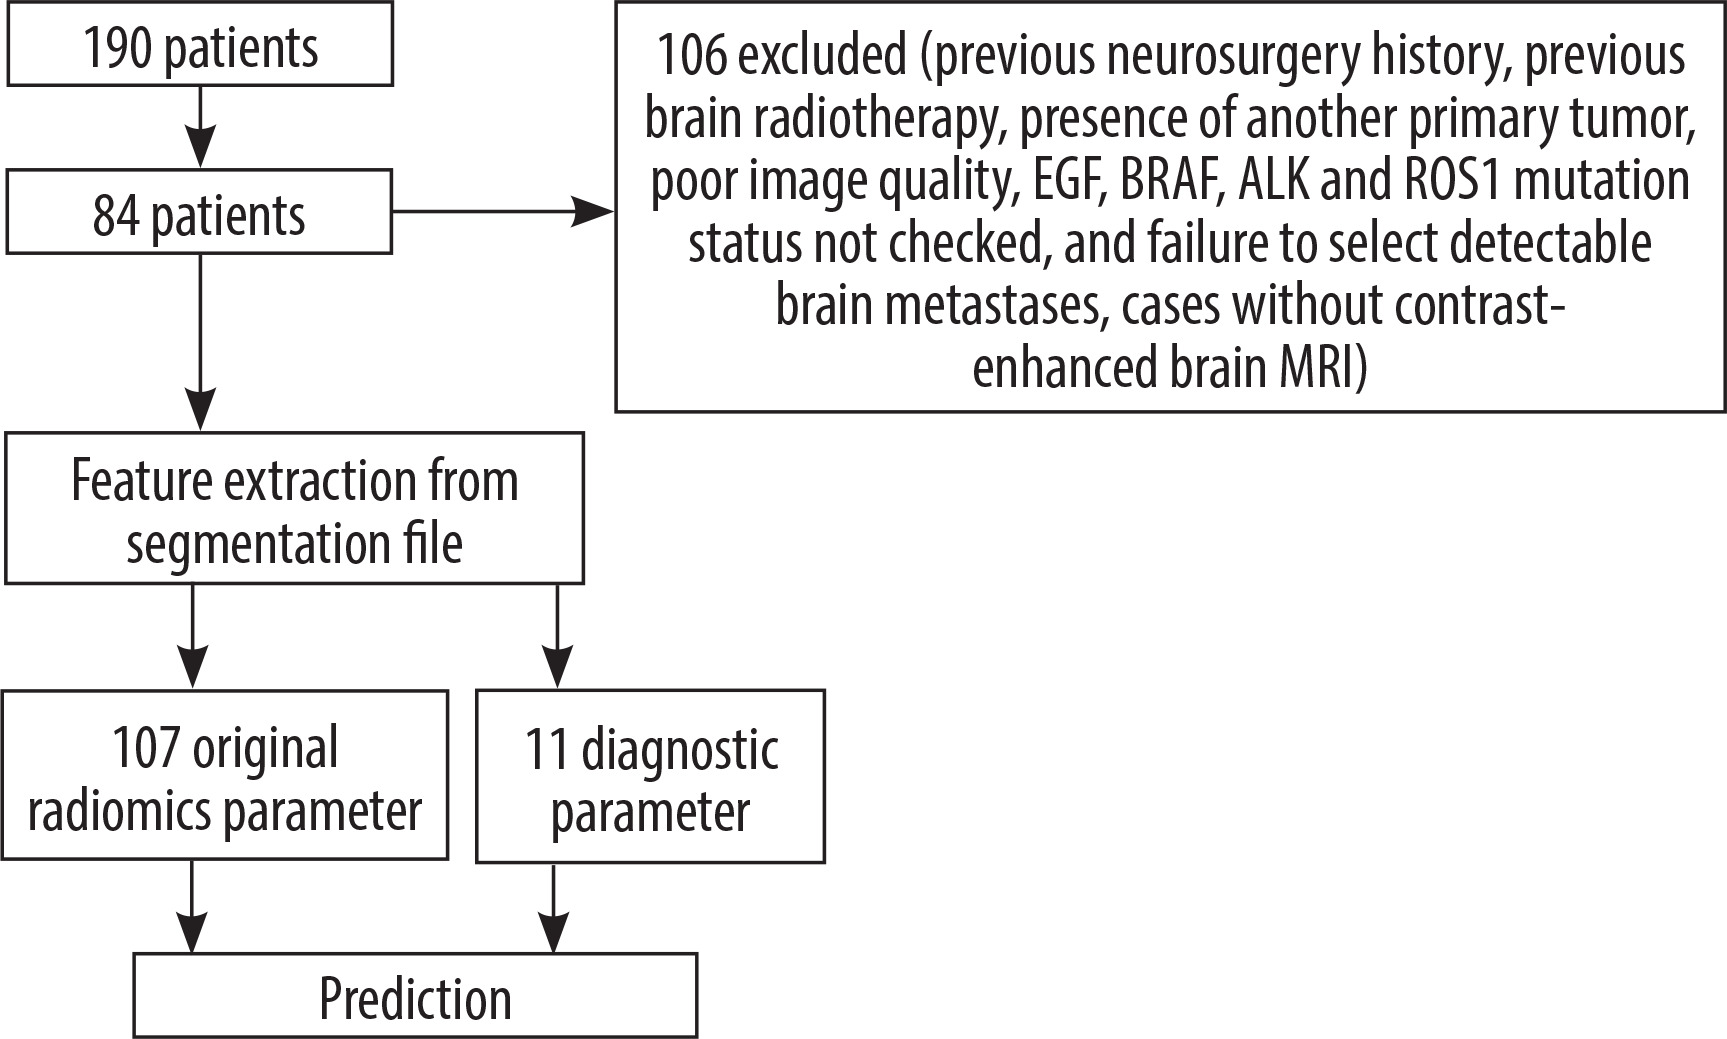
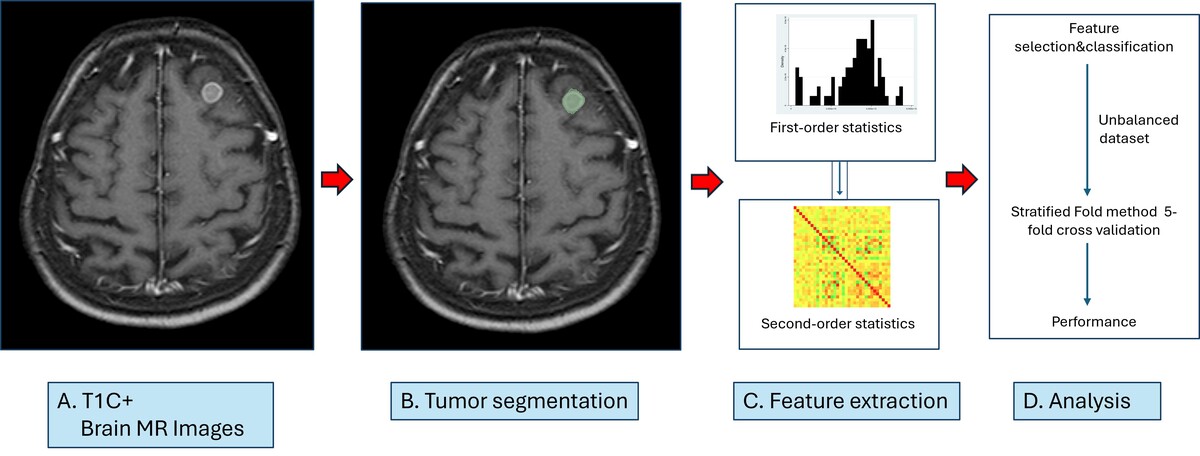
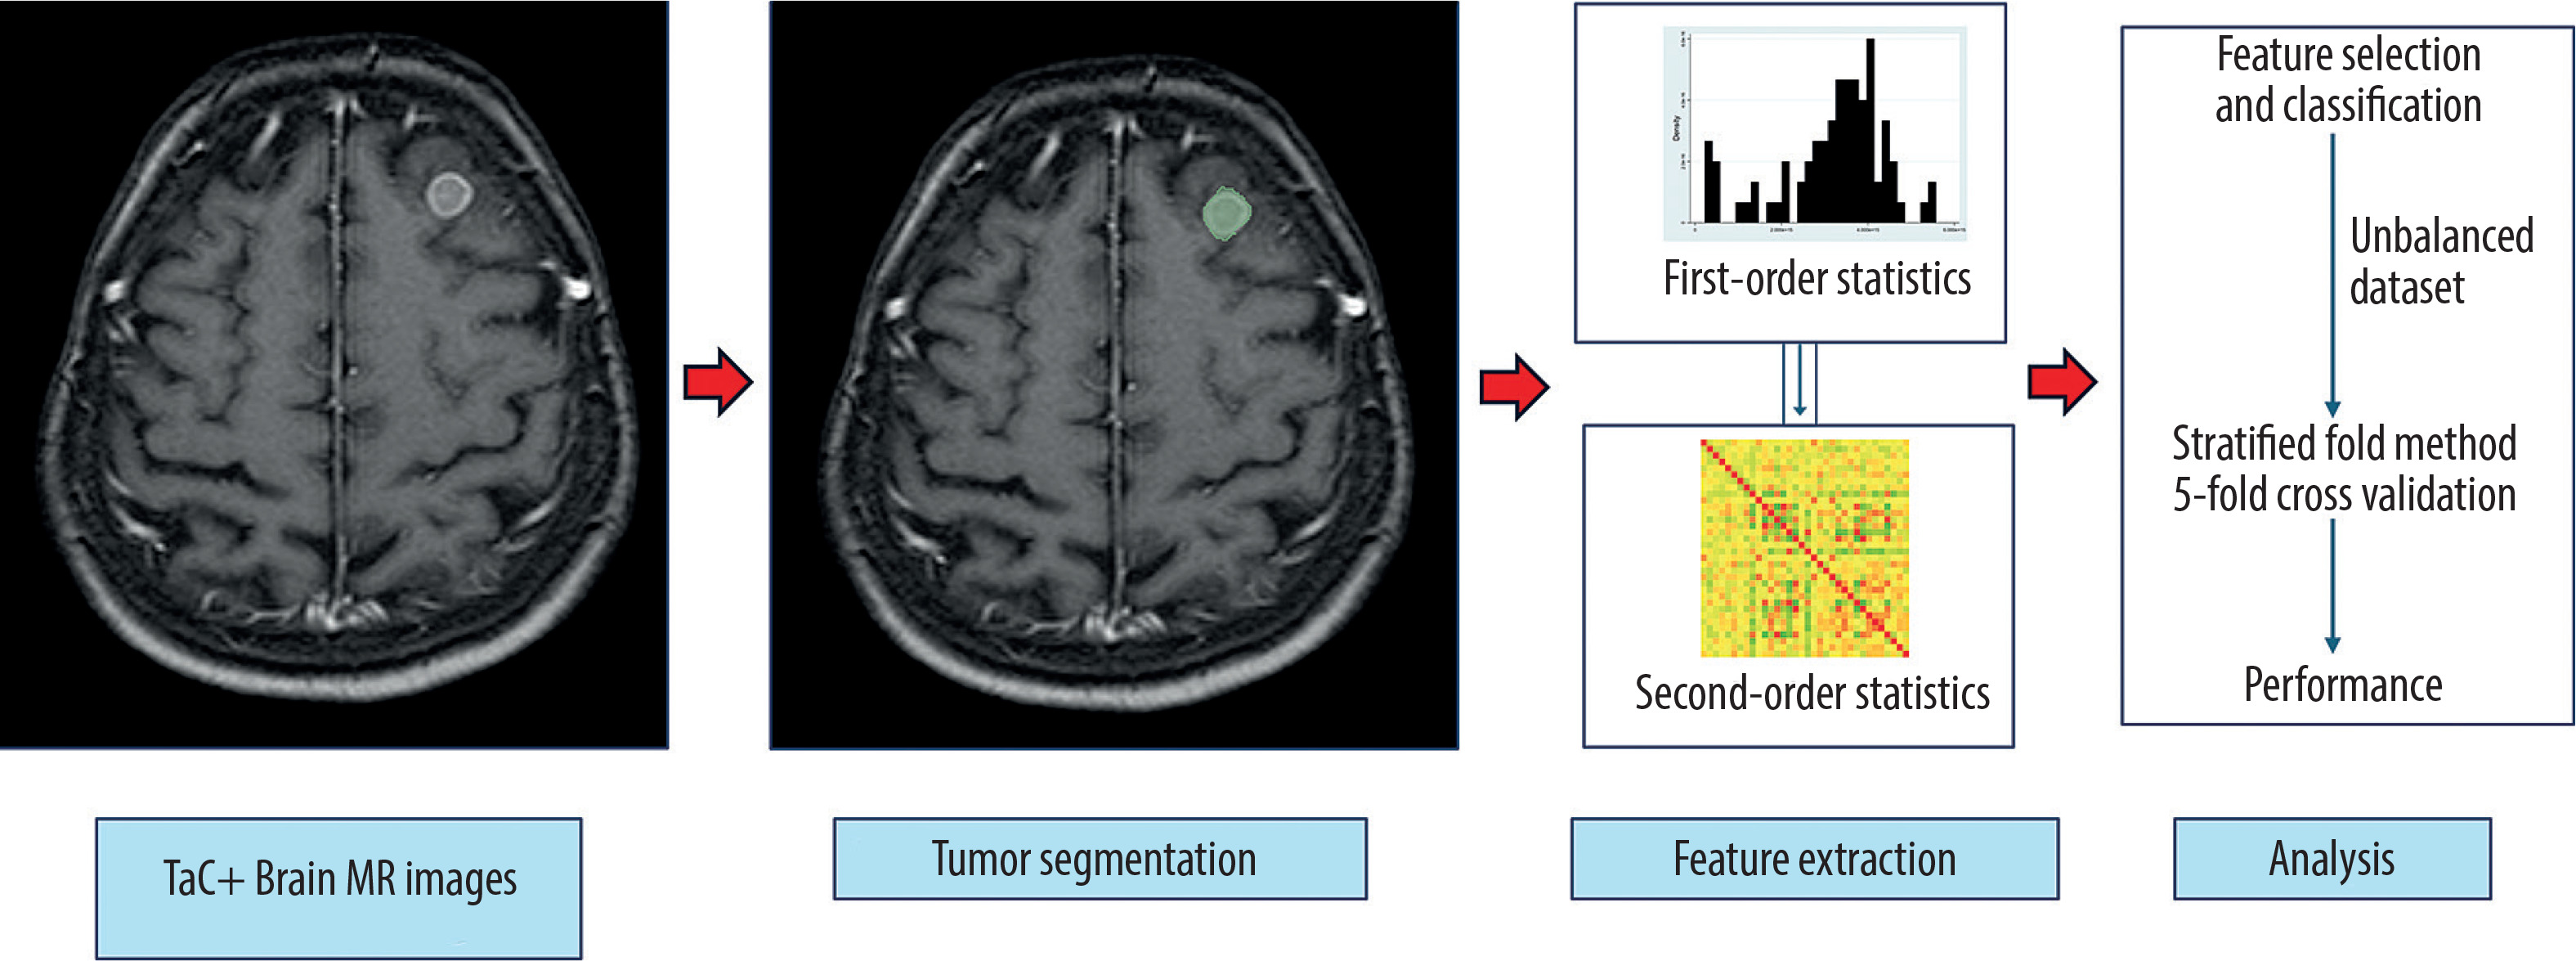
Figure 2
Schema for brain tumour segmentation and radiomic feature extraction. A) Contrast-enhanced T1W sequence to determine metastasis localisation. B) Segmented enhancing tumour on contrast-enhanced T1W sequence. C) Radiomic feature extraction with first- and second-order statistics. D) Analysis
In this study, decision tree-based machine learning models were developed to detect EGFR, ALK, and ROS mutations. The models were optimised by considering the unbalanced dataset and evaluated by using Stratified Fold method 5-fold cross validation [22]. For the preprocessing step, the missing data were imputated with appropriate methods, where the observations with missing target feature were dropped. Diagnostic features, including size and spacing features of image and mask, bounding box, centre of mass and centre of index features of mask, were used intensively in the data preprocessing step. In the feature engineering step, physical dimensions and volume were calculated using size and spacing diagnostic features of the original image. Centre of mass and distribution features were calculated using centre of mass and centre of mass index of mask. The features were normalised to improve model performance. For each model, true positive, true negative, false positive, and false negative observations were classified with confusion matrices. Accuracy, precision, recall, and F1-score were reported for each model. The dataset included diagnostic and original features, in addition of engineered features. According to the feature selection step, features with highest importance were Gray Level Co-occurrence Matrix Joint Average (0.125), Maximum 2D diameter (Slice) (0.075), Surface Area (0.067), Neighboring Gray Tone Difference Matrix Complexity (0.050), and Gray Level Co-occurrence Matrix Cluster Prominence (0.045) (Table 1). For the unbalanced dataset problem, the hyperparameters of maximum depth = 4, minimum samples split = 2, minimum samples leaf = 6, and balanced class weight were used [23]. The stratified fold method was used to stratify the dataset by keeping class unbalance for each stratum. This method was employed to evaluate the model performance in unbalanced datasets correctly.
Table 1
Selected features are shown
Statistical analysis
The normal distribution of variables was tested with histogram, normal quantile graph, Kolmogorov-Smirnov, and skewness kurtosis tests. The variables with normal distribution were presented with mean ± standard deviation, and the variables without normal distribution were presented with median and IQR values, in addition to minimum and maximum values. Categorical variables were presented as counts and percentages. The distribution of variables without normal distribution among independent groups were tested with Mann-Whitney U test. For the discriminatory analysis, radiomic variables showing significant difference were selected. Kth nearest neighbour method was used for discriminant analysis, where different k-values were used iteratively to minimise the error rate. Leave-one-out tables were used for cross validation in discriminant analysis. Sensitivity, specificity, and positive and negative predictive values were calculated for each model and presented with 95% confidence intervals. A p-value less than 0.05 was considered statistically significant.
Results
The mean age of the patients was 67.61 ± 9.74 years, and most of the patients were male (n = 70, 83.33%). The diagnosis of most of the patients was lung adenocarcinoma (n = 77, 91.67%); however, 2 cases were diagnosed as lung squamous cell carcinoma, 1 case was large cell neuroendocrine carcinoma, and 1 case was diagnosed as cystic mesothelioma. Additionally, 3 cases were diagnosed with NSCLC that could not be subtyped [24]. Other demographical and clinical characteristics of the patients are shown in Table 2.
Table 2
Demographic and clinical characteristics of the patients
The confusion matrices for each model are presented in Table 3. The model for EGFR had 32 true negative and 2 true positive observations out of 34 patients, where no patients were classified as false negative or false positive. Similarly, the model for ALK classified 28 patients as true negative, and one patient as true positive without any false negative or false positive classifications. The model for ROS1 correctly classified all true negative patients (n = 28), but one patient was misclassified as false positive.
Table 3
Metrics for model performance (5-fold cross validation)
| Model | Accuracy (%) | Precision (%) | Recall (%) | F1-score (%) | Test counts |
|---|---|---|---|---|---|
| EGFR (DT-HPT) | 93.82 | 97.85 | 93.82 | 95.10 | 0 : 15, 1 : 1 |
| ALK (DT-HPT) | 84.76 | 93.58 | 84.76 | 88.48 | 0 : 13, 1 : 1 |
| ROS1(DT-HPT) | 79.33 | 94.20 | 79.33 | 85.91 | 0 : 13, 1 : 1 |
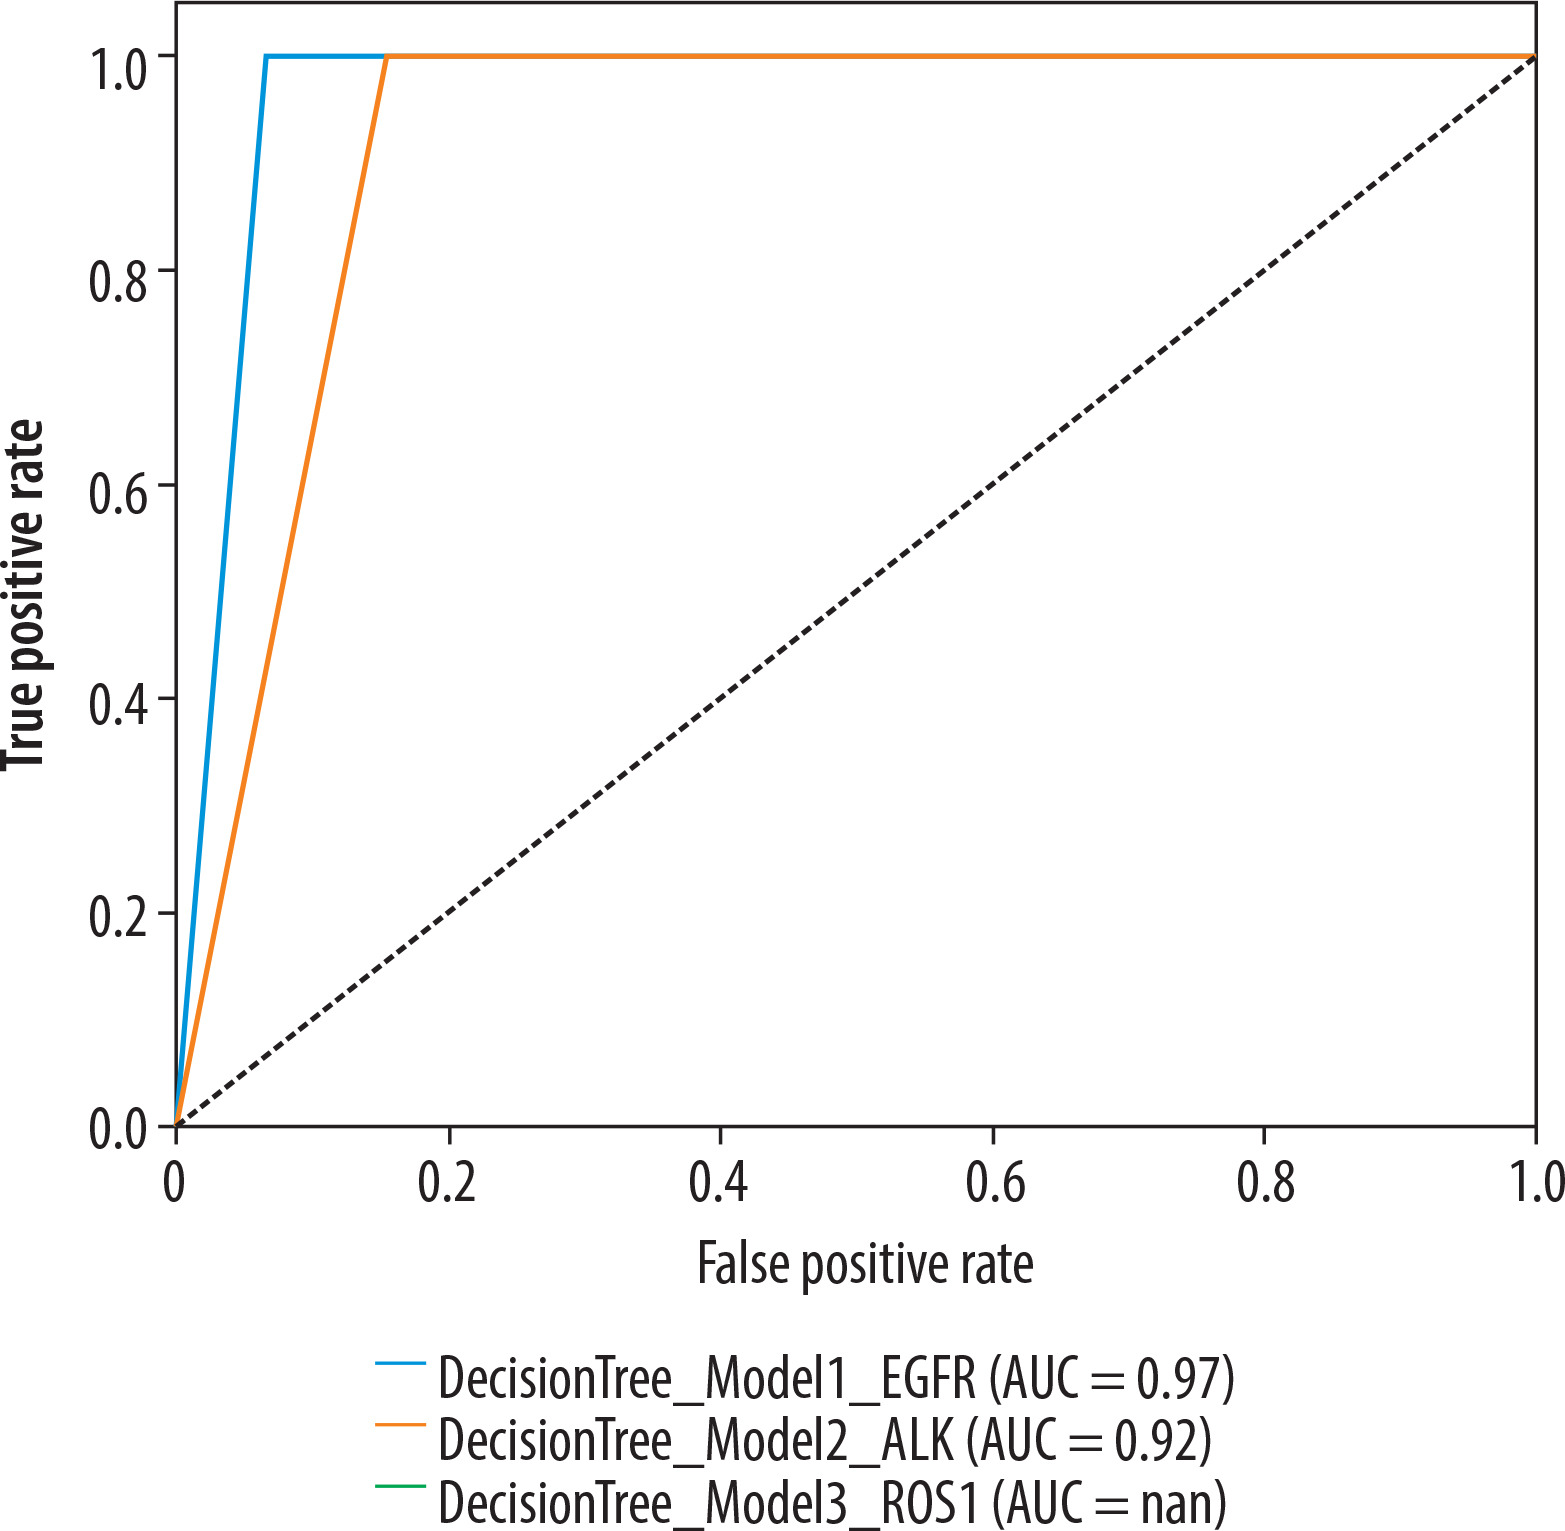
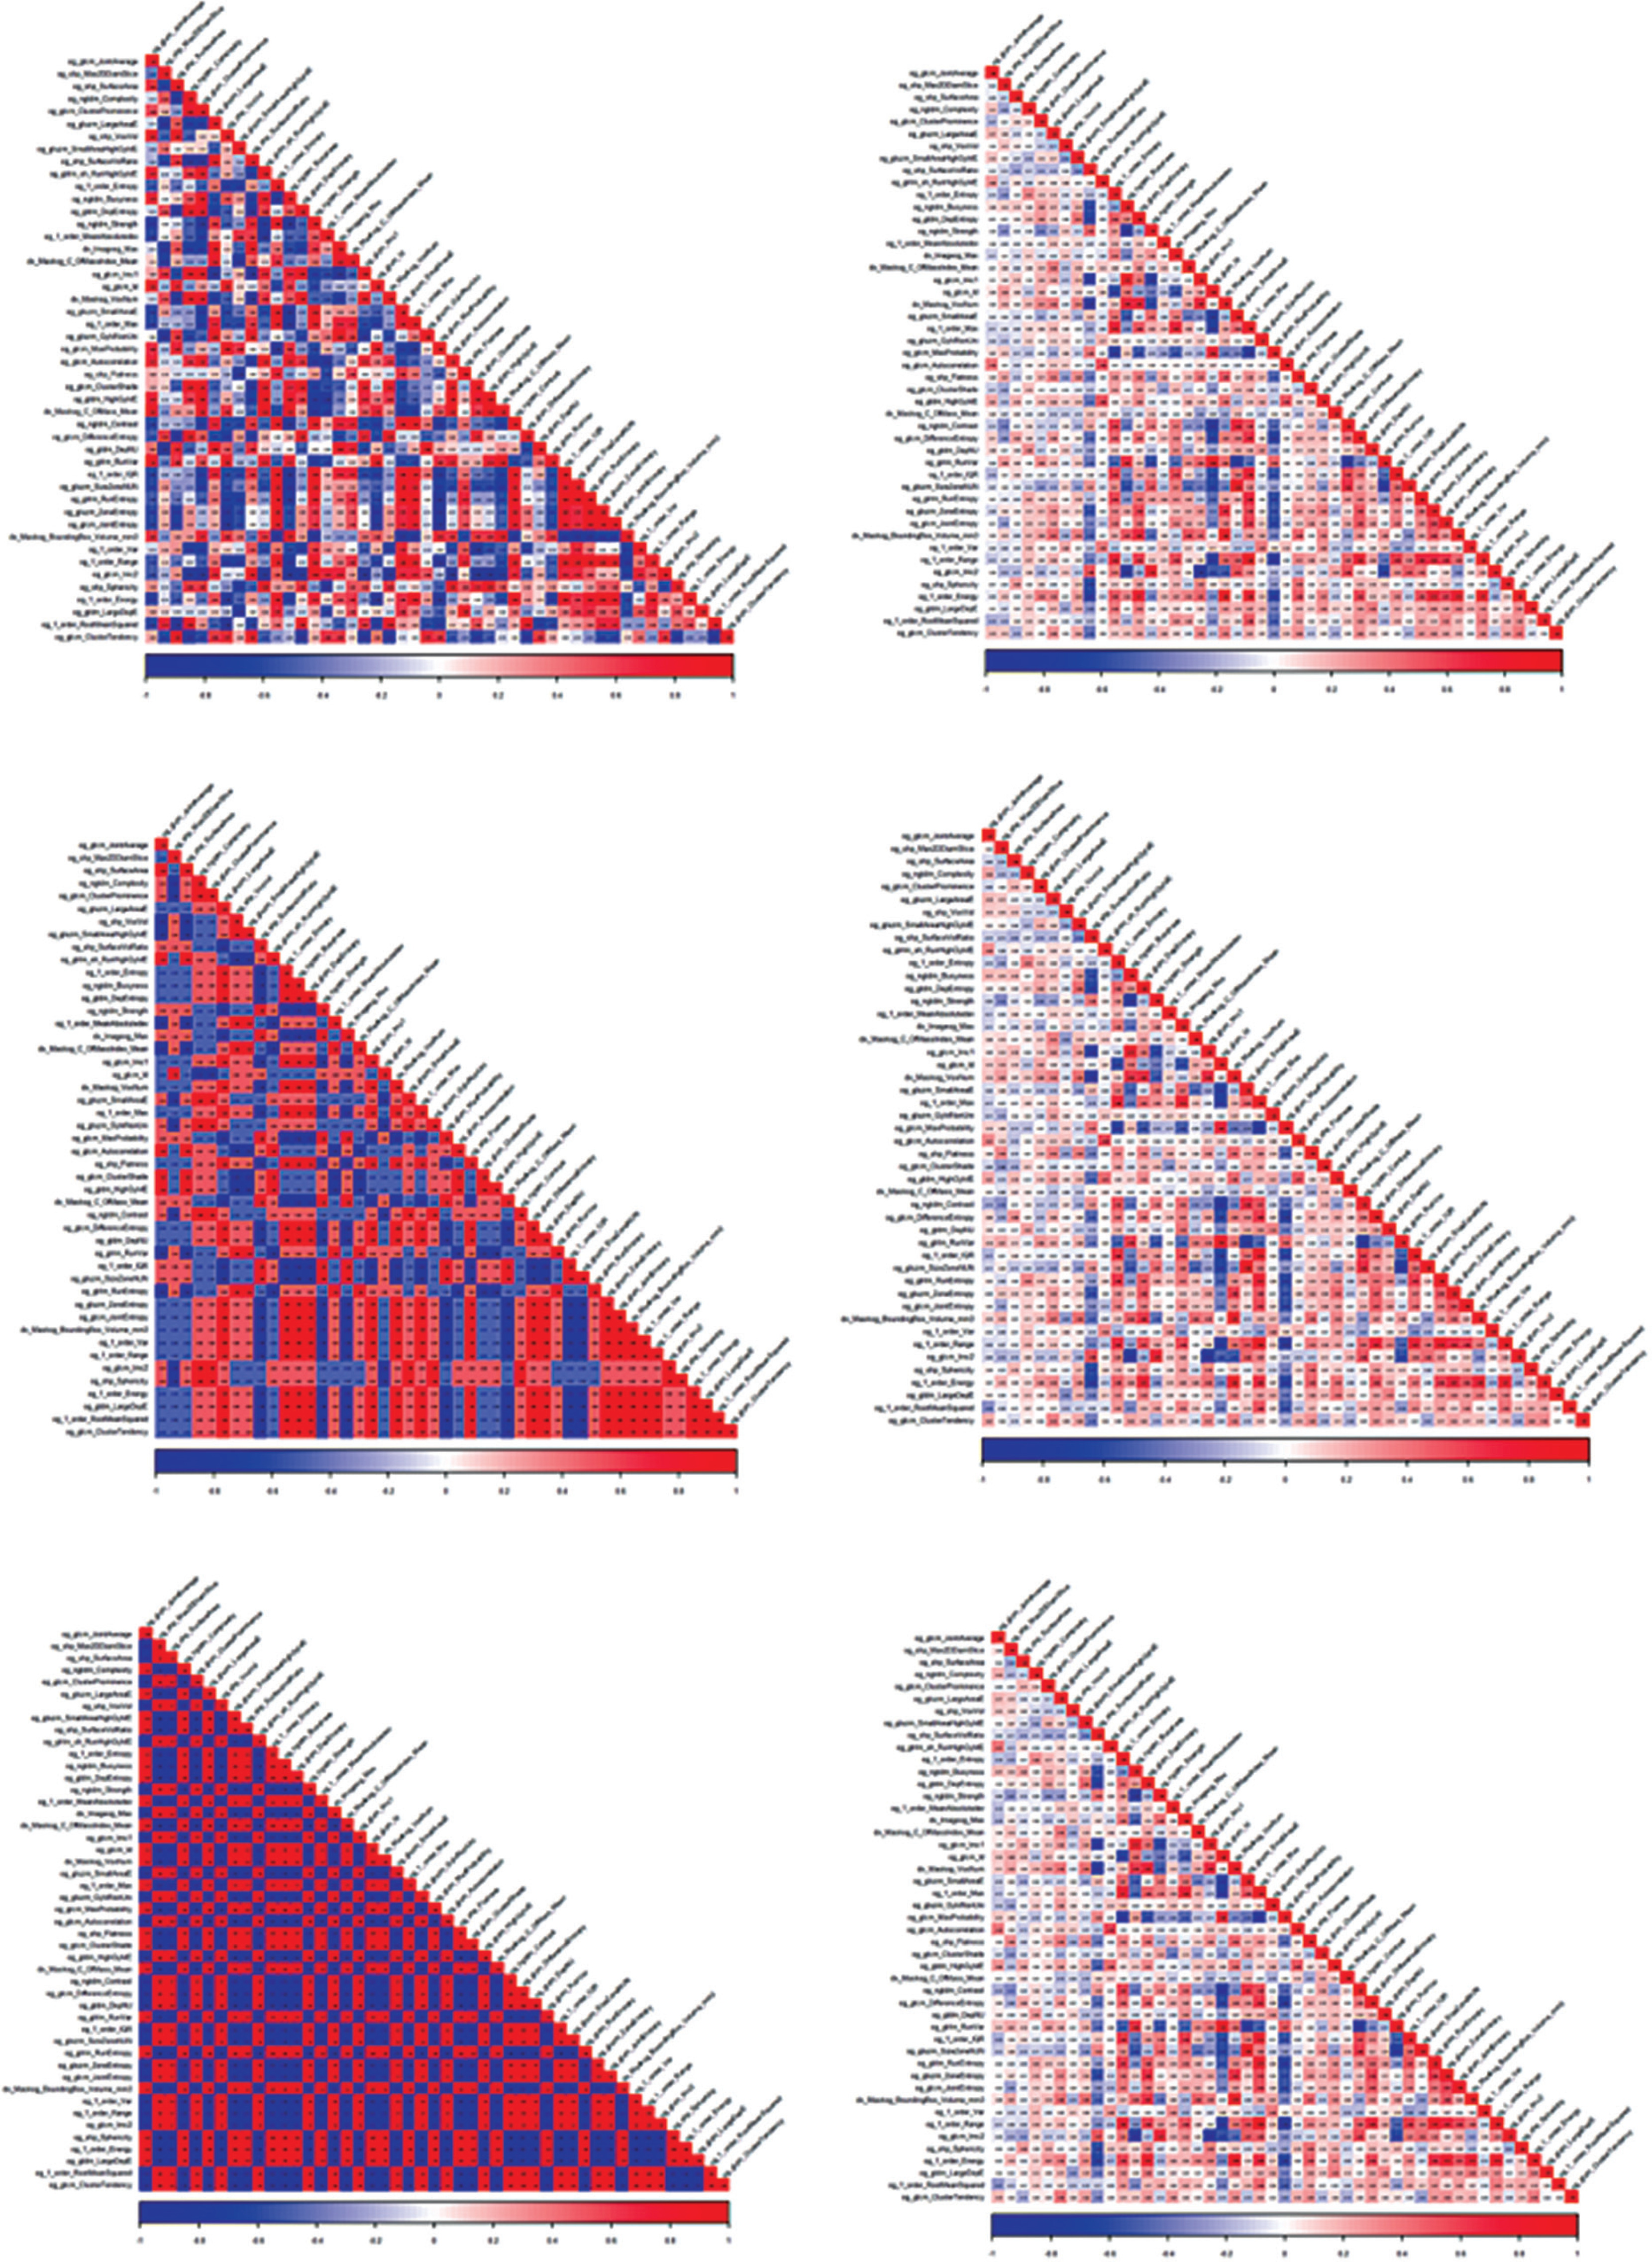
The performance metrics of 3 models predicting EGFR, ALK, and ROS1 mutations is presented in Table 4. The decision tree model for EGFR has the highest diagnostic performance, including an accuracy of 93.82%, precision of 97.85%, recall of 93.82%, and F-1 score of 95.10%. While the model classified all 14 true negative patients correctly, only one patient has been classified as true positive out of 2 positive patients. The model for ALK has an accuracy of 84.76%, precision of 93.58%, recall of 84.76%, and F-1 score of 88.48%. Similarly to the EGFR model, the ALK model classified all negative patients (n = 11) correctly; however, 2 patients out of 3 positives were classified as false negative. Finally, the ROS1 model had accuracy of 79.33%, precision of 94.20%, recall of 79.33%, and F-1 score of 85.91%. Similarly to the previous models, the model predicted true negative patients (n = 12) perfectly, but the model could not detect true positive patients and misclassified them as negative (n = 2 false negative). Receiver operating characteristic (ROC) curves for classifying EGFR, ALK, and ROS1 mutation status are shown in Figure 3. Heatmaps of the EGFR, ALK, and ROS1 mutation status of the cases are shown in Figure 4.
Discussion
This study shows that radiomics analysis can be used to predict the tumour subtype and EGFR, ALK, and ROS1 mutation status in NSCLC cases with brain metastases. Although the EGFR model has the highest diagnostic performance among the models, all 3 models have high precision values, ranging from 93.58% to 97.85%, which reflects the low rate of false positive cases. The stratified fold method enabled us to evaluate the model performance by keeping the class unbalance [22]. Evidence shows that decision tree models are effective in unbalanced datasets with hyperparameter optimisation.
Radiomics is a computational method for the transformation of tumour images into a large number of quantitative features. Here, we developed machine learning models to classify the molecular mutation status of EGFR (more commonly reported) and ALK and ROS1 (less commonly reported) in lung cancer. Thus, we have demonstrated that MRI and radiomics analysis of brain metastases can be an alternative, non-invasive method for the classification of EGFR, ALK, and ROS1 mutations in lung cancer patients.
There is no study in the literature on the analysis of ROS1 mutations using artificial intelligence algorithms based on the radiological features of the tumour in cases of primary lung cancer. In this regard, our study can be considered as the first study to investigate the less common mutations such as ROS1. Mayer et al.’s study [25], conducted on pathological diagnosis prediction of ALK and ROS1 mutations using deep learning algorithms, reported specificities of 100% and 98.48%, respectively. In the study of Chen et al. [26], which used imaging-based radiomics and machine learning (ML) in the field of radiology, it focused on EGFR, ALK, and KRAS mutations in brain metastatic NSCLC. The specificities for EGFR, ALK, and KRAS mutations were 90.6%, 88.7%, and 97.7%, respectively [26]. Another study by Haim et al. [27] used deep learning (DL) to predict EGFR mutant status in NSCLC brain metastasis with a specificity of 97.7%.
Studies on the determination of primary lung cancer subtypes by non-invasive techniques based on radiomic features of tumour tissue have been reported in the literature [28,29]. Previously, Li et al. [30] used quantitative radiomic features from MR images of brain metastases to predict pathologic subtypes of primary lung cancers, reporting a 97.8% specificity for differentiating small-cell and non-small-cell lung cancers in their back-propagation artificial neural network (BP-ANN) model. The literature also reported the prediction of primary cancers based on radiomic analysis of brain metastases. Discrimination of primary tumour diagnoses such as lung cancer-breast cancer, lung cancer-melanoma have been reported with successful results [31,32].
Identification of common oncogenic mutations has implications for prognostic and therapeutic strategies in cancer treatment. Moreover, lung cancer patients have been reported to be more prone to brain metastasis with EGFR mutations and ALK translocations [33]. Therefore, pre-treatment mutation detection is helpful in predicting metastatic potential and prognosis. Tyrosine kinase inhibitors and ALK inhibitors, which target mutations during the treatment process, are known to positively affect overall survival in patients with EGFR and ALK alterations, respectively [7]. Another molecular subset is represented by the newly identified ROS1 mutation in lung adenocarcinoma, which has almost no overlap with the known driver mutations [34,35]. The MET/ALK/ROS1 inhibitor crizotinib has reportedly shown impressive clinical activity in patients with advanced ROS1-positive lung cancer [36]. In light of the above, the assessment of the metastatic status of the primary tumours using radiomics has become one of the most important steps in patient management and treatment. Radiomics plays a key role in this process by providing information through extraction and processing of visual features that are not discriminable by human eye [37,38].
Recently, an increasing number of studies have been performed to determine the mutation status in the primary tumour using radiomics [39-41]. Some of these studies used image features of the primary tumour in chest computed tomography and considered AUC values to estimate mutation status. Most of the studies in this field have used radiomic features extracted from chest CT images, and the highest AUC value reported among them was 0.89 in the study by Gevaert et al. [42]. More meaningful results can be obtained by estimating the radiomic features of the primary tumour and metastasis using the multimodality approach. Moreover, new results may be obtained by evaluating radiologic and pathologic features together, using different artificial intelligence algorithms [39,42].
The geratest limitation of this study is the limited number of positive observations for each mutation. Since the number of mutation-positive patients for EGFR, ALK, and ROS1 genes was 5 or less, the positive predictive values of the discriminatory models were very low. Because the cases included in the study did not have BRAF mutation, it was not possible to perform radiomics for this mutation. Furthermore, the number of patients was limited with listwise deletion in case of missing target variable, 12 patients for ALK and 12 patients for ROS1 mutation. It is clear that further studies with larger case groups are needed to predict mutations associated with brain metastases in NSCLC with the help of radiomics.
In our study, the mutation analysis was performed on a sample taken from the primary tissue of lung cancer, and there is no histopathologic definition of brain metastasis. Recent studies have reported no overlap in EGFR mutation status between primary and metastatic tissues [43,44]. According to a meta-analysis, the EGFR incompatibility rate between central nervous system metastasis and primary tumour is 17.26% [45]. This situation is based on the different genetic profiles of cancer cells in the literature [46]. In daily practice, the second interventional procedure for tissue diagnosis of brain metastasis in cancer cases with primary tissue diagnosis may increase the morbidity and workload in the case. Therefore, we believe our study provides results that will influence routine clinical outcomes and facilitate treatment.
This study demonstrates the potential of machine learning models in predicting genetic mutations using radiomic features. In particular, the prediction of EGFR mutations was highly successful. Future studies aim to further improve the performance by expanding the dataset and using deep learning methods.