Introduction
For all cancers combined, the 5-year survival rate for children aged 0 to 14 in Europe was 81% from 2010 to 2014 [1]. This represents a three percentage point increase compared to results from a decade earlier. This improvement is partly due to enhanced awareness and better management of complications.
Haemochromatosis can result from 2 main mechanisms: 1) increased intestinal absorption and 2) multiple blood transfusions. Due to chemotherapy and the need for frequent blood transfusions, patients in this group are at an increased risk of developing secondary iron overload. Despite evidence of secondary haemochromatosis in paediatric oncology, its characteristics – such as order of occurrence in individual organs, severity, and correlation with chemotherapy types – are not yet fully understood [1,2].
The development of magnetic resonance imaging (MRI) over the past 5 decades has provided valid, noninvasive methods for assessing iron overload in various organs. The pattern of organ involvement in haemochromatosis varies depending on the mechanism of overload. This article examines the differences in iron accumulation in the liver, spleen, and pancreas and discusses the potential clinical implications.
MRI techniques used for iron overload assessment are mainly based on signal intensity ratio (SIR) and T2 or T2* relaxometry.
SIR method
The technique developed by Gandon involves calculating the liver-to-muscle ratio using 5 axial GRE sequences of the liver with a repetition time of 120 ms and echo times (TEs) of 4, 14, and 19 ms. Alstuzia suggests using only 2 TEs (4 and 14 ms) and a different mathematical formula to calculate liver iron concentration (LIC). This model shows a better correlation with R2* and LIC as assessed by biopsy.
Several studies of European cohorts have demonstrated a high correlation between liver-to-muscle SIRs with biopsy-determined LIC, indicating a consistent relationship between liver-to-muscle ratios and LIC [3-5].
The use of relatively long TEs limits the dynamic range of SIR methods, making them less effective at higher iron concentrations. Most studies have been conducted at 1.5T, with a dynamic range of valid LIC quantification limited to approximately 350 μmol/g (19.5 mg/g) [3]. This SIR technique often overestimates mild and moderate levels of overload.
An equivalent method tested at 3T [6] shows limited data on its performance. “In-phase” TEs aim to minimise the confounding effects of fat, but these effects are not entirely eliminated when fat is present in the liver or muscle [7], due to fat’s multiple spectral peaks.
Relaxometry
Iron deposits lead to a decrease in T2 relaxation times. The decay in signal intensity from the liver due to iron allows for the assessment of haemochromatosis. Relaxo-metry techniques determine T2 or T2* by fitting decay models to the average signal intensity.
Calibration curves show similarities within each field strength, with minor variations due to differences in acquisition parameters, analysis methods, and assays for reference LIC [8]. Liver R2* relaxometry has been validated against biopsy-determined LIC or R2-based LIC as the gold standard by independent researchers using various 1.5T platforms [8-11], including direct comparisons between 1.5T and 3T [12-14].
Gradient-echo acquisitions with multiple TEs in a single repetition time enable rapid R2* mapping of the entire liver, often achievable in a single breath hold. Accurate R2* quantification relies on the selection of TEs, particularly when addressing high LIC or liver fat. It is generally recommended to use 6-12 echoes to balance effective R2* decay sampling with increased repetition and acquisition times.
Recent advancements have led to methods for simultaneous fat-water separation and R2* mapping [15-17], enabling accurate R2* relaxometry even with adipose tissue infiltration. Fat correction is crucial for precise R2* measurement in cases of mild-to-moderate iron overload but becomes less critical and eventually impractical in severe iron overload [12,18]. These fat-corrected R2* methods are widely available at 1.5T and 3T from major MR vendors and are regulatory approved for liver R2* mapping.
Overall, liver R2* exhibits a strong, well-validated linear correlation with LIC at both 1.5T and 3T [9,10,18]. While the dynamic range and performance of R2* relaxometry may vary slightly based on fitting algorithms and acquisition parameters, R2* measurements are reproducible across various published methods [11,12,15,18].
Methodology
A literature review (using PubMed) was conducted for publications up until 13 June 2024, using the following keywords: “iron overload”, “MRI”, “liver”, “hemochromatosis”, “secondary iron overload”, “pancreas”, “spleen”, “pediatric oncology”, “childhood cancer survivors”, “pancreatic fat”, and “pancreatic iron overload”. The authors also manually reviewed bibliographies for any additional relevant materials.
Between 1995 and 2024, 605 publications explored various aspects of systemic iron overload, including clinical trials, meta-analyses, and randomised controlled trials.
Special attention was given to studies describing the characteristics of changes in the main parenchymal organs like the liver.
Results
Among 605 publications, 230 (43%) focused on paediatric patients, with the majority (147 publications) concentrating on patients with beta-thalassemia [19,20]. Only 2 studies examined the long-term effects of secondary haemochromatosis among childhood cancer survivors [21,22]. Most studies in paediatric oncology were based on data from single centres [1,2,23]. There have been no significant studies specifically investigating the effects of chemotherapy on iron metabolism in children.
Liver
The liver stores most of the body’s iron, making it an ideal organ for monitoring iron burden. Traditionally, liver biopsy has been used to assess LIC. LIC has a strong correlation with total body iron levels, making it a reliable indicator of overall body iron overload.
However, liver biopsy is invasive, costly, prone to sampling errors, and has low reproducibility. MRI is now more commonly used due to its noninvasive nature and sensitivity.
Hepatic iron overload can present in various forms, including diffuse, heterogeneous, segmental, focal hypersiderosis, intralesional siderosis, and periportal siderosis [4,24]. Understanding these forms is crucial for accurately diagnosing atypical lesions in haemosiderosis [4]. Several patterns of hepatic iron overload and associated conditions are presented in Table 1.
Table 1
Patterns of hepatic iron overload with associated conditions [based on İdilman İS, Akata D, Özmen MN, Karçaaltıncaba M. Different forms of iron accumulation in the liver on MRI. Diagn Interv Radiol 2016; 22: 22. DOI: 10.5152/dir.2015.15094]
SIR and relaxometry techniques have been used to evaluate liver siderosis through MRI [25-27].
Pancreas
The pancreas is commonly affected by secondary iron overload in all 3 anatomical regions: head, body, and tail. However, the T2* value in the pancreatic head is significantly higher compared to that in the body. The posterior-inferior section of the pancreatic head and the uncinate process originate from the ventral pancreatic anlage, while the remaining regions arise from the dorsal anlage. These 2 segments of pancreatic tissue show differences in various histological and functional characteristics, potentially leading to variations in iron loading [28].
Pancreatic siderosis has been evaluated using SIR techniques and relaxometry techniques. However, the most extensively studied patient groups remain those suffering from beta-thalassaemia and sickle cell anaemia [19,29,30].
Impairment of exocrine and endocrine pancreatic function is a common complication. In individuals with primary or secondary siderosis, iron typically accumulates in pancreatic acinar and duct cells, with irregular deposits in beta cells appearing in later stages. Given this non-uniform distribution, Pfeifer assessed iron content in the pancreas’s head, body, and tail sections using MR-R2*. However, locating these specific regions within the gland was challenging due to movement artifacts, tissue inconsistencies, and fatty infiltration. Identifying the head region, close to the liver, was particularly difficult due to anatomical proximity. The cited study highlights the challenge of simultaneously assessing all 3 anatomical regions; in 45% of subjects, such evaluation was not possible. More than 90% of examined patients showed increased pancreatic R2* rates above the normal threshold. Researchers have described a significant relationship between hepatic and pancreatic R2* rates for all patients and specifically for those with thalassaemia major [31].
Few studies have investigated the correlation between SIR and pancreatic endocrine function, as assessed by the oral glucose tolerance test (OGTT), in thalassaemia patients [30].
Although some research indicates that childhood cancer survivors are at higher risk for pancreatic dysfunction compared to the general population, prevalence varies based on factors such as cancer type, specific treatment received, and follow-up duration. Studies suggest that up to 30% of childhood cancer survivors may experience pancreatic insufficiency or dysfunction in the years following treatment. This population is at risk for impaired glucose tolerance (IGT) and diabetes mellitus (DM), particularly during the second decade of life, with a cumulative DM risk of around 2% [21].
Incorrect MR results may indicate OGTT abnormalities because IGT is associated with a 50% reduction in beta cell function. Early detection of iron overload in paediatric oncology patients is crucial to avoid long-term complications. However, no studies have examined the correlation between imaging features, iron burden, and glucose disruption in this population.
Research on the frequency of iron overload and its association with chemotherapy is limited [32].
Pancreatic fat has become a significant research topic in the past decade. Adipose tissue accumulation is believed to lead to atrophy and fibrosis, negatively affecting systemic metabolism and reducing insulin secretion [31].
The fat replacement index of pancreatic parenchyma has been studied, revealing that 45% of patients with transfusion-dependent haemosiderosis exhibit this condition [30].
Papakonstantinou et al. [30] and Matter et al. [33] found that thalassaemic patients with abnormal glucose tolerance had a lower SIR of the pancreas compared to non-diabetic thalassaemic patients. Their study demonstrated a correlation between SIR and endocrine function as measured by OGTT. According to Au et al. [34], 81% of diabetic and non-diabetic thalassaemic patients had irregular T2* values. Midiri et al. [35] suggested that significant hypointense SIR changes due to iron deposition are observed first, followed by a hyperintense pattern indicative of progressive fatty replacement of the pancreatic parenchyma. This may explain why patients with IGT in Matter et al.’s [33] study had slightly decreased SIR of the pancreas compared to those with diabetes.
Another aspect of systematic iron overload investigated by researchers was the correlation between serum ferritin levels and relaxometry time. Midiri et al. [35] found a correlation between low pancreas-to-fat SIR in gradient echo T2*-weighted sequences and decreased serum ferritin levels.
Papakonstantinou et al. [30] compared the SIR of pancreatic parenchyma to that of the right paraspinal muscle. The pancreas in patients with haemochromatosis shows low SIR on MRI, particularly on T2*-weighted images. However, no correlation has been found between pancreatic SIR and serum ferritin.
Argyropoulou et al.’s [20] findings confirm increased fat content in the pancreas, which is associated with higher T2-relaxometry times, highlighting differences between adults and children.
An effective method for quantifying liver iron should demonstrate high sensitivity and accuracy across the clinically relevant range of LIC.
It should also be easily accessible, quick, affordable, and capable of simultaneously evaluating iron burden and hepatic tissue damage. Liver complications frequently arise during and shortly after cancer treatment. Rostoker et al. [36] demonstrated a strong correlation between LIC measured by SIR and R2* relaxometry and histological scores of iron overload in dialysis patients. However, the prevalence of chronic liver disease and fibrosis among childhood cancer survivors remains largely unknown. Studies in thalassaemic patients have shown a good correlation between liver T2 and elevated ferritin levels, indicating that ferritin is a useful biochemical indicator of hepatic iron overload [19]. Nonetheless, serum bioche-mical tests can be affected by inflammation, infection, or malignancy.
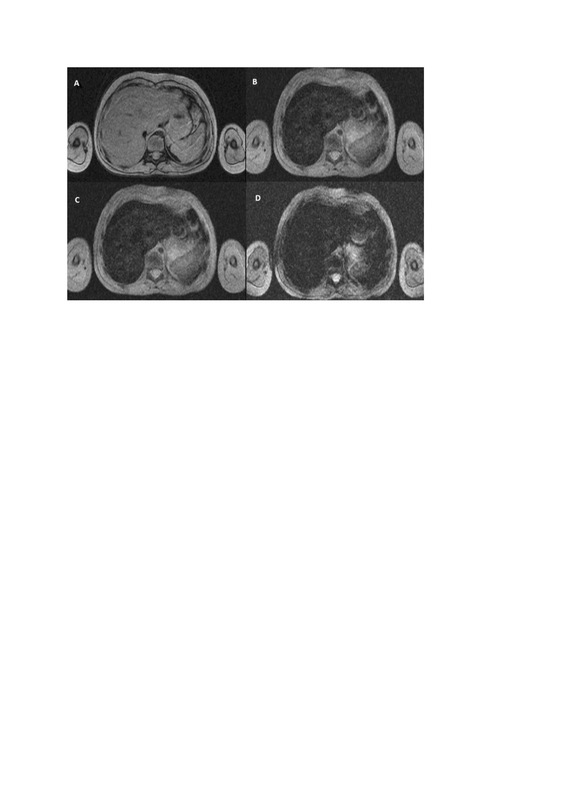
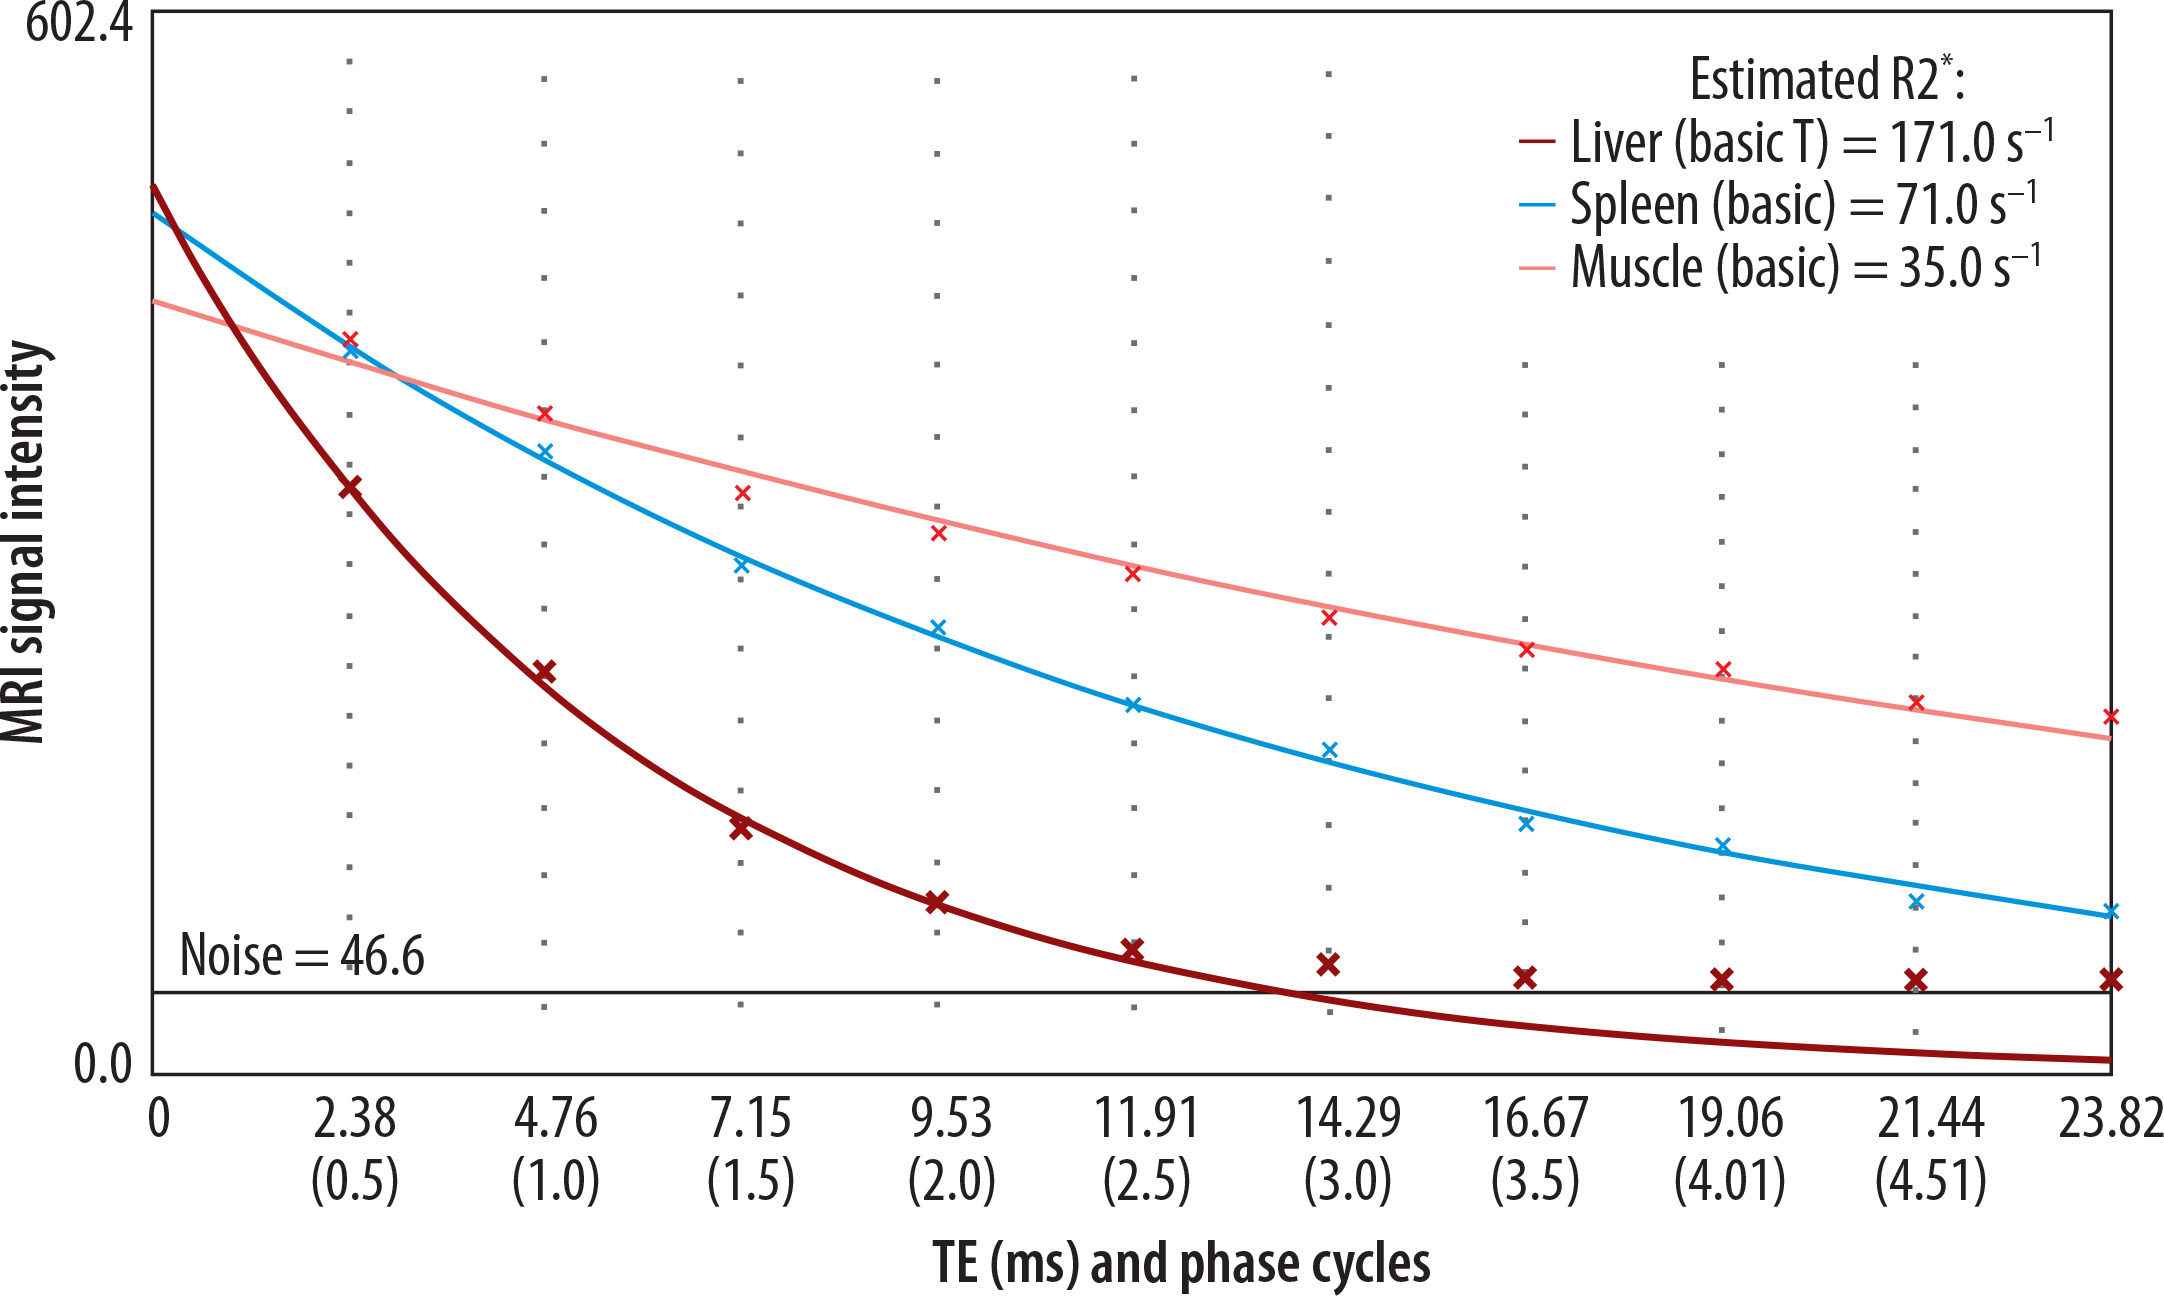
Figure 1
Iron overload in HEMOC sequence (TimeEcho: A – 2.38 ms; B – 9.53 ms; C – 16.67 ms; D – 23.82 ms), case of a 7-year-old patient after chemotherapy and radiotherapy, estimates the iron concentration in liver at 102 μmol/g dry weight (the R2* is estimated at 171.0 s–1 using a simple exponential decay) and spleen at 42 μmol/g dry weight (the R2* is estimated at 71.0 s–1 using a simple exponential decay)
A weak correlation between iron overload in other organs such as the heart, pancreas, and spleen with liver iron overload has been observed. A correlation with liver siderosis was only found in cases of heavy myocardial iron accumulation [7].
Spleen
Although the spleen, which contains reticuloendothelial cells, is the second most common site for iron deposition after the liver, only a few studies have examined its iron overload, and those have reported contradictory results. Most studies have focused on patients with thalassaemia major or sickle cell disease [19,37]. Emy et al. [38] described post-transfusion reticuloendothelial iron overload in children with oncological diagnoses, typically due to the uptake of free iron by macrophages in the spleen and bone marrow, as well as Kupffer cells in the liver. In T2-weighted imaging, 10 of 11 examined children exhibited iron deposition in the spleen.
Çetinçakmak et al. [39] found strong correlations between splenic T2* and hepatic T2* values and serum ferritin levels, probably due to the presence of Kupffer cells in both the liver and spleen. This suggests that splenectomy might have varied effects on tissues, potentially increasing cardiac iron overload and leading to liver enlargement among thalassaemia major patients.
The discrepancies in findings may be attributed to patient age and the size of the patient series, with most research conducted in paediatric haematology focusing on thalassaemia major patients. It is challenging to determine how similar these results are for children undergoing oncological treatment.
Further research is needed to understand the increase in iron levels during cancer treatment and the mechanisms of iron deposition in individual organs [40]. For instance, cisplatin has been shown to damage erythrocytes, leading to anaemia, additional spleen damage, and haemosiderin deposition [41].
Heart
Cardiac failure is the most dangerous complication of secondary haemochromatosis. Prevention of premature cardiac mortality is the principal benefit of early iron overload diagnosis. Cardiac iron overload seems to be independent of the level of liver siderosis, probably due to variations in iron kinetics between liver cells and myocardium [42]. The more dynamic removal of iron from hepatocytes, compared to myocytes, may contribute to the lack of correlation. Previous researchers underline need for examining the dependence between level of myocardial iron and cardiac-related complications such as arrhythmia and reduced left ventricular ejection fraction (LVEF) [19]. Risk factors of cardiac iron accumulation have not been distinguished. However, Wood et al. [43,44] identified a relationship between myocardial T2* and the duration of transfusions, indicating that patients who undergo chronic blood transfusions are at higher risk of developing cardiac symptoms.
The MRI-T2 is considered a method of choice for assessing LIC; however, T2* is advised for measuring myocardial iron overload. Gradient-echo MRI-T2* allows for quick and noninvasive evaluation of iron in the heart [45]. This technique still has potential challenges such as continuous heart movement, variations in blood flow, and overall reproducibility.
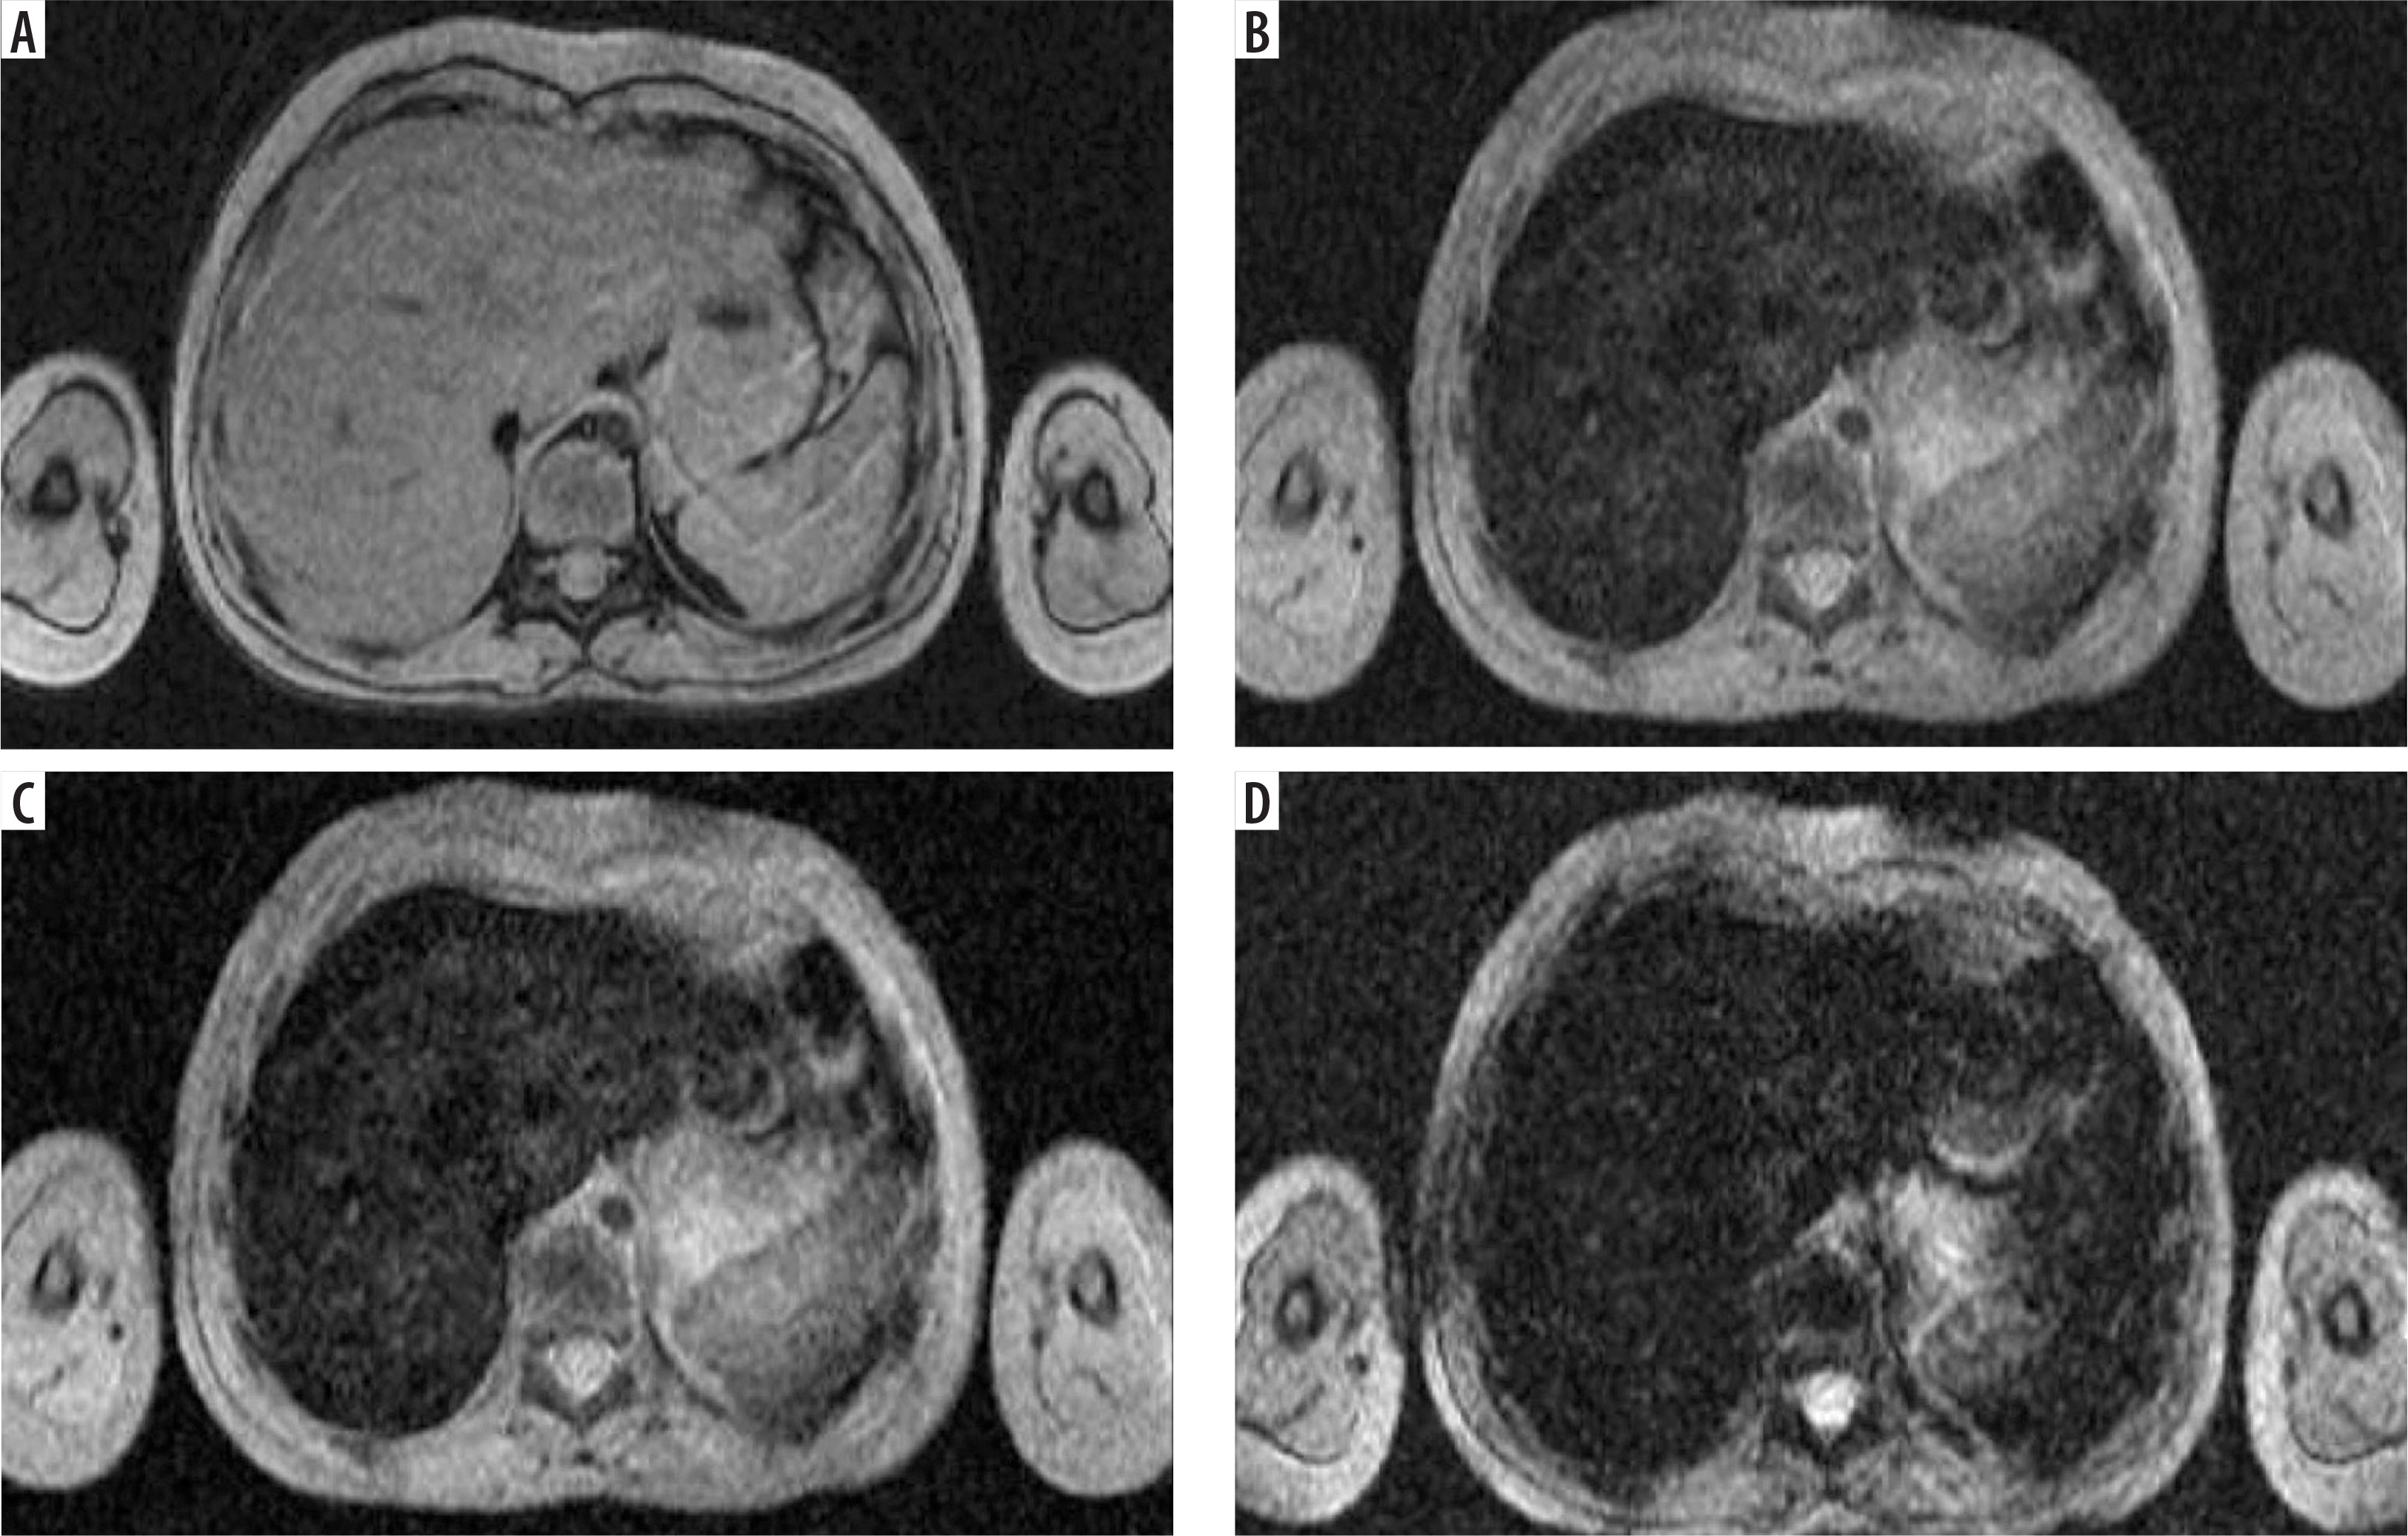
Figure 2
Chart of estimation R2* for calculation of iron overload using MRQuantif (developed by Y. Gandon, MD, Rennes, France)
The method for assessing myocardial iron proposed by Anderson et al. [46] utilises T2* measurements taken from the septal wall (SW) of the left ventricle, with a normal range defined as T2* greater than 20 ms. The single septal approach has limitations, as an abnormal T2* value in the mid-ventricular septum may not reliably reflect homogeneous or heterogeneous myocardial iron overload.
Signal intensity ratio techniques have been reliable for quantifying liver iron; however, they have proven less suited for measuring myocardial iron. This is attributed to the limited sensitivity of spin-echo techniques, motion artifacts, and inadequate signal-to-noise ratios at longer echo times [47].
To our knowledge, there are no established optimal cut-offs to predict cardiac iron. However, such data could allow the design of a more cost-effective algorithm for diagnosing secondary haemochromatosis. Chachap et al. [48] proposed the use of pancreatic R2* and serum ferritin level to estimate negative predictive values (NPV) for cardiac siderosis. This underlines the need for further studies examining the correlation between pancreas and heart siderosis.
Discussion
Iron overload is a serious complication in paediatric oncology patients, potentially leading to endocrine dysfunction, cardiomyopathy, and cirrhosis, all of which can significantly reduce the quality of life for childhood cancer survivors. Haemochromatosis progresses slowly and often remains asymptomatic in its early stages; however, early detection is possible with non-invasive MRI techniques.
Many of the cited studies focus on thalassaemic patients. It is worth highlighting that the results of iron overload studies in paediatric oncology patients may differ, because the cause of the condition is different. In patients with thalas-saemia, the main cause of secondary haemochromatosis is multiple blood-transfusions, while in oncological patients, the problem may be secondary to chemotherapy itself.
Until now, no study has been presented that examines the effects of chemotherapy on iron metabolism in paediatric oncology patients. It is highly relevant to further explore the long-term effects of oncological treatment and fill existing gaps in the literature.
MRI assessment of iron overload in the liver, pancreas, and spleen offers significant advantages over traditional biopsy methods. Techniques such as SIR, T2, and T2* relaxometry provide comprehensive, highly sensitive, and painless evaluation of iron overload across different organs.
Confounding factors, such as image noise and the presence of intrahepatic fat, must be considered in MR-based LIC assessments. Three primary MR techniques – SIR, R2, and R2* – have been developed and approved. According to the current stated of knowledge, R2*-based LIC, corrected for confounders, appears to be the optimal method. It provides the strongest evidence for accurate and reproducible quantification of LIC. These methods are commercially available for both 1.5T and 3T MR scanners and are recommended as the favoured approach for iron quantification when available. SIR and R2-based LIC quantification are also valid alternatives, supported by strong to moderate evidence [49].
Liver complications are common both during and shortly after cancer treatment. However, the prevalence of chronic liver disease and fibrosis among childhood cancer survivors remains largely unknown.
Iron overload, most likely, primarily affects hepatocytes, followed by the beta cells of the pancreas, heart, and spleen. Different organs exhibit unique patterns of iron distribution, depending on the mechanism of overload, necessitating specialised imaging techniques.
Papakonstantinou et al. [30] compared the signal intensity ratios of the spleen and liver to the right paraspinal muscle, utilising T2*-weighted multi-echo gradient-echo sequences. They did not find a direct correlation between splenic and hepatic T2* values; however, signal intensities did correlate with serum ferritin levels [25,37].
The exact pattern of occurrence of organ iron overload to date is unknown. A significant correlation between pancreatic T2* and hepatic T2*, as well as between pancreatic T2* and splenic T2*, has not been proven. It has been suggested that iron accumulation in the pancreas occurs independently [50,51].
Pancreatic iron overload is associated with IGT and DM, highlighting the importance of regular monitoring in this patient population.
No studies conducted so far have examined changes in pancreatic parenchyma among paediatric oncology patients. It is presumed that these changes are similar to those observed in patients with haematological disorders. Further research on oncological treatment effects on pancreatic parenchyma is much needed.
Understanding the distinct kinetics of iron absorption and removal in pancreas, spleen, liver, and heart will enhance clinical management of secondary haemochromatosis and improve outcomes for childhood cancer survivors. Additional research is crucial for developing comprehensive protocols to evaluate iron overload.
We want to emphasise the need for early detection of iron burden to reduce morbidity and long-term complications in paediatric oncology patients.
Advances in MRI offer highly effective, non-invasive tools for assessing iron overload, providing a comprehensive approach to detecting and monitoring haemochromatosis in this population.
It is vital to improve the accessibility of MR methods and validate their efficacy in paediatric oncology settings.
Routine risk screening for early detection of iron burden should be incorporated into the treatment evaluation process. For patients identified with haemochromatosis, appropriate therapy should be implemented.
Follow-up of paediatric oncology patients using MR techniques will significantly enhance their quality of life and reduce the risk of premature mortality.