Introduction
Sjögren’s syndrome is a chronic autoimmune disease characterised by dry eyes and mouth caused by dysfunction of the lacrimal and salivary glands [1]. This condition not only impairs salivary gland function but also significantly affects patients’ quality of life due to chronic discomfort, inflammation, and oral health complications. Sialolithiasis is one of the most common salivary gland diseases primarily affecting the submandibular gland, and the main clinical feature is pain and swelling associated with eating and subsequent sialadenitis [2]. While both conditions present distinct challenges, effective and accurate assessment of salivary gland function is essential for timely diagnosis and management.
Salivary gland scintigraphy has been widely used as an effective tool for assessing salivary gland excretion [3]. However, despite its usefulness for functional studies in Sjögren’s syndrome and sialolithiasis, it remains a two-dimensional imaging modality. This limitation makes three-dimensional analysis and detailed quantitative evaluation of the salivary glands difficult. Furthermore, although computed tomography (CT) imaging provides detailed structural information, it is rarely used to diagnose Sjögren’s syndrome. Using CT imaging alone to diagnose Sjögren’s syndrome could provide a widely accessible and practical diagnostic option at many facilities.
Single-photon emission computed tomography (SPECT/CT), which combines three-dimensional imaging with functional data, has emerged as a powerful modality for assessing patients with head and neck lesions [4-6]. This technique enables detailed quantitative analysis, including the calculation of standardised uptake value (SUV), which is widely used for evaluating jaw lesions in bone SPECT/CT studies [7,8]. Recently, new software such as Xeleris 4DR and Q. Volumetrix MI has enhanced SUV analysis, offering improved operability and resolution [9,10]. The effectiveness of SPECT/CT in Sjögren’s syndrome and submandibular sialolithiasis has been demonstrated [11,12].
Radiomics, a rapidly developing field in medical imaging, involves the extraction of a large number of quantitative features from medical images. By linking these features with biological information about lesions, radiomics can uncover subtle patterns that enhance diagnostic accuracy and improve treatment planning. Radiomics, or the science of extracting quantifiable data from standard-of-care radiologic images like CT images, could be considered the next generation of image evaluation, which has the potential to improve on the current standard [13]. In particular, radiomics has the potential to identify correlations between structural and functional imaging data, offering new insights into disease processes and their quantification.
Few studies, to our knowledge, have investigated the relationship between SUV obtained from SPECT/CT and radiomic features extracted from CT images in patients with salivary gland disorders. Moreover, comparing Sjögren’s syndrome and sialolithiasis offers a unique opportunity to identify features specific to Sjögren’s syndrome because these 2 conditions differ in both their underlying pathophysiology and patterns of gland dysfunction.
Therefore, this study aims to explore the relationship between SUV, a quantitative measure of parotid gland function, and CT-derived radiomic features in patients with Sjögren’s syndrome and sialolithiasis. By comparing these 2 conditions, we seek to identify radiomic features that are specific to Sjögren’s syndrome, providing new insights into its diagnosis and quantitative evaluation.
Material and methods
Patients
This study was approved by the ethical review board of Nippon Dental University Niigata Hospital (ESNG-R-280). Thirteen patients underwent CT imaging and SPECT/CT imaging at our hospital between December 2018 and January 2023. Seven patients were diagnosed with Sjögren’s syndrome (0 men and 7 women; mean age: 56.1 years; range: 17-79 years), and 6 patients were diagnosed with submandibular sialolithiasis (4 men and 2 women; mean age: 51.3 years; range: 23-79 years). The diagnoses of Sjögren’s syndrome were confirmed through the presence of autoantibodies and labial salivary gland biopsy [14,15]. The diagnoses of submandibular sialolithiasis were confirmed through surgical findings. Metal artefacts were observed in the CT images of 11 patients.
SPECT/CT imaging and data analysis
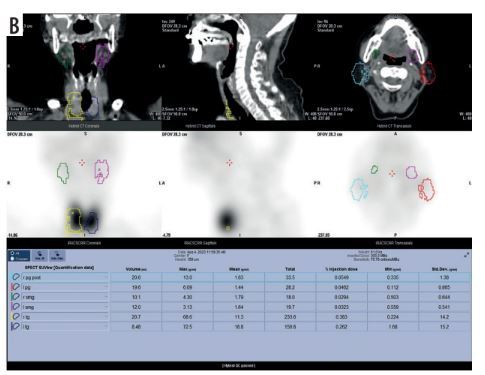
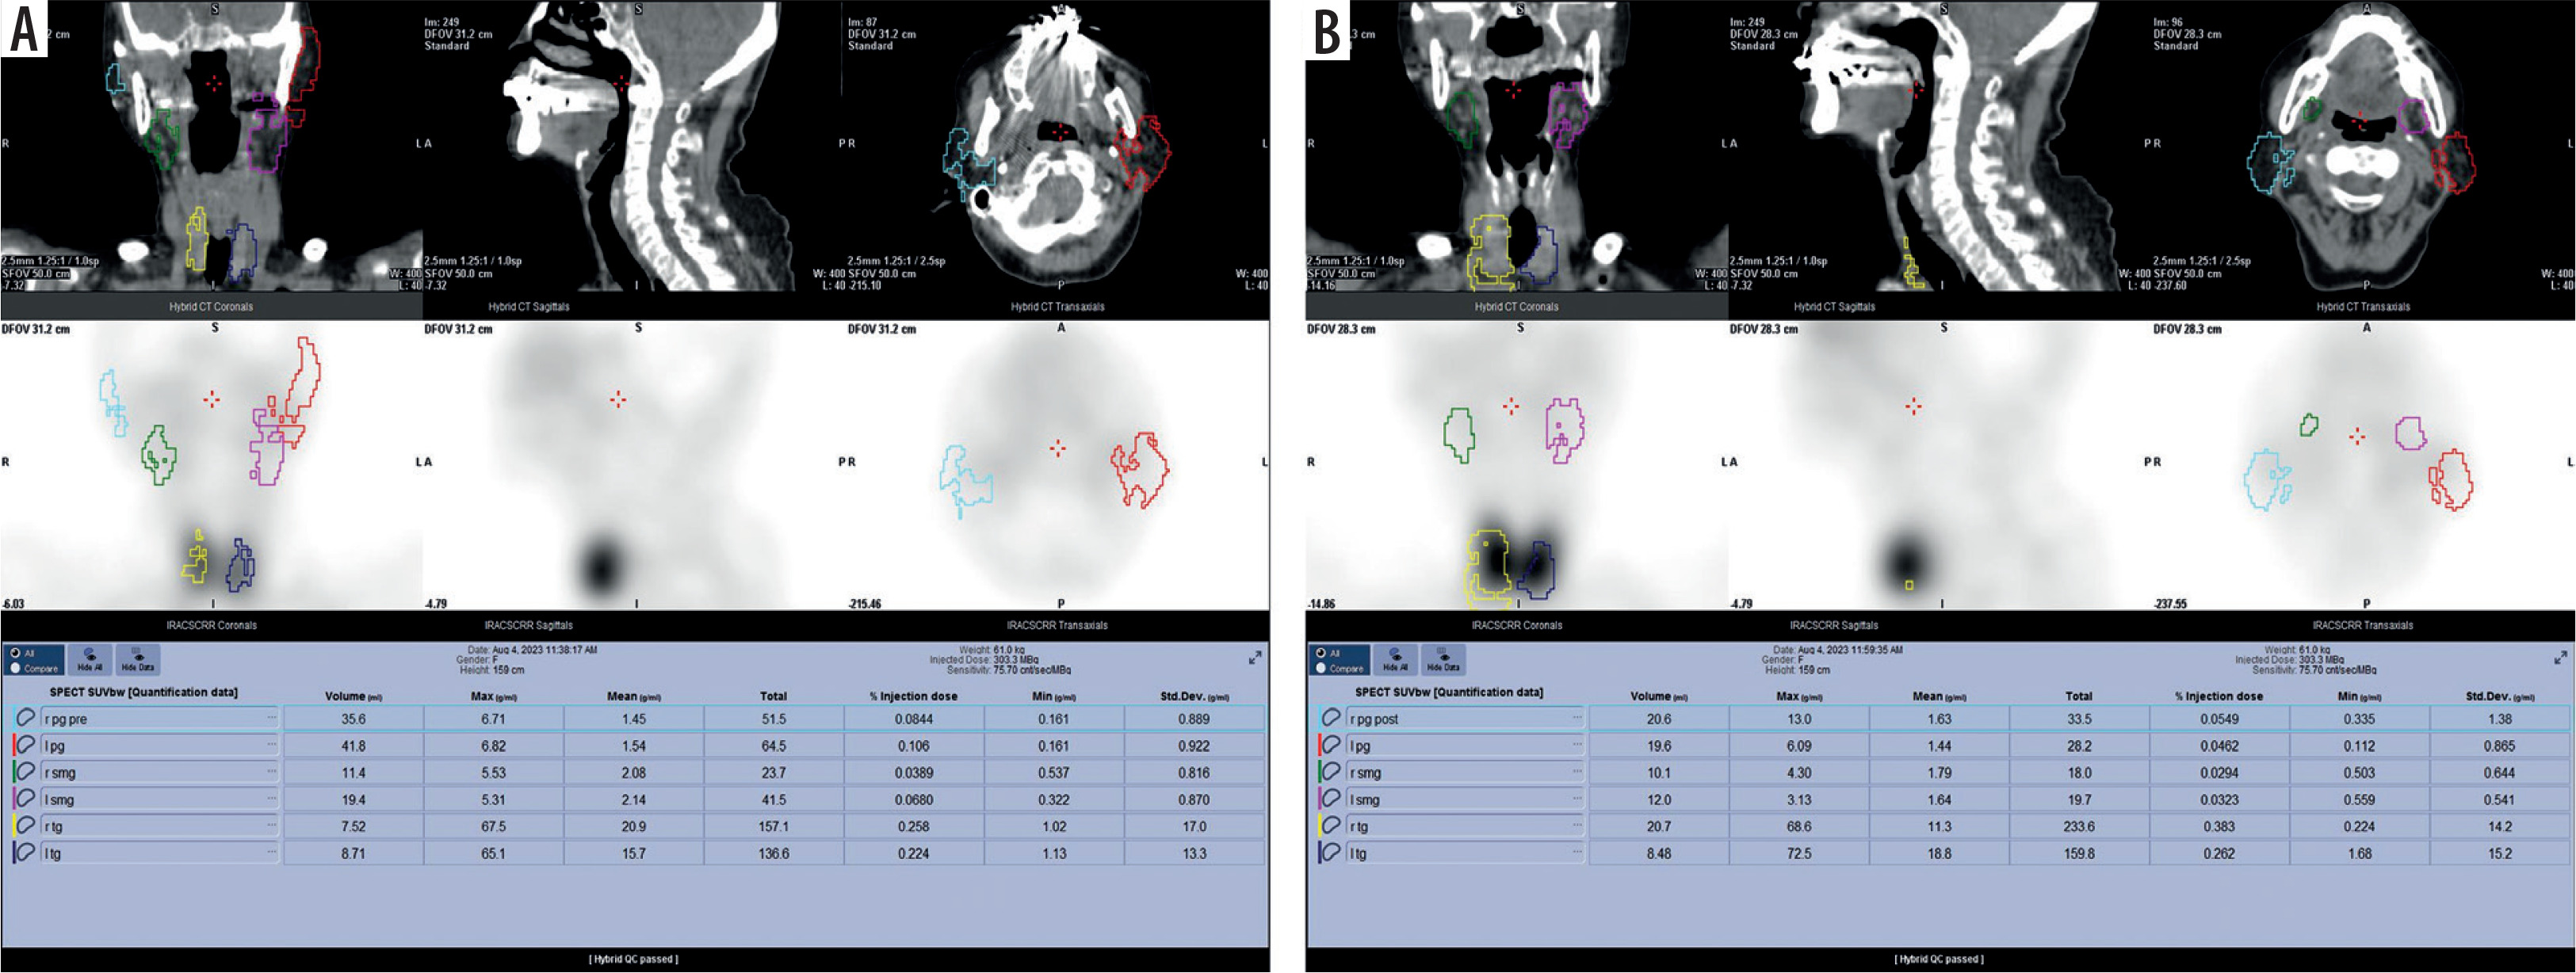
SPECT/CT imaging was performed with a SPECT/CT scanner (Optima NM/CT 640; GE Healthcare, Tokyo, Japan) at 20 min (as pre-stimulation) and at 40 min (post-stimulation using 1.0 ml of citric acid) after injection of 370 MBq of technetium-99m pertechnetate (Technescinti; Nihon Medi-Physics, Tokyo, Japan), in accordance with our hospital protocol [11]. The SUVmean of parotid glands was measured using a workstation and software (Xeleris 4DR and Q. Volumetrix MI; GE Healthcare, Tokyo, Japan), following our hospital protocol [9,10]. A volume of interest (VOI) on the SPECT/CT images was drawn over the parotid glands, and the SUVmean within each VOI was analysed (Figure 1). For cases with metal artefacts, a VOI was created excluding those areas. The VOI was drawn by a radiation technologist, under the supervision of trained dental radiologists.
CT images used to calculate radiomic features
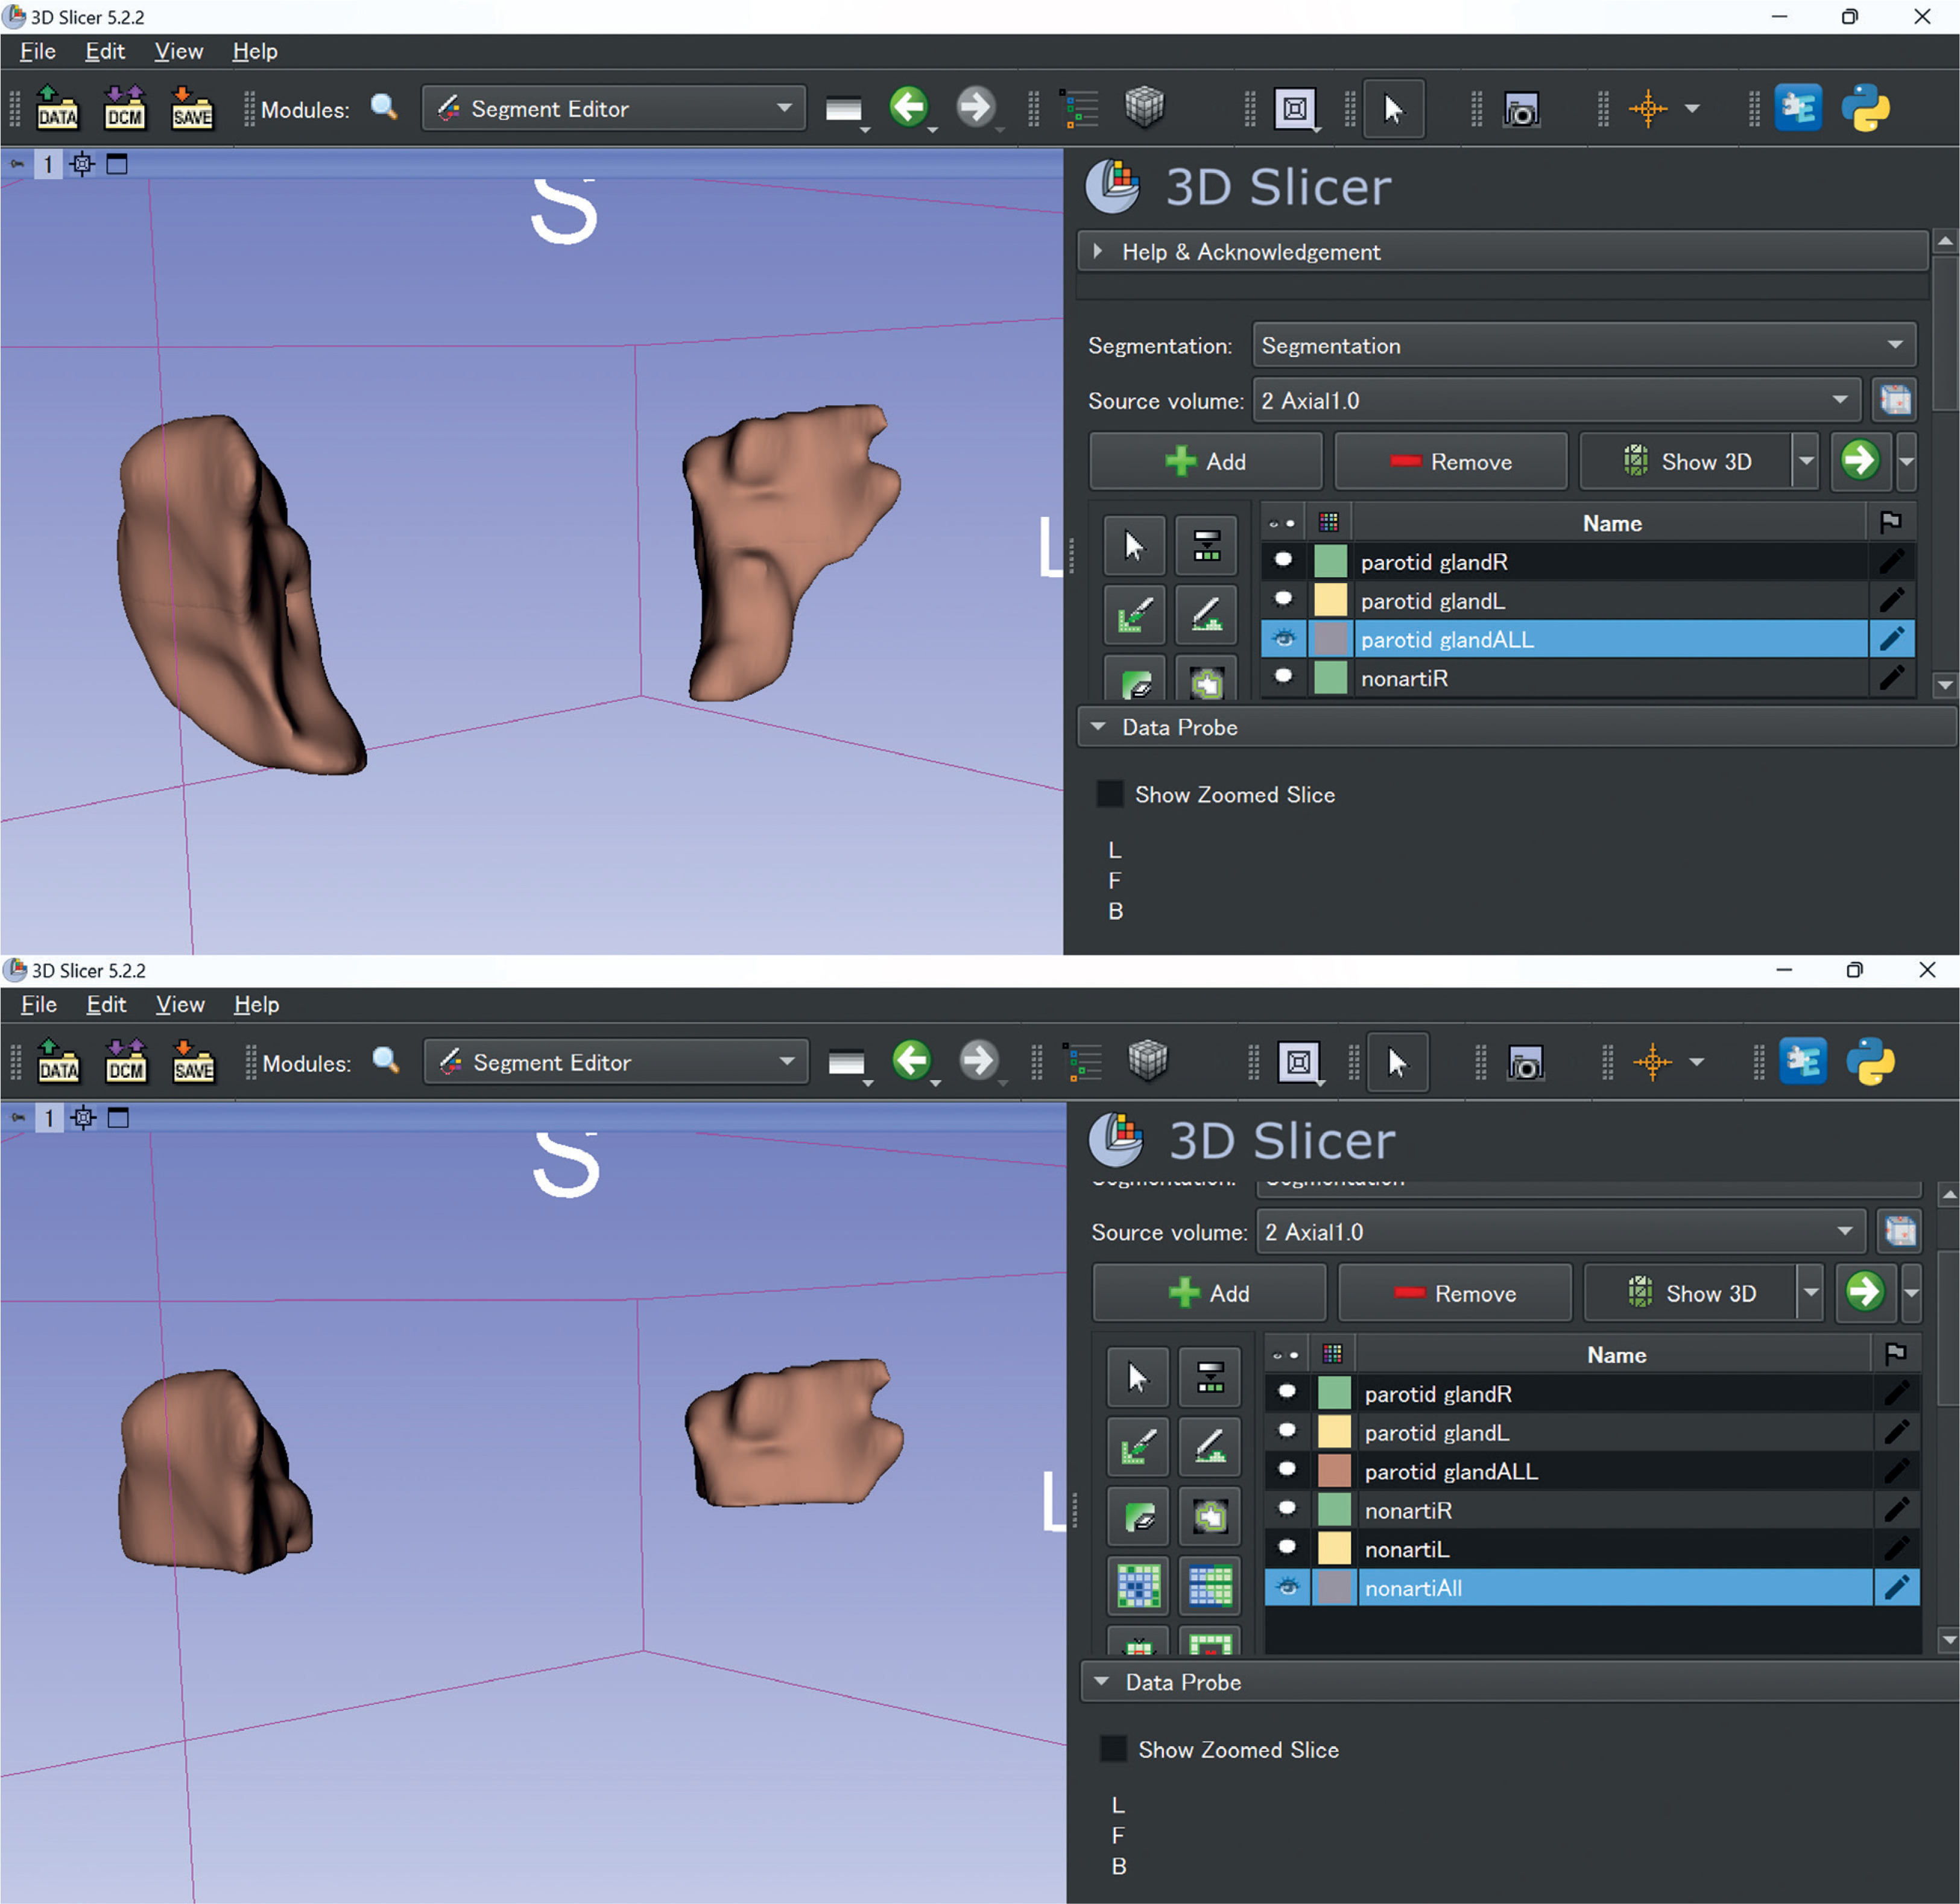
CT imaging was performed with a 16-multidetector CT scanner (Aquilion TSX-101A; Canon Medical Systems, Otawara, Japan) using an oral and maxillofacial protocol at our hospital: tube voltage, 120 kV; tube current, 150 mAs; field of view, 240 × 240 mm; and rotation time, 0.50 s. The patients received non-contrast CT for head and neck lesions. In this study, we used 3D Slicer (http://www.slicer.org/) for parotid gland contour extraction and volume calculation. Contouring was performed slice by slice on transverse sections. Slices with metal artifacts were completely removed and contoured (Figure 2).
Figure 2
CT image of a 72-year-old woman with Sjögren’s syndrome in 3D Slicer. Three-dimensional contour images created using 3D Slicer. (c) Image before contour deletion due to metal artefacts, (d) image after deletion
Radiomic features were calculated using Pyradiomics, an extension of the software 3D Slicer [16]. Segments were created in the CT images, and radiomic features were calculated. The bilateral parotid glands were calculated separately. A total of 107 radiomic features were extracted. However, 94 features were used for analysis because “Shape” features (14 in total) were excluded due to the potential impact of metal artefact removal on the calculation of radiomic features. The 94 radiomic features used in this study are listed in Table 1. The details of the features were referenced (https://pyradiomics.readthedocs.io/en/latest/features.html#).
Table 1
Types of 94 radiomic features obtained from 3D Slicer
Statistical analysis
Spearman’s correlation coefficients were calculated to evaluate the relationships between SUVmean and the 94 radiomic features, both pre- and post-stimulation. This method was chosen because the data did not follow a normal distribution. |r| = 0.6 or more was considered to be strongly correlated. Statistical significance was defined as a p-value < 0.05. For features that showed strong correlations with SUVmean, simple regression equations were generated, and the adjusted R2 values were calculated to evaluate the explanatory power of the regression models. Statistical analysis was performed using EZR (Saitama Medical Centre, Jichi Medical University, Saitama, Japan; https://www.jichi.ac.jp/saitama-sct/SaitamaHP.files/statmedEN.html).
Results
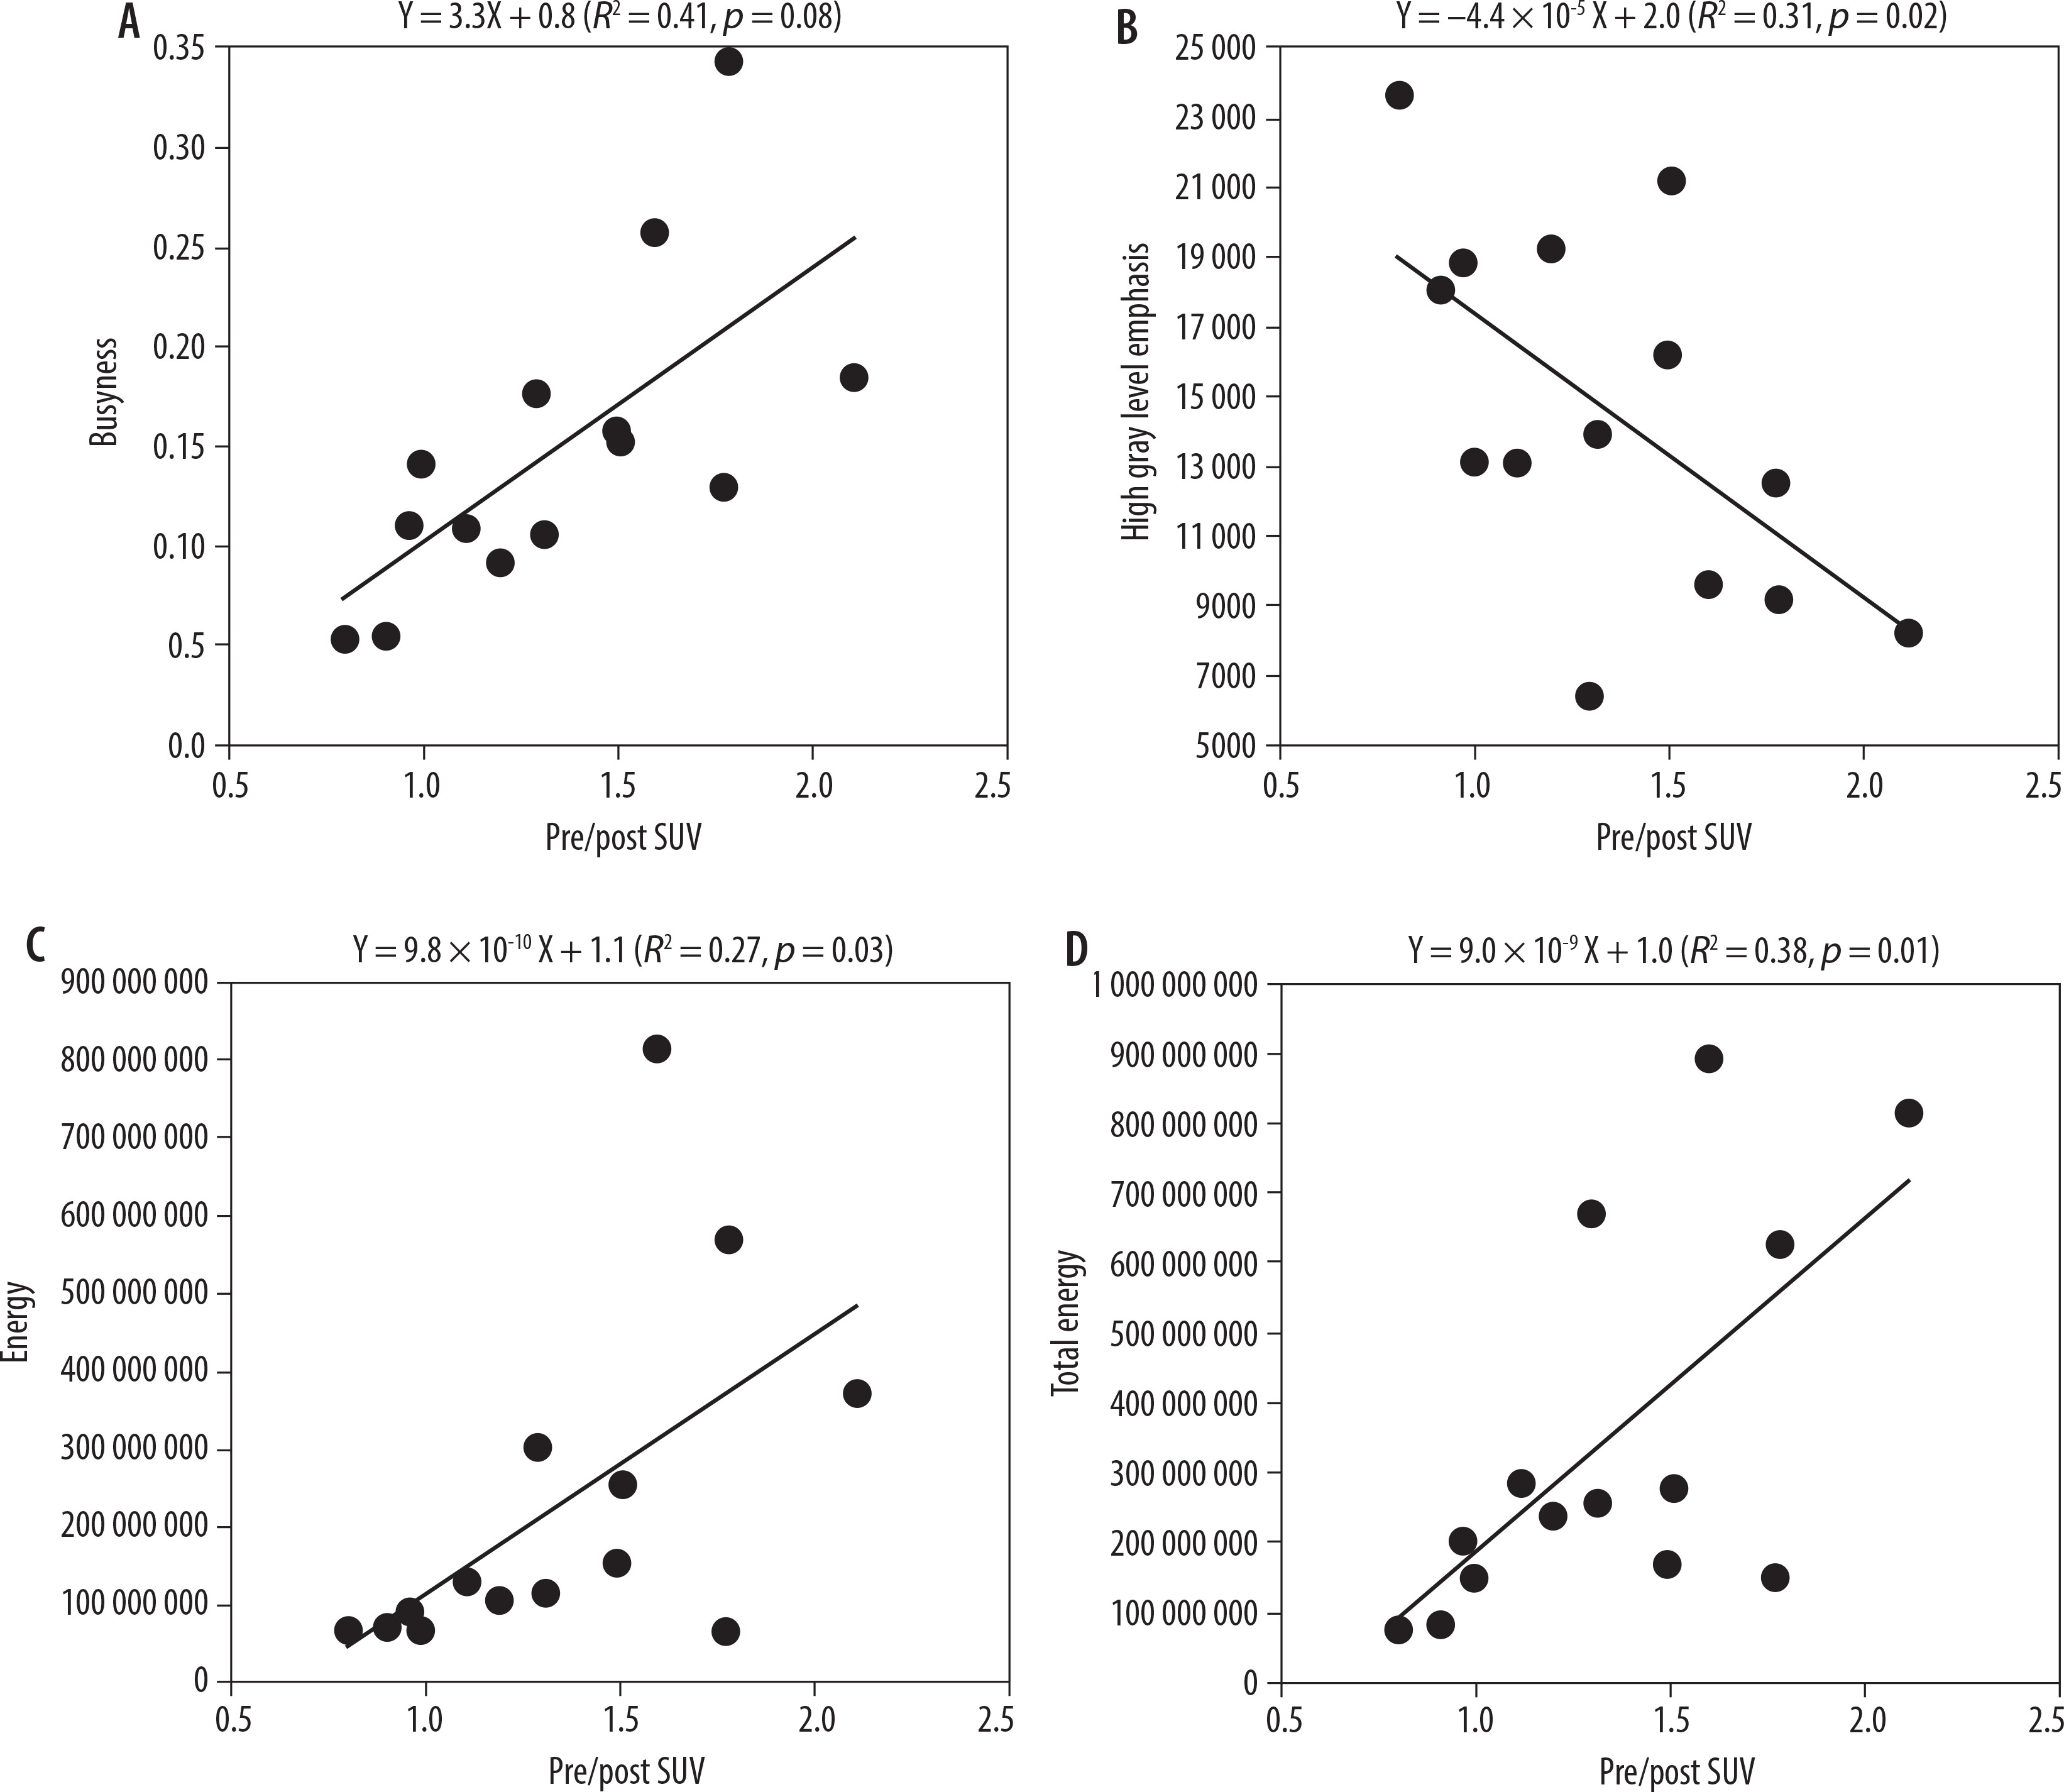
The median (IQR) pre/post SUVmean ratio for patients with Sjögren’s syndrome was 1.30 (1.02-1.57), while that for patients with sialolithiasis was 2.35 (2.23-3.01). In patients with Sjögren’s syndrome, correlations between pre/post SUVmean ratio and radiomic features showed Spearman’s correlation coefficients greater than 0.6 for 4 features (Table 2). From highest to lowest: busyness in neighborhood gray tone difference matrix (NGTDM) (p < 0.01, r = 0.78), energy in first order (p < 0.01, r = 0.70), total energy in first order (p = 0.01, r = 0.66), high grey level emphasis in gray level dependence matrix (GLDM) (p = 0.02, r = –0.60) (Figure 3). In contrast, no radiomic features in patients with submandibular gland sialolithiasis showed strong correlations (|r| ≥ 0.6) with SUVmean ratios.
Table 2
Radiomic features strongly correlated with SUVmean ratios
Discussion
Research on the diagnosis of medical images using radiomic features has been active in recent years. The radiomics approach can automatically extract comprehensive data present in imaging modalities and uncover much more quantitative tumour information than our eyes can detect [17]. In a previous study, analysis of parotid tumours and parotitis was performed using radiomic features from CT images [18,19]. Although it is possible to determine Sjogren’s syndrome using only CT images with high accuracy using deep learning, there are few studies on the relationship with salivary gland function, such as SUV obtained with SPECT/CT [20]. The correlations with SUVmean obtained in this study provide information related to the severity of Sjögren’s syndrome. This study is the first to directly compare SUV and radiomic features in SPECT/CT.
First, a high SUVmean before and after stimulation indicates normal parotid gland function with a large preSUVmean compared to postSUVmean. We will look at the value of each feature. Energy and total energy (first-order features): these features are calculated by squaring the CT values of each pixel and summing the results. Energy is used for local evaluation, whereas total energy is used for overall evaluation. Thus, higher values of these means higher image uniformity and higher pre/post SUVmean ratio. High grey level emphasis (GLDM): this feature highlights the concentration of high-intensity areas in CT images. A high value indicates localised high-intensity regions, suggesting fatty degeneration and fibrosis in the tissue, leading to a low pre/post SUVmean ratio. Busyness (NGTDM): This measures the density differences between adjacent pixels. Higher values indicate smoother textures, signifying uniform tissue in CT images. Uniform parotid tissue suggests normal parotid gland function.
A comparison of parotid glands using magnetic resonance sialography and salivary gland scintigraphy revealed that pre/post SUVmean ratios were higher in images with heterogeneous tissue, which aligns with the findings of this study [21]. Similar results were observed for SUVmean [22]. Conversely, no radiomic features were identified as indicators of salivary lithiasis. This suggests that the 4 of the radiomic features analysed in this study are specific to Sjögren’s syndrome. Furthermore, the findings indicate that CT imaging alone may provide functional information for patients with Sjögren’s syndrome.
In contrast to previous studies that used the maximum standardised uptake value (SUVmax), this study utilised SUVmean, which is less dependent on the individual measurement of the ROI and offers higher reproducibil-ity [11,22].
A key advantage of using 3D Slicer is that it is open-source software, accessible to any facility. Additionally, while many previous studies relied on two-dimensional ROI settings, this study employed three-dimensional ROIs, enabling a more comprehensive evaluation of the entire parotid gland.
This study is limited by its small sample size, necessitating validation with larger cohorts. As machine learning-based automatic diagnosis using radiomic features becomes increasingly common, future studies should aim to develop in this direction. Furthermore, excluding regions affected by metal artifacts limited the evaluation of those areas. Future studies should include patients without metal artifacts for more comprehensive analysis.
Conclusions
There was a strong correlation between the SUVmean ratio on SPECT/CT and radiomic features extracted from CT images in patients with Sjögren’s syndrome. These findings suggest the potential utility of CT radiomics in evaluating salivary gland function, particularly in Sjögren’s syndrome, providing insights into functional assessments without SPECT/CT