Introduction
The incidence of hepatocellular carcinoma (HCC), the predominant form of primary liver cancer, continues to rise globally, making it a significant cause of cancer-related mortality [1,2]. Accurate preoperative assessment of HCC pathological differentiation is crucial because it directly influences treatment planning and patient outcomes [3,4]. Evidence suggests that patients with well to moderately differentiated HCC demonstrate superior overall survival rates and lower recurrence risks compared to those with poorly differentiated tumours [5,6].
Although postoperative pathological examination remains the gold standard for determining HCC differentiation, its invasive nature and potential sampling bias limitations necessitate the development of reliable non-invasive alternatives [7,8]. Conventional imaging approaches using computed tomography (CT), magnetic resonance imaging (MRI), and ultrasound have shown limited success in predicting HCC differentiation grades, primarily due to their dependence on subjective radiological interpretation and restricted feature analysis [9-13].
Radiomics, an emerging field that transforms medical images into high-dimensional quantitative data, has demonstrated promising results in tumour characterisation [14,15]. Recent studies have successfully applied radiomics analysis in various aspects of HCC management, including biomarker prediction, recurrence assessment, and survival prognosis [16-18]. However, research specifically focusing on radiomics-based prediction of HCC pathological differentiation remains limited, with unresolved questions regarding optimal classifier selection and model generalisability [19-21].
The present study aims to develop and validate a combined clinical-radiomics model for preoperative prediction of HCC pathological differentiation. By integrating clinical parameters with radiomics features and presenting the results through a practical nomogram, we seek to establish a more accurate and clinically applicable tool for personalised HCC treatment planning.
Material and methods
Ethical considerations
The institutional Ethics Committee of Youjiang Medical University for Nationalities approved this retrospective investigation (approval number: 2018010401) and waived the requirement for informed consent due to the study design. All procedures were performed in accordance with relevant guidelines and regulations.
Patients
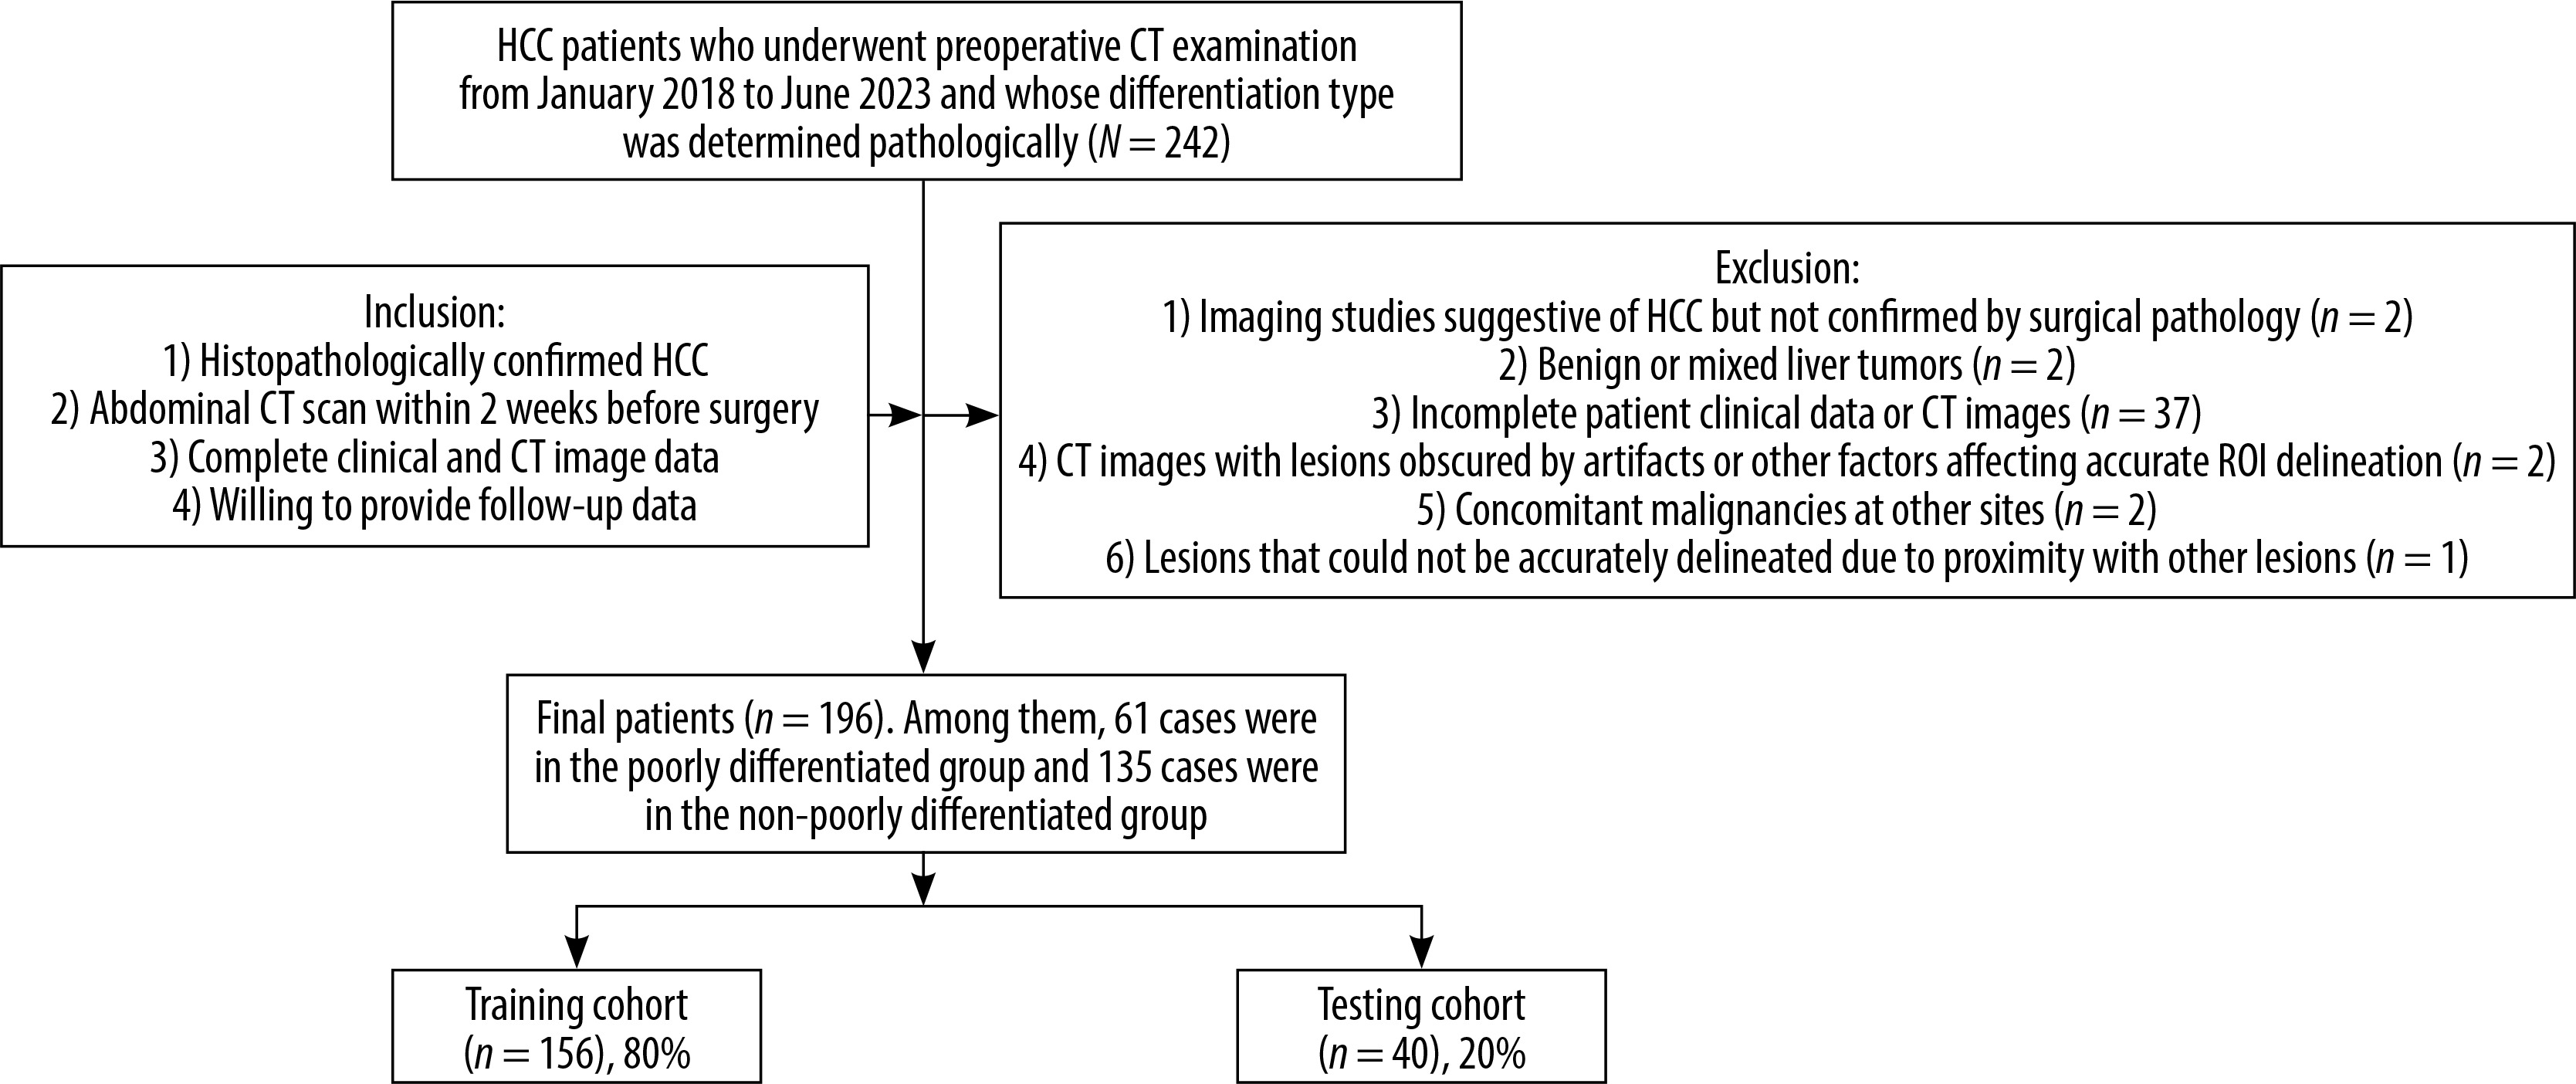
A total of 242 patients with HCC who underwent preoperative CT examination between January 2018 and June 2023 were initially considered for this study. The inclusion criteria were as follows: (1) histopathologically confirmed HCC; (2) availability of abdominal CT scans within 2 weeks before surgery; (3) complete clinical and CT image data; and (4) willingness to provide follow-up information. Patients were excluded if they had: (1) unconfirmed HCC diagnosis; (2) benign or mixed liver tumours; (3) incomplete clinical records; (4) CT images with significant artifacts or unclear lesions; (5) concurrent malignancies in other organs; or (6) lesions that could not be accurately delineated. After applying these criteria, 196 patients were included in the final analysis (Figure 1). For the included patients, clinical information encompassed demographic data, laboratory test results, tumour markers, and detailed surgical/pathological reports. CT examinations were performed with slice thickness ≤ 5 mm, and all images were confirmed to be free from significant artifacts or quality issues that might affect analysis.
Figure 1
The workflow diagram showing the patient selection process. The study initially identified 242 HCC patients between January 2018 and June 2023. After applying inclusion and exclusion criteria, 196 patients were finally enrolled and divided into training (n = 156) and testing (n = 40) cohorts
HCC – hepatocellular carcinoma, CT – computed tomography
CT examination
All CT examinations were performed using a GE Revolution 256-slice CT scanner (Revolution, GE Healthcare, USA). The scanning range covered from the diaphragm to the lower edge of the liver. The scanning parameters were as follows: collimator, 64 × 0.625 mm; rotation time, 0.80 s; pitch, 0.984; matrix, 512 × 512; field of view, 350 mm × 350 mm; tube voltage, 120 kV; tube current, 200-420 mAs; and slice thickness and interval, 5 mm.
Patient groups and clinical data
The study cohort was randomly divided into training (n = 156, 80%) and validation (n = 40, 20%) groups. Clinical data included laboratory parameters (including albumin, alanine aminotransferase (ALT), aspartate aminotransferase (AST), a-fetoprotein (AFP), cancer antigens 153 (CA153), cancer antigens 199 (CA199), carcinoembryonic antigen (CEA), and microvascular invasion (MVI) etc.), demographic information (age, gender), and relevant clinical history (smoking and drinking). HCC differentiation was classified according to World Health Organisation criteria [22], with patients categorised into poorly differentiated and non-poorly differentiated (moderately and well differentiated) groups.
Image preprocessing and segmentation
CT images were preprocessed using Pyradiomics (version 3.7.12) with standardisation to 1 × 1 × 1 mm voxel spacing. Two radiologists (with 12 and 5 years of experience in abdominal imaging) independently performed tumour segmentation on non-enhanced CT images using ITK-SNAP software. Inter-observer agreement was assessed using intraclass correlation coefficients (ICC). Any discrepancies were resolved through consensus or consultation with a senior radiologist.
Radiomics feature extraction
A total of 1834 radiomics features were extracted from each ROI using Pyradiomics (version 3.7.12). Among these features, wavelet-based texture features were computed through a 3-step process. Taking ‘wavelet_LHL_glcm_InverseVariance’ as an example:
1) the wavelet transformation was applied to decompose the original image:
where the LHL sub-band represents high-frequency components in the x and z directions and low-frequency components in the y direction;
2) the Gray-Level Co-occurrence Matrix (GLCM) P(i,j) was computed from the wavelet sub-band:
where N(i,j) represents the frequency of occurrence of pixel pairs with values i and j;
3) the inverse variance was calculated as:
where i and j are the row and column indices in the GLCM, quantifying local homogeneity of the texture.
These features included the following: first-order statistics, shape-based features, and texture features derived from Grey Level Co-occurrence Matrix (GLCM), Grey Level Correlation Matrix (GLDM), Grey Level Run Length Matrix (GLRLM), Gray Level Size Zone Matrix (GLSZM), and Neighbourhood Grey Level Tone Difference Matrix (NGTDM).
Feature selection and radiomics score calculation
The radiomics features underwent sequential processing: (1) normalisation through regularisation; (2) Spearman correlation analysis with correlation threshold of 0.9; (3) Mann-Whitney test with p < 0.05 significance level; and (4) LASSO regression with 10-fold cross-validation for feature selection. The optimal lambda value in LASSO regression was determined through 10-fold cross-validation, mathematically expressed as:
where MSE_i(λ) represents the mean squared error for the i-th fold validation set using regularisation parameter λ. This process involved the following: 1) dividing the dataset into 10 equal-sized subsets; 2) training the model on 9 subsets and validating on the remaining subset; 3) computing MSE for each validation; 4) averaging MSE across all 10 folds; and 5) selecting the lambda value that minimised the average MSE.
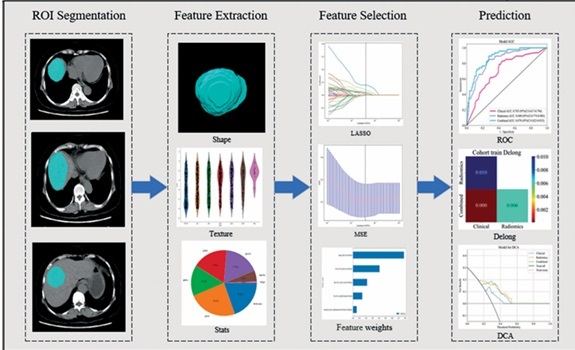
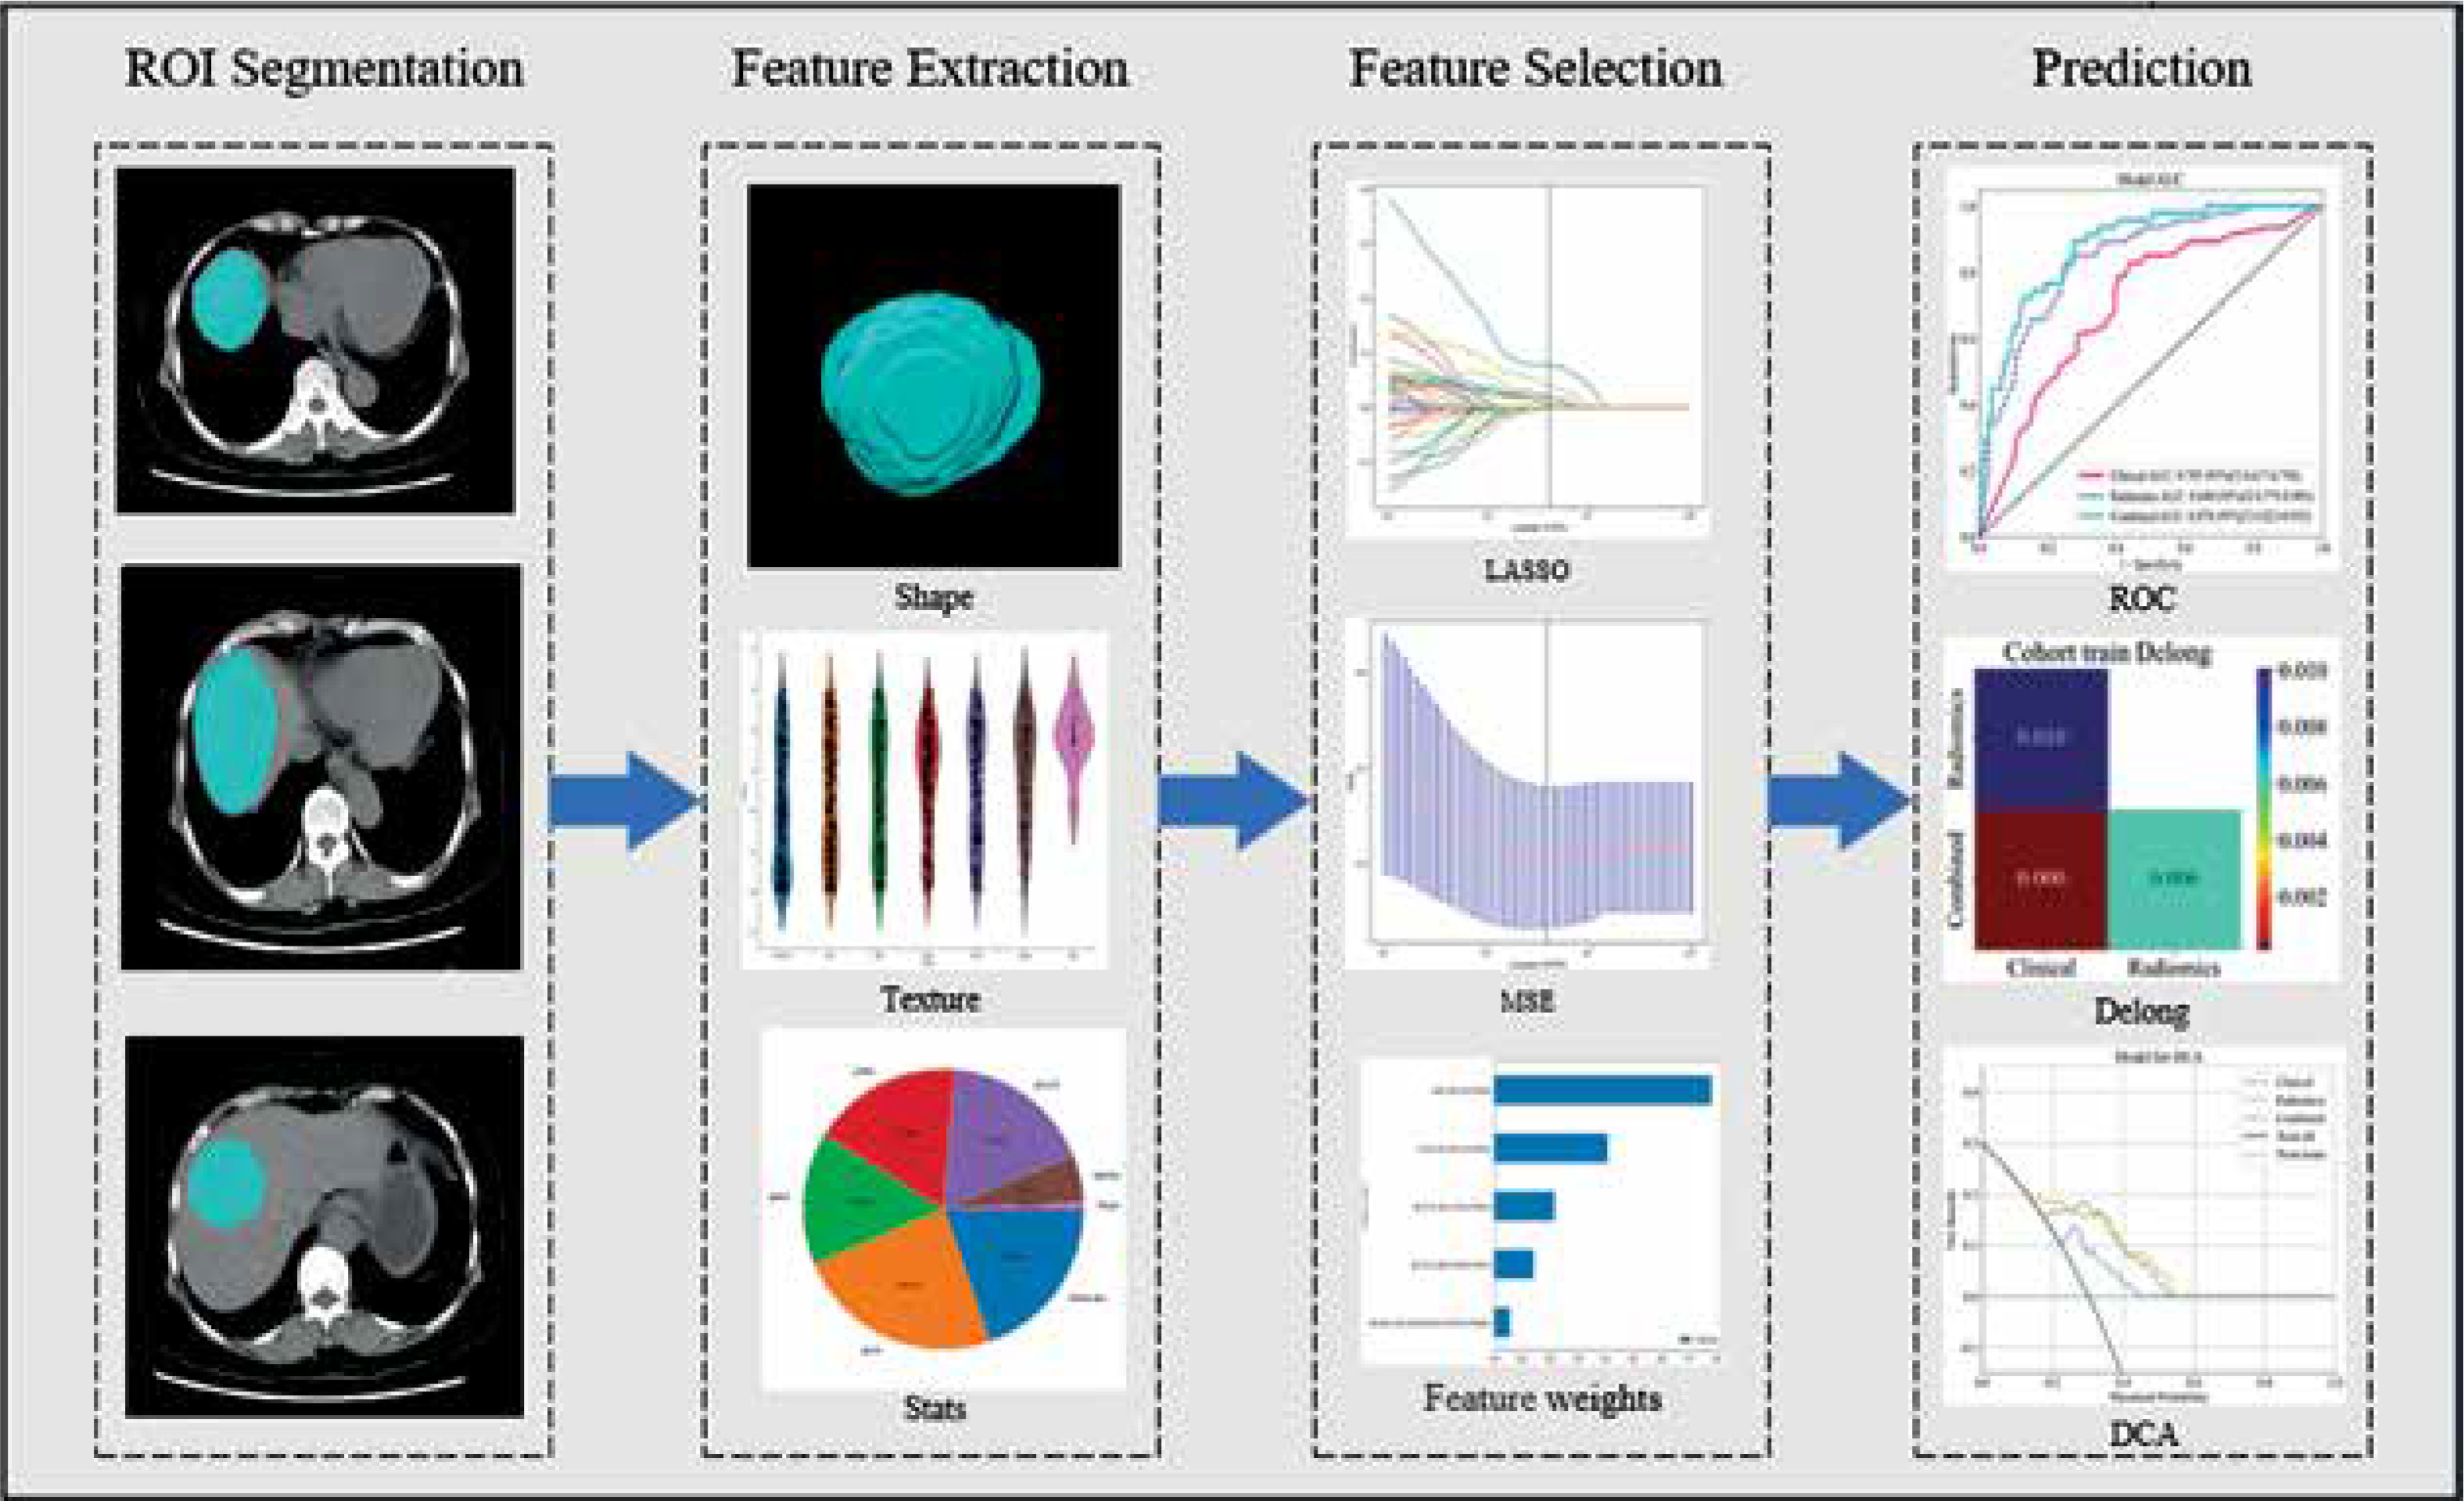
The final radiomics score was calculated using the formula: Rad score = β0 + β1X1 + β2X2 + … + βnXn, where βn represents the coefficient and Xn represents the selected feature. The workflow is illustrated in Figure 2.
Model development
Clinical variables were analysed using univariate and multivariate logistic regression to identify independent predictors of HCC differentiation (p < 0.05). The selection of machine learning classifiers was based on computational efficiency and clinical interpretability considerations. Given our dataset size (n = 196) and available computational resources, we prioritised models that provided optimal performance while maintaining interpretability. Advanced ensemble methods such as XGBoost and Random Forest were not included due to their high computational overhead and reduced interpretability in clinical settings. For the radiomics model, 6 machine learning classifiers were evaluated: logistic regression, support vector machine, K-nearest neighbour, extra trees, light gradient boosting machine, and multilayer perceptron. The best-performing classifier was selected based on the area under the receiver operating characteristic curve (AUC) in the validation set. Five-fold cross-validation was performed to ensure model robustness.
A combined model was then constructed by integrating the optimal radiomics model with significant clinical predictors. Model performance was assessed through receiver operating characteristic (ROC) curve analysis, and the DeLong test was used to compare AUCs between different models. A nomogram was developed to facilitate clinical implementation of the combined model. Decision curve analysis (DCA) was performed to evaluate the clinical utility of each model.
Statistical analysis
Continuous variables were compared using Student’s t-test or the Mann-Whitney U test based on their distribution (assessed by the Shapiro-Wilk test), while categorical variables were analysed using the χ2 test. Clinical characteristics analysed included BMI, CA153, CA199, prothrombin, gender, smoking status, alcohol consumption, hepatitis history, age, albumin, ALT, AST, AFP, CEA, and MVI status.
Feature selection involved multiple steps: (1) correlation analysis using Spearman coefficients (threshold > 0.9 for removal); (2) recursive feature elimination; and (3) LASSO regression for final feature selection. Model performance metrics included sensitivity, specificity, accuracy, and AUC. All statistical analyses were performed using Python (version 3.7.12), with p < 0.05 considered statistically significant.
Results
Patient characteristics
The study included 196 patients with histologically confirmed HCC, divided into training (n = 156) and testing (n = 40) cohorts. Baseline characteristics of both cohorts are presented in Table 1. The mean age was 50.54 ± 11.58 years in the training cohort and 52.52 ± 10.94 years in the testing cohort. Most patients were male (84.71% in the training cohort and 80.00% in the testing cohort). In both cohorts, most patients had hepatitis (80.77% and 72.50%, respectively) and normal albumin levels (74.36% and 77.50%, respectively). Between the training and testing cohorts, significant differences were observed in BMI (22.49 ± 3.48 vs. 21.92 ± 3.14 kg/m2, p = 0.006) and MVI status (37.82% vs. 40.00%, p = 0.049). Other clinical parameters, including tumour markers (CA153, CA199, AFP, CEA), liver function tests (ALT, AST), and demographic characteristics showed no significant differences between the cohorts (all p > 0.05).
Table 1
Clinical characteristics of patients in the training and testing cohorts
| Feature name | Train-label (n = 156) | p-value | Test-label (n = 40) | p-value |
|---|---|---|---|---|
| BMI (kg/m2) | 22.49 ± 3.48 | 0.268 | 21.92 ± 3.14 | 0.006* |
| Prothrombin | 12.83 ± 7.56 | 0.287 | 11.52 ± 1.86 | 0.989 |
| Age (years) | 50.54 ± 11.58 | 0.516 | 52.52 ± 10.94 | 0.685 |
| CA153 | 15.03 ± 8.59 | 0.137 | 15.12 ± 14.38 | 0.977 |
| CA199 | 42.39 ± 101.56 | 0.753 | 32.27 ± 62.02 | 0.876 |
| Sex | 0.206 | 1.0 | ||
| Female | 23 (14.74) | 8 (20.00) | ||
| Male | 133 (84.71) | 32 (80.00) | ||
| Smoke | 0.921 | 0.608 | ||
| No | 97 (62.18) | 25 (62.50) | ||
| Yes | 59 (37.82) | 15 (37.50) | ||
| Drink | 1.0 | 0.219 | ||
| No | 87 (55.77) | 28 (70.00) | ||
| Yes | 69 (44.23) | 12 (30.00) | ||
| Hepatitis | 0.496 | 1.0 | ||
| No | 30 (19.23) | 11 (27.50) | ||
| Yes | 126 (80.77) | 29 (72.50) | ||
| Albumin (g/dl) | 1.0 | 0.781 | ||
| Normal | 116 (74.36) | 31 (77.50) | ||
| Abnormal | 40 (25.64) | 9 (22.50) | ||
| ALT (U/l) | 0.993 | 1.0 | ||
| < 40 | 98 (62.82) | 28 (70.00) | ||
| ≥ 40 | 58 (37.18) | 12 (30.00) | ||
| AST (U/l) | 0.577 | 0.763 | ||
| < 40 | 86 (55.13) | 23 (57.50) | ||
| ≥ 40 | 70(44.87) | 17 (42.50) | ||
| AFP (ng/mL) | 0.257 | 0.219 | ||
| < 25 | 62 (39.74) | 21 (52.50) | ||
| ≥ 25 | 94 (60.26) | 19 (47.50) | ||
| CEA (ng/ml) | 0.562 | 0.571 | ||
| < 5 | 141 (90.38) | 37 (92.50) | ||
| ≥ 5 | 15 (9.62) | 3 (7.50) | ||
| MVI | 0.327 | 0.049* | ||
| No | 97 (62.18) | 24 (60.00) | ||
| Yes | 59 (37.82) | 16 (40.00) |
Univariate and multivariate logistic analysis and construction of clinical models
Univariate and multivariate logistic analyses were performed to identify predictive factors for the pathological differentiation in HCC patients. Univariate analysis identified 13 variables significantly associated with HCC differentiation (p < 0.05), including sex, smoking status, drinking status, hepatitis, age, albumin, ALT, AST, AFP, BMI, prothrombin, MVI, and CA153 (Table 2). In the subsequent multivariate analysis, only BMI (OR: 0.923, 95% CI: 0.875-0.973, p = 0.013) and CA153 (OR: 1.061, 95% CI: 1.020-1.102, p = 0.012) remained as independent predictors. The clinical model achieved AUCs of 0.705 (95% CI: 0.617-0.794) in the training cohort and 0.658 (95% CI: 0.472-0.844) in the testing cohort (as shown in Figure 4C and D).
Table 2
Univariate and multivariate analysis for predicting HCC pathological differentiation
| Variable | Univariate analysis | p-value | Multivariable analysis | p-value |
|---|---|---|---|---|
| OR (95%) | OR (95%) | |||
| Sex | 0.385 (0.280-0.530) | 0.001* | 0.469 (0.193-1.142) | 0.162 |
| Smoke | 0.405 (0.252-0.649) | 0.002* | 0.494 (0.162-1.502) | 0.297 |
| Drink | 0.437 (0.285-0.673) | 0.002* | 1.739 (0.602-5.023) | 0.391 |
| Hepatitis | 0.465 (0.340-0.637) | 0.001* | 2.213 (0.908-5.398) | 0.143 |
| Age | 0.455 (0.243-0.851) | 0.039* | 1.031 (0.462-2.303) | 0.950 |
| Albumin | 0.429 (0.243-0.756) | 0.014* | 0.823 (0.391-1.730) | 0.666 |
| ALT | 0.450 (0.282-0.717) | 0.005* | 1.669 (0.702-4.112) | 0.324 |
| AST | 0.373 (0.240-0.580) | 0.001* | 0.504 (0.215-1.183) | 0.186 |
| AFP | 0.516 (0.361-0.739) | 0.002* | 1.405 (1.026-1.328) | 0.408 |
| CEA | 0.667 (0.280-1.586) | 0.442 | ||
| BMI | 0.963 (0.951-0.975) | 0.001* | 0.923 (0.875-0.973) | 0.013* |
| Prothrombin | 0.940 (0.919-0.962) | 0.001* | 0.982 (0.939-1.026) | 0.500 |
| MVI | 0.553 (0.353-0.864) | 0.029* | 1.645 (0.896-3.111) | 0.199 |
| CA153 | 0.968 (0.952-0.984) | 0.001* | 1.061(1.020-1.102) | 0.012* |
| CA199 | 0.993 (0.987-0.999) | 0.057 |
Figure 3
LASSO regression analysis results. A) Feature coefficient paths with optimal lambda value (λ = 0.0391). B) Mean squared error curve from 10-fold cross-validation. C) Coefficient values of the selected radiomic features.
LASSO – least absolute shrinkage and selection operator, MSE – mean squared error, GLDM – grey level dependence matrix, GLCM – grey level co-occurrence matrix
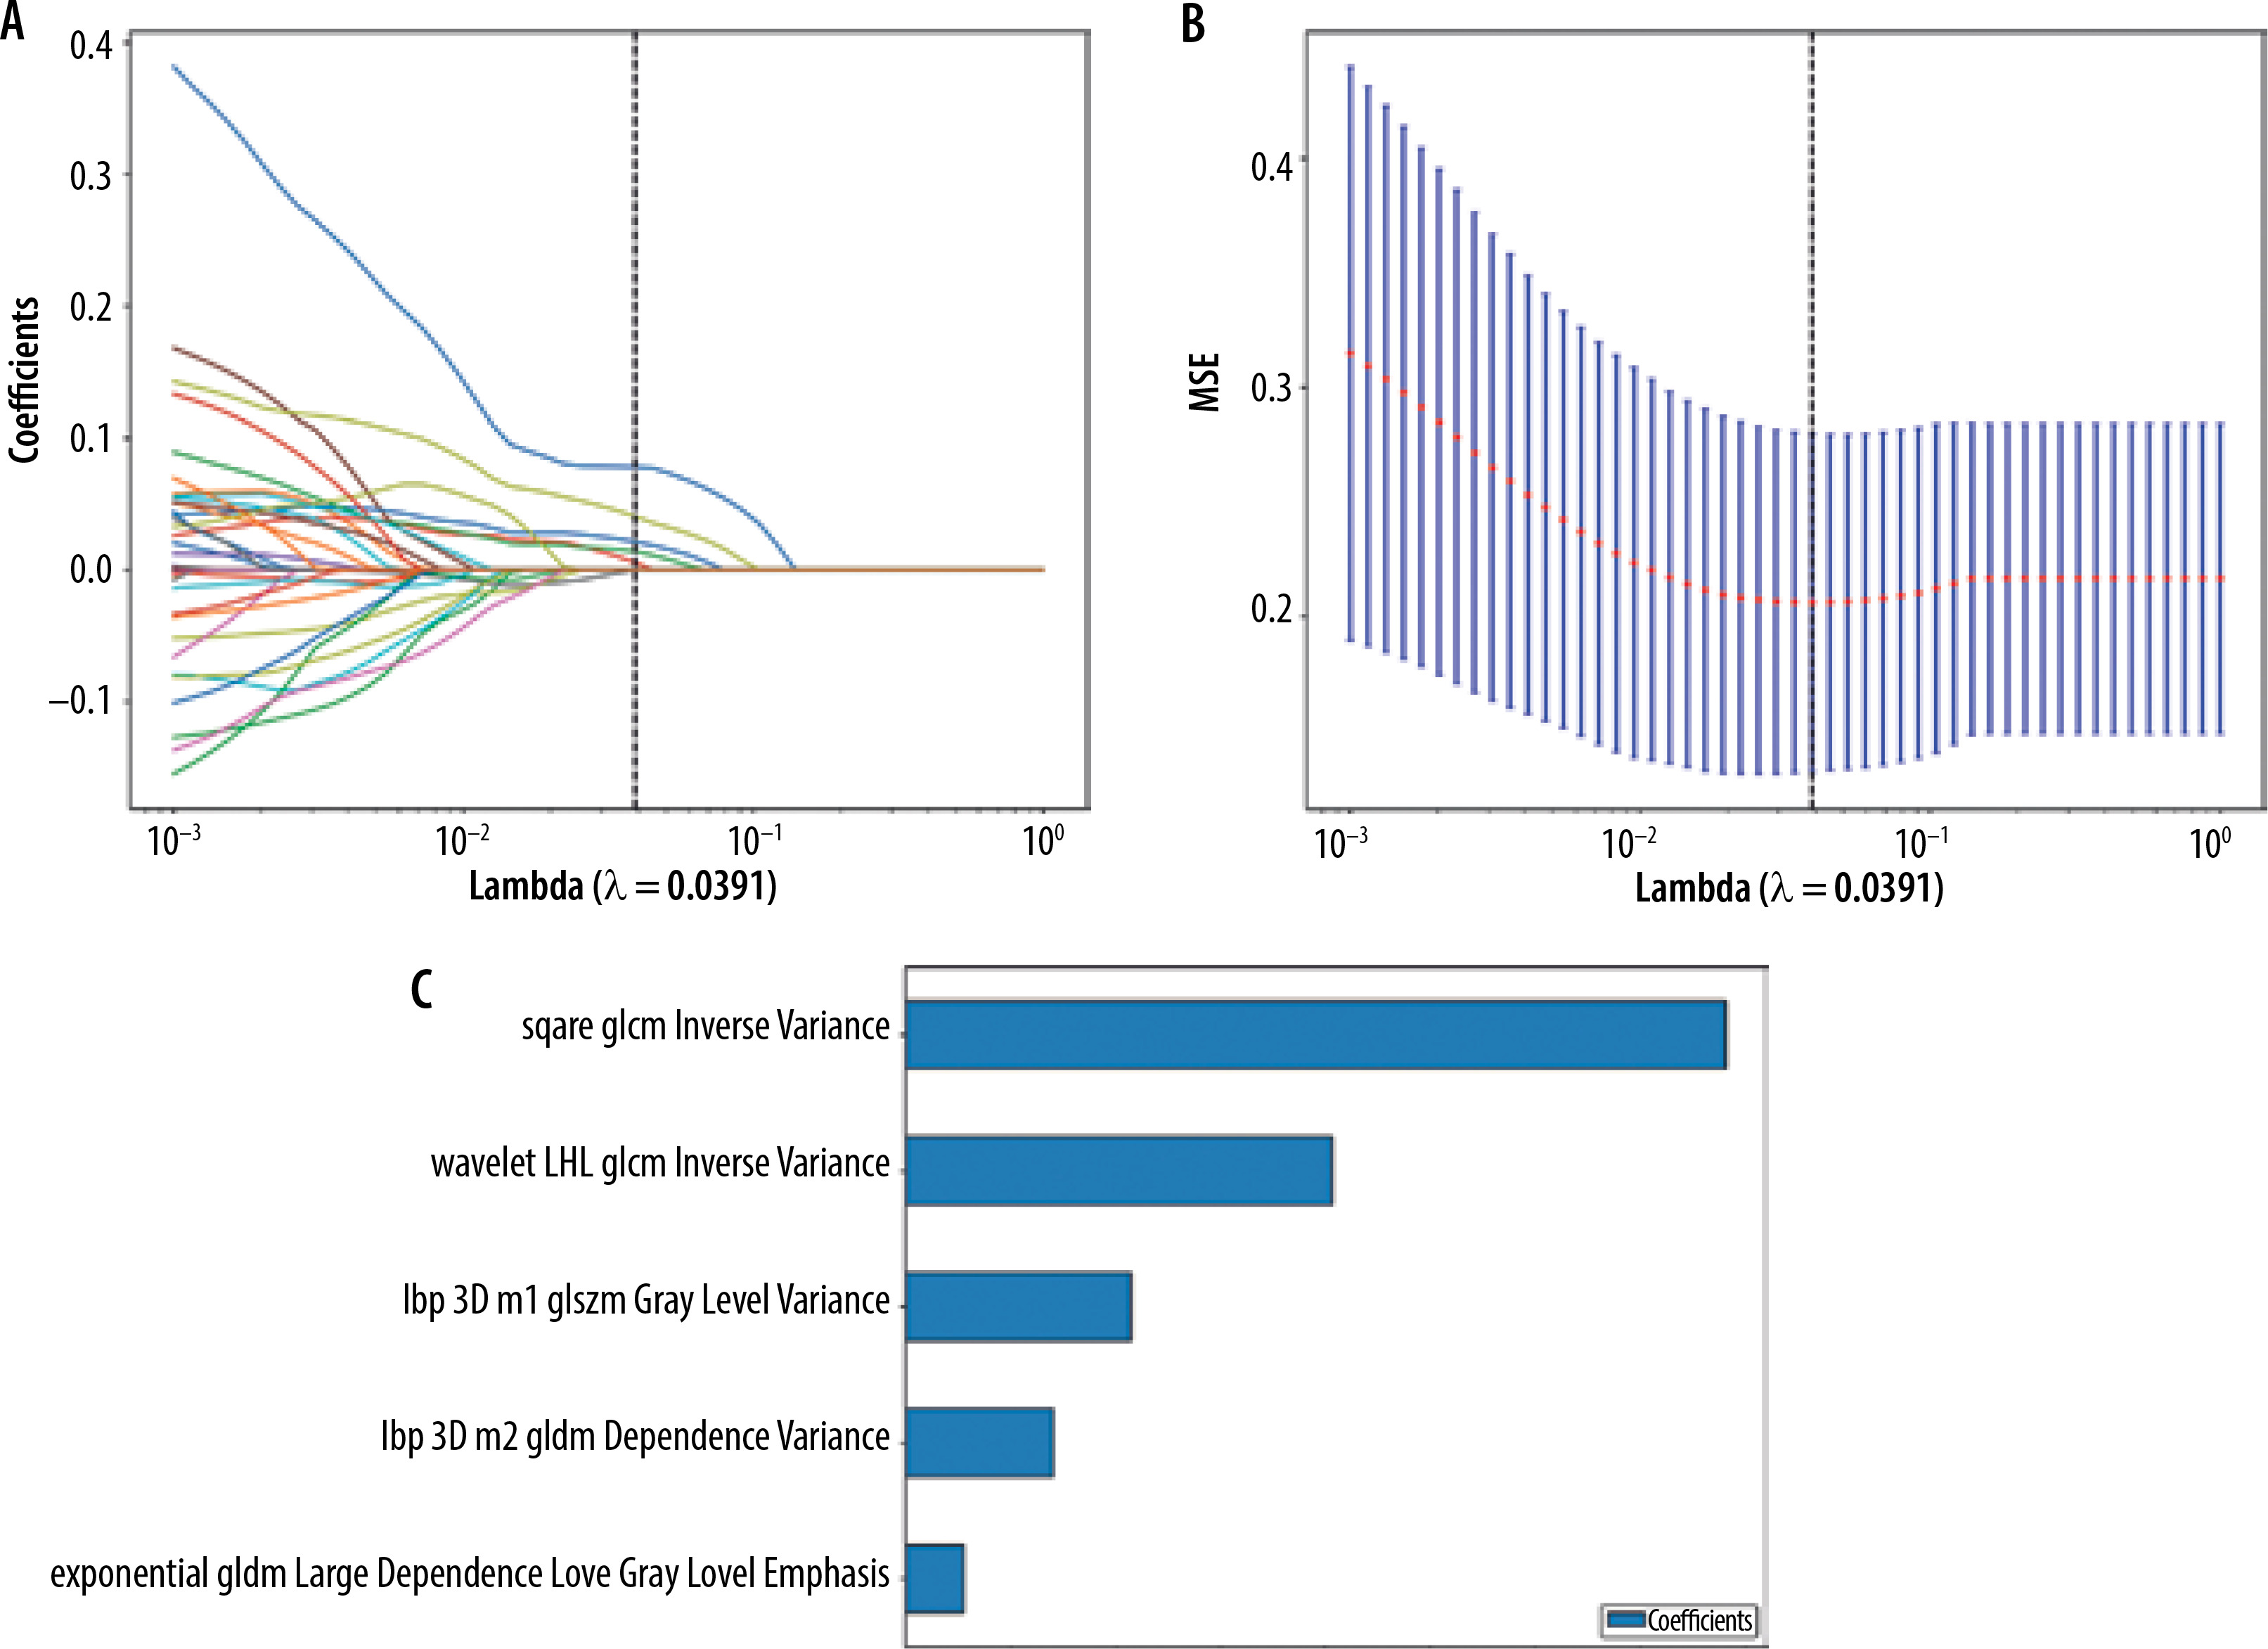
Figure 4
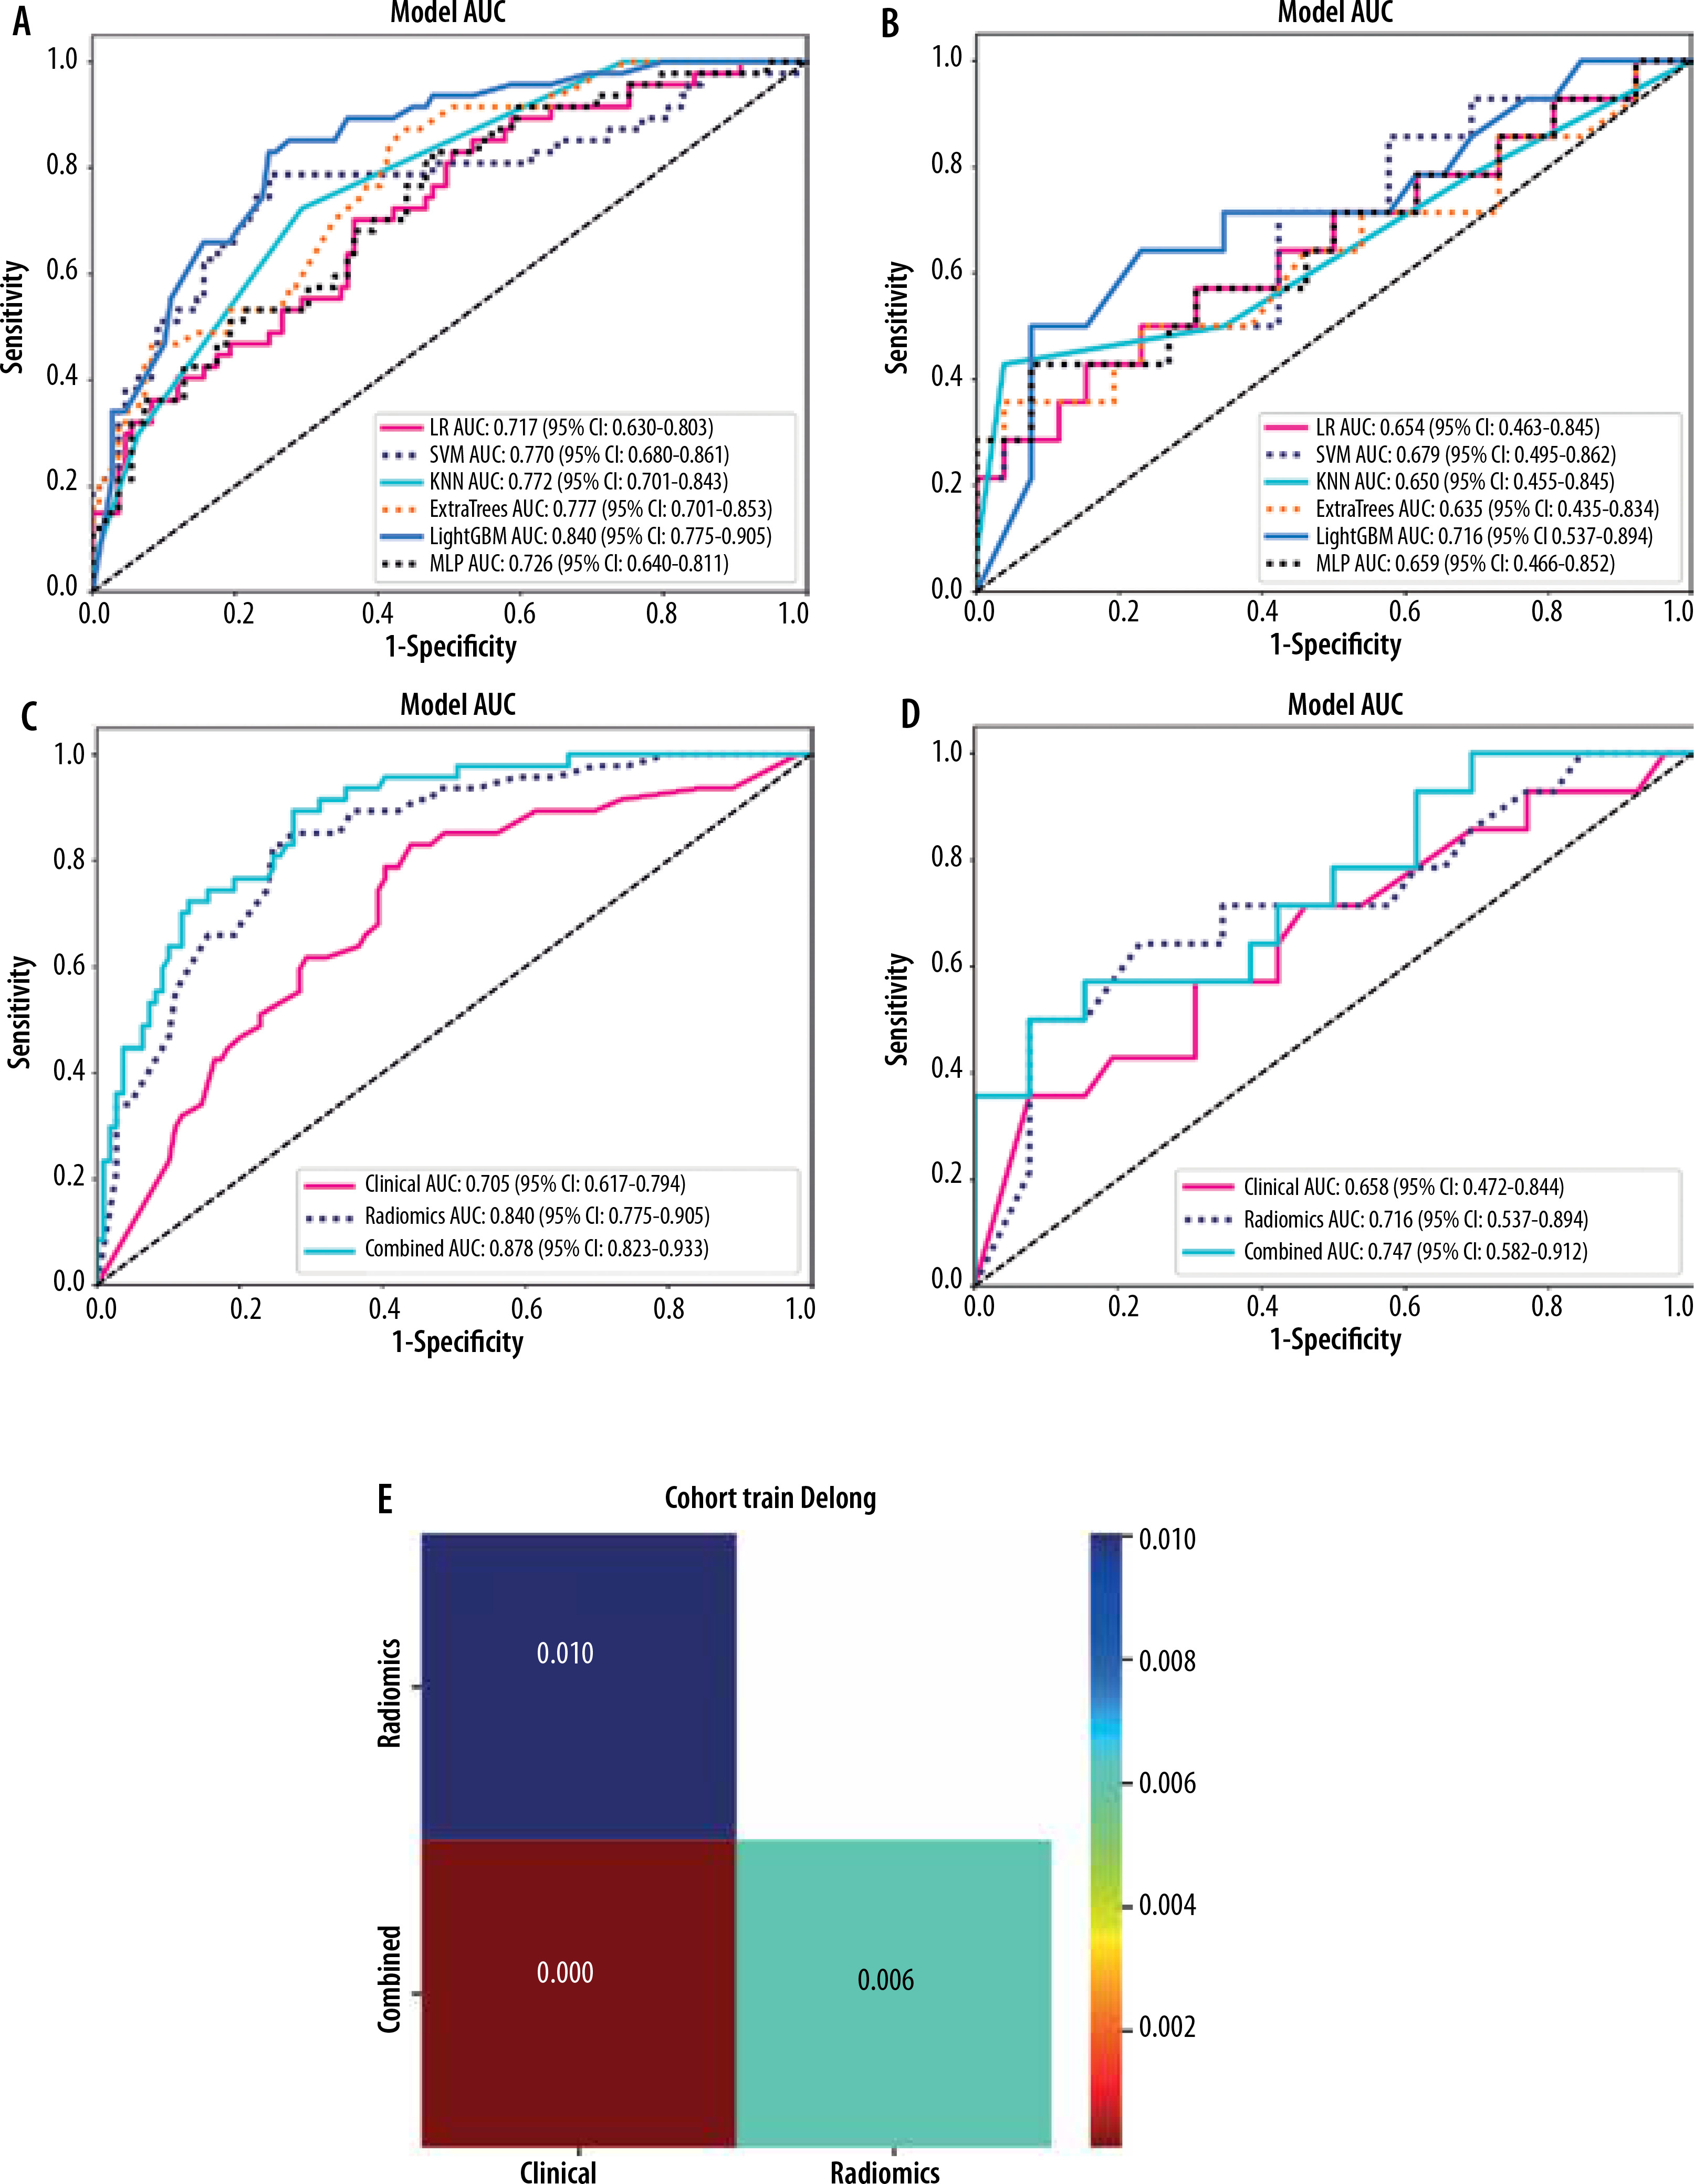
Comparison of model performance in predicting HCC pathological differentiation. A) ROC curves comparing 6 machine learning algorithms in the training cohort, showing LightGBM achieved the highest AUC (0.840). B) ROC curves of the algorithms in the testing cohort, with LightGBM maintaining superior performance (AUC = 0.716). C) ROC curves comparing the clinical model (AUC = 0.705), radiomics model (AUC = 0.840), and combined model (AUC = 0.878) in the training cohort. D) Model comparison in the testing cohort, demonstrating maintained performance of the combined model (AUC = 0.747). E) Heat map of DeLong test results showing significant differences between the combined model and individual models (p < 0.05)
ROC – receiver operating characteristic, AUC – area under the curve, CI – confidence interval, LightGBM – light gradient boosting machine, HCC – hepatocellular carcinoma
Radiomic feature selection and radiomics score
A total of 1834 radiomic features were extracted from tumour ROIs on preoperative CT images, encompassing first-order statistics, shape-based features, and texture parameters (GLDM, GLRLM, GLSZM, and NGTDM).
The LASSO regression analysis was performed for feature selection and dimensionality reduction (Figure 3). The coefficient paths of different features are shown in Figure 3A, where the vertical dashed line indicates the optimal lambda value (λ = 0.0391). Figure 3B demonstrates the mean squared error at varying lambda values during 10-fold cross-validation. At the optimal lambda, 5 non-zero coefficient features were selected from the training cohort. The relative importance and coefficient values of these selected features are presented in Figure 3C.
The radiomics score was calculated using the following formula:
Radiomics model establishment and selection
Six machine learning classifiers were evaluated to develope the radiomics model, including logistic regression (LR), support vector machine (SVM), k-nearest neighbours (KNN), extra trees, light gradient boosting machine (LightGBM), and multilayer perceptron (MLP). The ROC curves in Figures 4A-B provide a comprehensive comparison of the discrimination performance of the different radiomics models evaluated in this study. The LightGBM algorithm achieved the highest performance with AUCs of 0.840 (95% CI: 0.775-0.905) in the training cohort and 0.716 (95% CI: 0.537-0.894) in the testing cohort (Figure 4A and B). Based on its superior performance, LightGBM was selected for the construction of the final radiomics model. Therefore, when building the integrated combined model combining clinical features and radiomics features, the LightGBM algorithm was selected as the basis for the radiomics component.
Model performance evaluation
The clinical model showed an AUC of 0.705 (95% CI: 0.617-0.794) in the training cohort and 0.658 (95% CI: 0.472-0.844) in the testing cohort. The radiomics model based on LightGBM demonstrated improved performance with AUCs of 0.840 (95% CI: 0.775-0.905) and 0.716 (95% CI: 0.537-0.894) in the respective cohorts. The combined model, integrating both clinical and radiomic features, achieved the highest diagnostic performance with AUCs of 0.878 (95% CI: 0.823-0.933) in the training cohort and 0.747 (95% CI: 0.582-0.918) in the testing cohort (Figure 4C and D). Statistical comparison using DeLong tests revealed significant differences between the combined model and both the clinical and radiomics models in the training cohort (p < 0.05) (Figure 4E). These results suggest that the combined model provides superior discriminative ability for predicting HCC pathological differentiation compared to either the clinical or radiomics model alone.
Clinical utility assessment
The calibration curves demonstrated good agreement between predicted and observed probabilities for the combined model in both cohorts (Figure 5A). Among the 3 curves shown, the combined model exhibited better calibration than either the clinical or radiomics model alone, suggesting reliable prediction performance.
Figure 5
Performance evaluation and nomogram drawing of prediction models for pathological differentiation degree. A) Calibration curves comparing the agreement between predicted and observed probabilities in the training cohort for clinical, radiomics, and combined models. B) Decision curve analysis showing the net benefit of different models across various threshold probabilities. C) Nomogram integrating clinical and radiomics signatures for individualised prediction of hepatocellular carcinoma differentiation risk
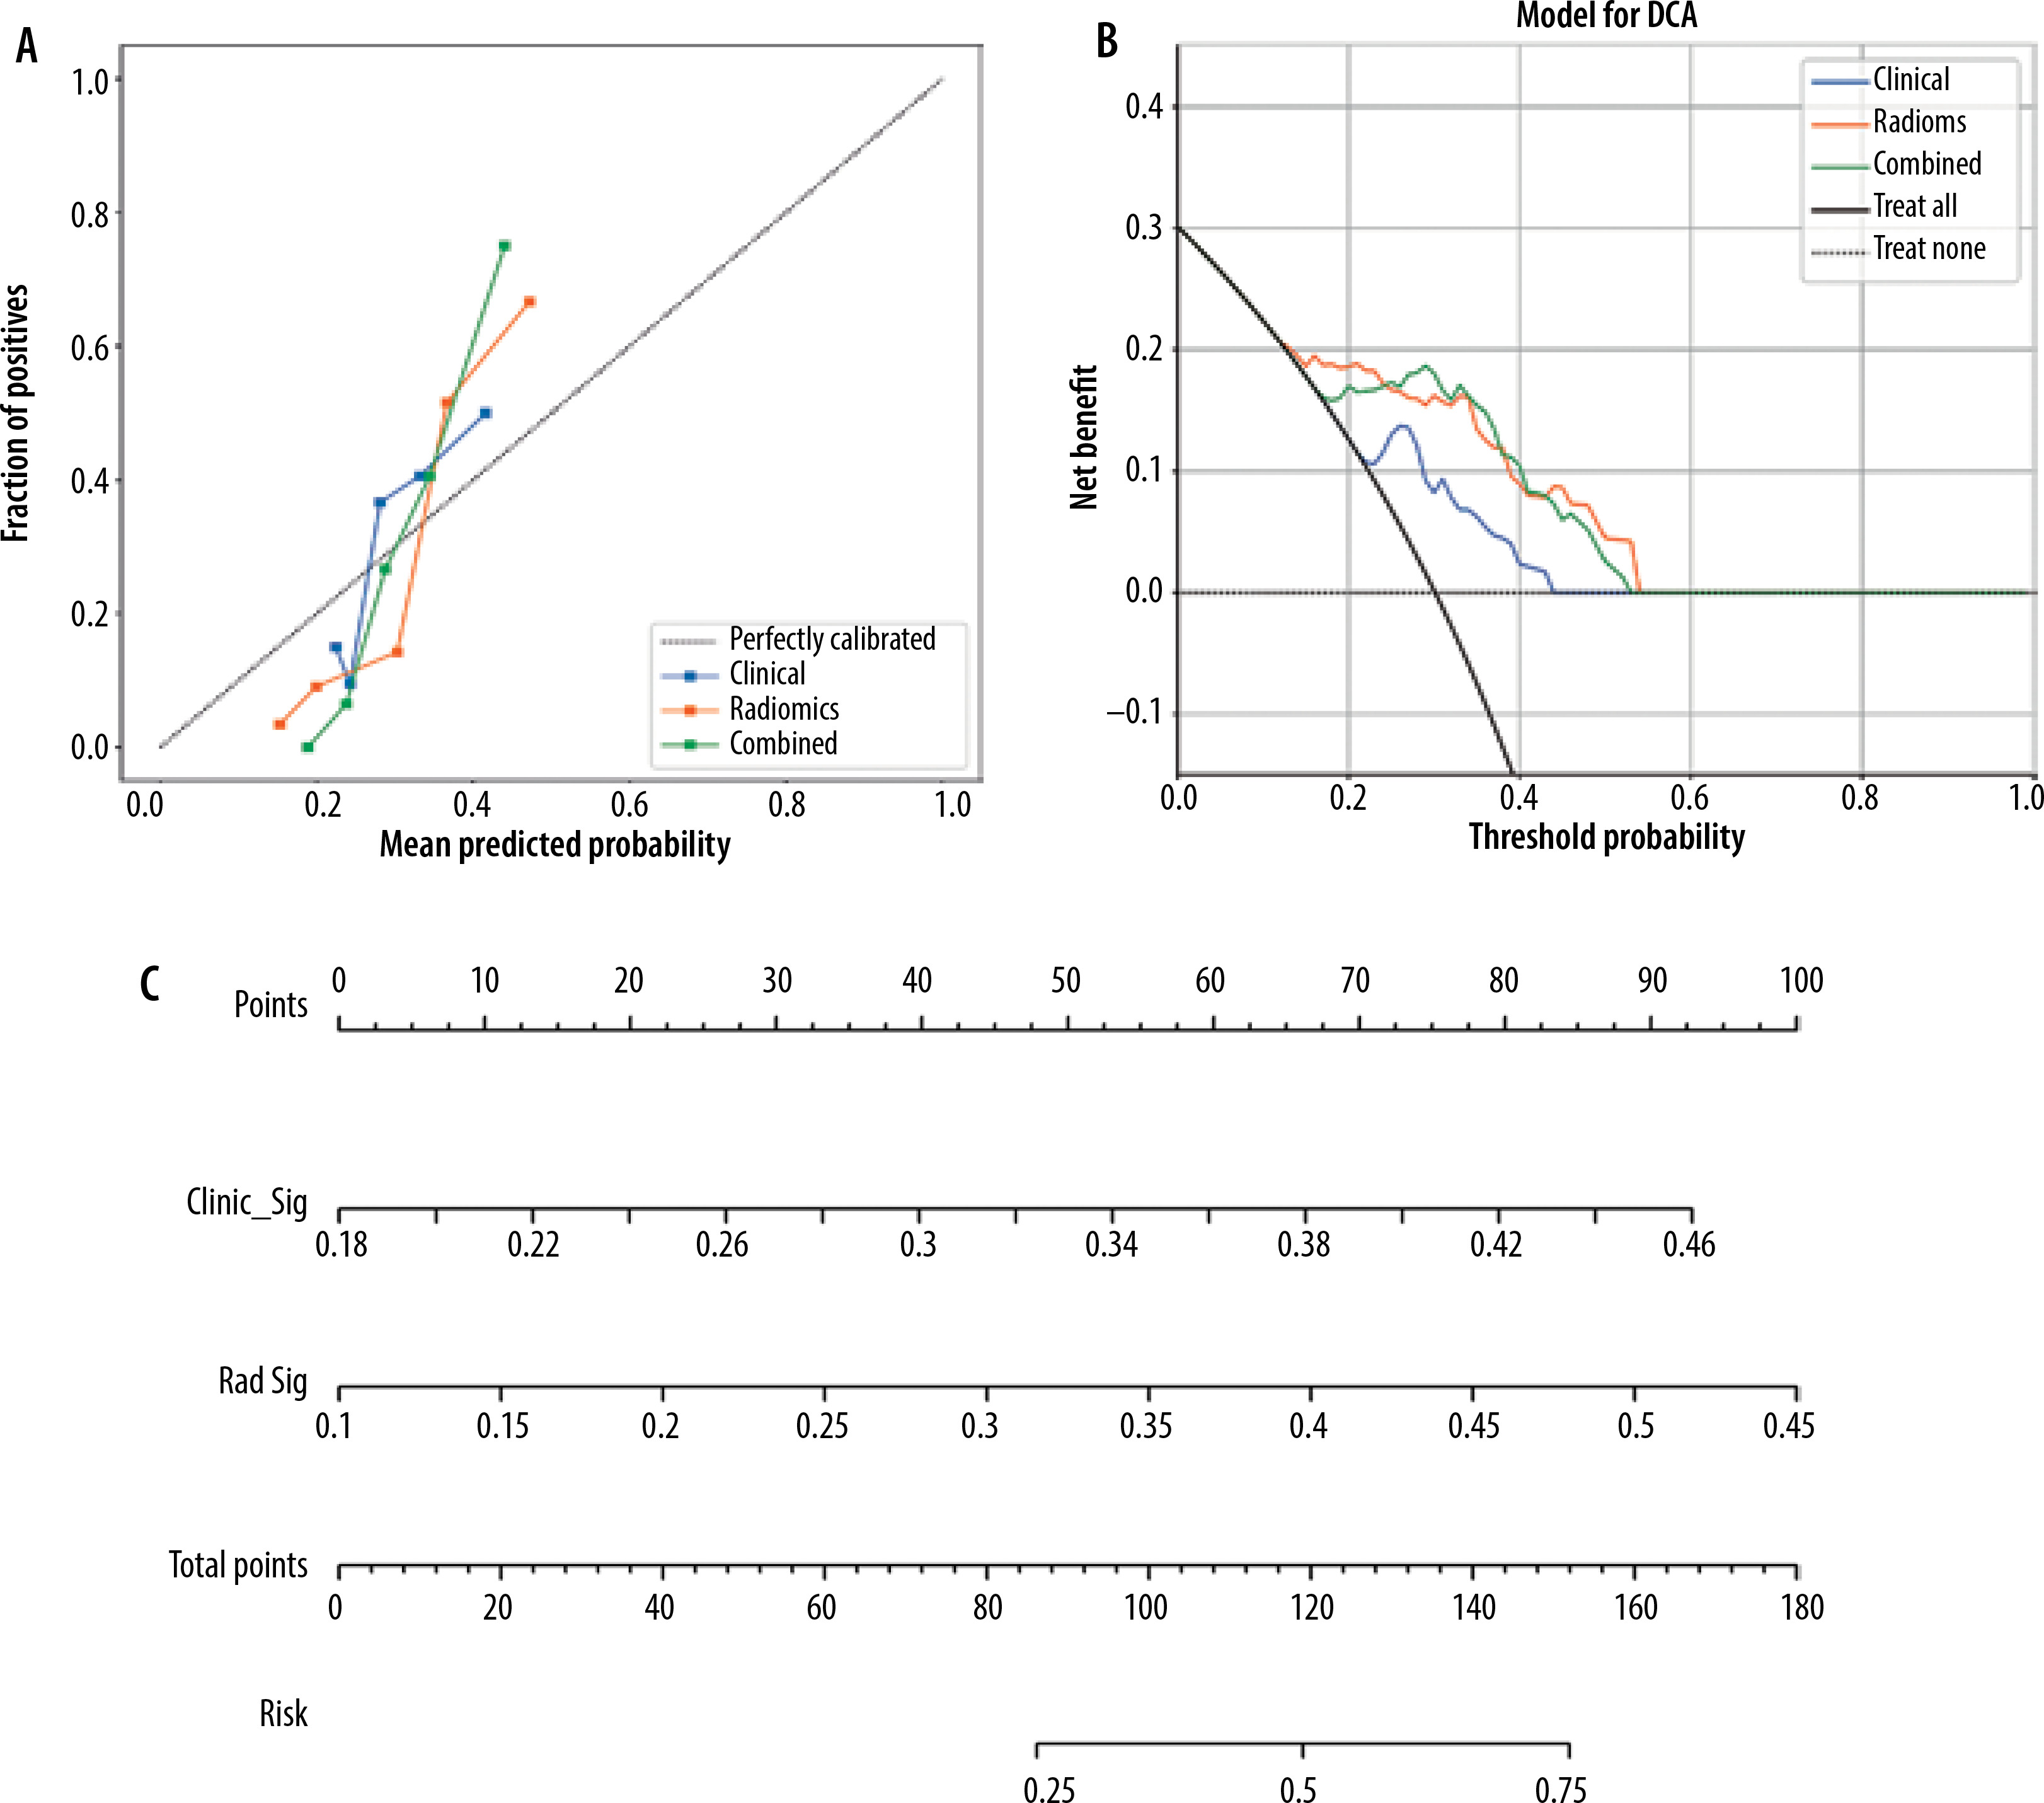
Decision curve analysis was performed to evaluate the clinical utility of different prediction models (Figure 5B). The net benefit was calculated by subtracting the proportion of false-positive results from true-positive results, weighted by the relative harm of unnecessary treatment versus missed treatment. The analysis showed that the combined model (green line) provided consistently higher net benefit compared to both the clinical model (blue line) and radiomics model (orange line) across a wide range of threshold probabilities (0.2-0.6). This indicates that the combined model would be more clinically useful than treating all patients as poorly differentiated (grey line) or non-poorly differentiated (black line).
To facilitate clinical application, a nomogram was constructed incorporating both clinical signature (Clinic_Sig) and radiomics signature (Rad_Sig) (Figure 5C). For individual patients, points are assigned for each signature based on their values (ranging from 0.18 to 0.46 for clinical signature and 0.1 to 0.55 for radiomics signature). The total points (0-180) can be converted to a corresponding risk probability (0.25-0.75) of poor differentiation. This visual tool provides clinicians with an intuitive method to estimate an individual patient’s risk of poor differentiation.
Discussion
This study developed and validated a novel combined model integrating CT radiomics features with clinical parameters for predicting HCC pathological differentiation. Our findings demonstrated superior predictive performance of the combined approach compared to individual clinical or radiomics models. The developed nomogram provides an intuitive tool for clinical implementation.
Our analysis revealed significant associations between BMI, CA153, and HCC differentiation. Elevated BMI has been previously identified as a risk factor for aggressive cancer subtypes, particularly in premenopausal breast cancer patients who show increased susceptibility to triple-negative and non-luminal subtypes [23,24]. The underlying mechanism may involve specific molecular pathways and adipokine interactions that enhance tumour aggressiveness in individuals with higher BMI [25]. Similarly, CA153, traditionally employed in breast cancer diagnosis with 63% sensitivity and 82% specificity [26], emerged as a significant predictor in our study. This finding aligns with established correlations between poor differentiation and increased tumour aggressiveness [5].
The clinical model, incorporating only BMI and CA153, demonstrated moderate predictive capability with AUCs of 0.705 (95% CI: 0.339-0.545) and 0.658 (95% CI: 0.353-0.685) in the training and testing cohorts, respectively. These results suggest potential limitations of clinical parameters alone in characterising HCC biological features [27]. Further investigation of the molecular mechanisms underlying these associations through in vivo and in vitro studies may provide additional insights into HCC development and progression.
Radiomics represents an emerging field in medical imaging analysis that extracts quantitative features through mathematical algorithms to enhance diagnostic accuracy. The integration of machine learning (ML) algorithms with radiomics features enables the development of predictive models capable of capturing tumour heterogeneity at the microscopic level [21,28]. In our study, we initially extracted 1834 radiomics features from CT images, encompassing various categories such as first-order statistics, shape-based features, and texture parameters. Through careful dimensionality reduction, 5 key features were ultimately selected for model construction.
To ensure robust model development, we evaluated 6 different ML classifiers for predicting HCC pathological differentiation. The LightGBM algorithm emerged as the optimal classifier, demonstrating superior performance with AUCs of 0.840 (95% CI: 0.775-0.905) and 0.716 (95% CI: 0.537-0.894) in the training and testing cohorts, respectively. These results present interesting contrasts with previous research. For instance, Chen et al. [29] reported optimal performance using SVM classifiers with portal venous phase images, while Hu et al. [30] achieved better results using LR classifiers, with AUCs of 0.75 and 0.70 for training and testing cohorts, respectively. The variation in classifier performance across studies can be attributed to several technical factors, including differences in CT scanning parameters (such as slice thickness and contrast enhancement timing) and reconstruction algorithms [31].
Our comprehensive analysis revealed that classifier performance is inherently dependent on the specific characteristics of the input data, suggesting that no single classifier universally outperforms others. This observation supports our strategy of implementing multiple classifiers for model development because it allows for optimal algorithm selection based on specific dataset characteristics. The successful integration of extensive radiomic features with multiple ML classifiers in our study not only improved the accuracy of HCC differentiation prediction but also demonstrated the potential of radiomics as an advanced diagnostic tool. This approach provides valuable insights into the development of more accurate and robust predictive models in radiomics research.
Finally, the combined clinical-radiomics model, integrating BMI, CA153, and radiomic features, demonstrated superior predictive performance compared to individual models, achieving AUCs of 0.878 (95% CI: 0.823-0.933) and 0.747 (95% CI: 0.582-0.912) in the training and testing cohorts, respectively. Different from the research of Li et al. [20] and Liu et al. [32], we integrate clinical and radiomics, which can improve the prediction performance of the model, better reflect the reliability of radiomics technology, and at the same time promote the development of machine learning.
Applications in medicine. We then drew this combined model into a visual nomogram, which can more intuitively display the relationship between clinical features and radiomics feature scores and HCC pathological differentiation. DCA of the combined model showed that for HCC patients with predicted pathological differentiation, the combined model provided the best benefit within a given threshold probability range with better clinical benefit. The potential to accurately predict pathological differentiation before surgery and improve individualised clinical diagnosis of HCC differentiation is of great significance to assist clinicians in formulating more accurate treatment plans in a timely manner.
Our study has several limitations that should be addressed in future studies: 1) The single-centre retrospective design and small sample size may introduce selection bias. Future studies should include multicentre data to validate and expand the generalisability of the results. 2) Manual delineation of original lesion boundaries may not completely avoid errors in poorly defined tumours. Advanced segmentation algorithms could improve this aspect in future research. 3) Our study only analysed the poorly differentiated group and the non-poorly differentiated group, and subsequent experiments hope to find better methods to predict the pathological differentiation of high, medium, and low hepatocellular carcinoma. To address these limitations and further validate our findings, we are planning a prospective, multicentre study that will include more HCC patients, incorporate more radiomics features, and add an external validation model.
Conclusions
This study demonstrates that a machine learning-based CT radiomics model combining clinical and imaging features can effectively predict HCC pathological differentiation. The model’s non-invasive nature and promising predictive performance show its potential value as a preoperative assessment tool. The developed nomogram provides clinicians with an intuitive method for estimating differentiation risk, which could facilitate treatment planning and potentially improve patient outcomes.