Introduction
Coronary computed tomography angiography (CCTA) is a widely accepted non-invasive tool for assessing coronary artery disease (CAD), particularly in low to intermediate-risk patients [1]. Due to its high sensitivity, CCTA is endorsed by the European Society of Cardiology (ESC) guidelines as a primary diagnostic modality for CAD [2]. However, CCTA’s inability to assess the haemodynamic significance of coronary stenosis, which is crucial for evaluating its impact on myocardial perfusion, remains a significant limitation [3]. This often leads to unnecessary invasive coronary angiography (ICA), which is a concern because approximately 60% of ICAs reveal no obstructive CAD [4]. Additionally, CCTA may be less effective in cases with severe coronary calcifications, bypass grafts, or stents [5-7].
Dynamic coronary computed tomography perfusion (CTP) can be integrated into the diagnostic pathway to address these limitations. Combined with CCTA, CTP provides both anatomical and functional insight, offering a more comprehensive assessment of CAD. This approach has demonstrated diagnostic accuracy comparable to other established non-invasive modalities such as positron emission tomography (PET), single photon emission computed tomography (SPECT), and magnetic resonance imaging (MRI) [8]. In complex cases, such as those with severe coronary calcifications, CTP significantly improves diagnostic accuracy in detecting myocardial ischaemia. Notably, the CCTA-CTP-guided approach results in a significantly lower rate of ICA compared to CCTA alone (48.3% vs. 30.8%, p = 0.006) [9], highlighting its potential as an effective gatekeeper to invasive procedures [10].
This article presents preliminary data on dynamic CTP collected at our institution. We describe patient preparation, scanning protocols, and methods of acquiring, reconstructing, and analysing images. We present our findings and discuss the implications of integrating dynamic CT myocardial perfusion into the diagnostic workflow. Finally, we outline future research directions to further validate and optimise the use of CTP in CAD diagnosis and management.
Material and methods
Study population
Data were collected from 36 adults presenting to the University Hospital of Wroclaw between October 2021 and September 2024.
The study cohort included symptomatic patients with either a confirmed diagnosis of CAD or a low to intermediate pretest probability of obstructive CAD. All participants underwent dynamic CTP using a whole-heart coverage CT scanner (Revolution Apex CT, GE Healthcare, Milwaukee, Wisconsin) for clinical indications (Figure 1).
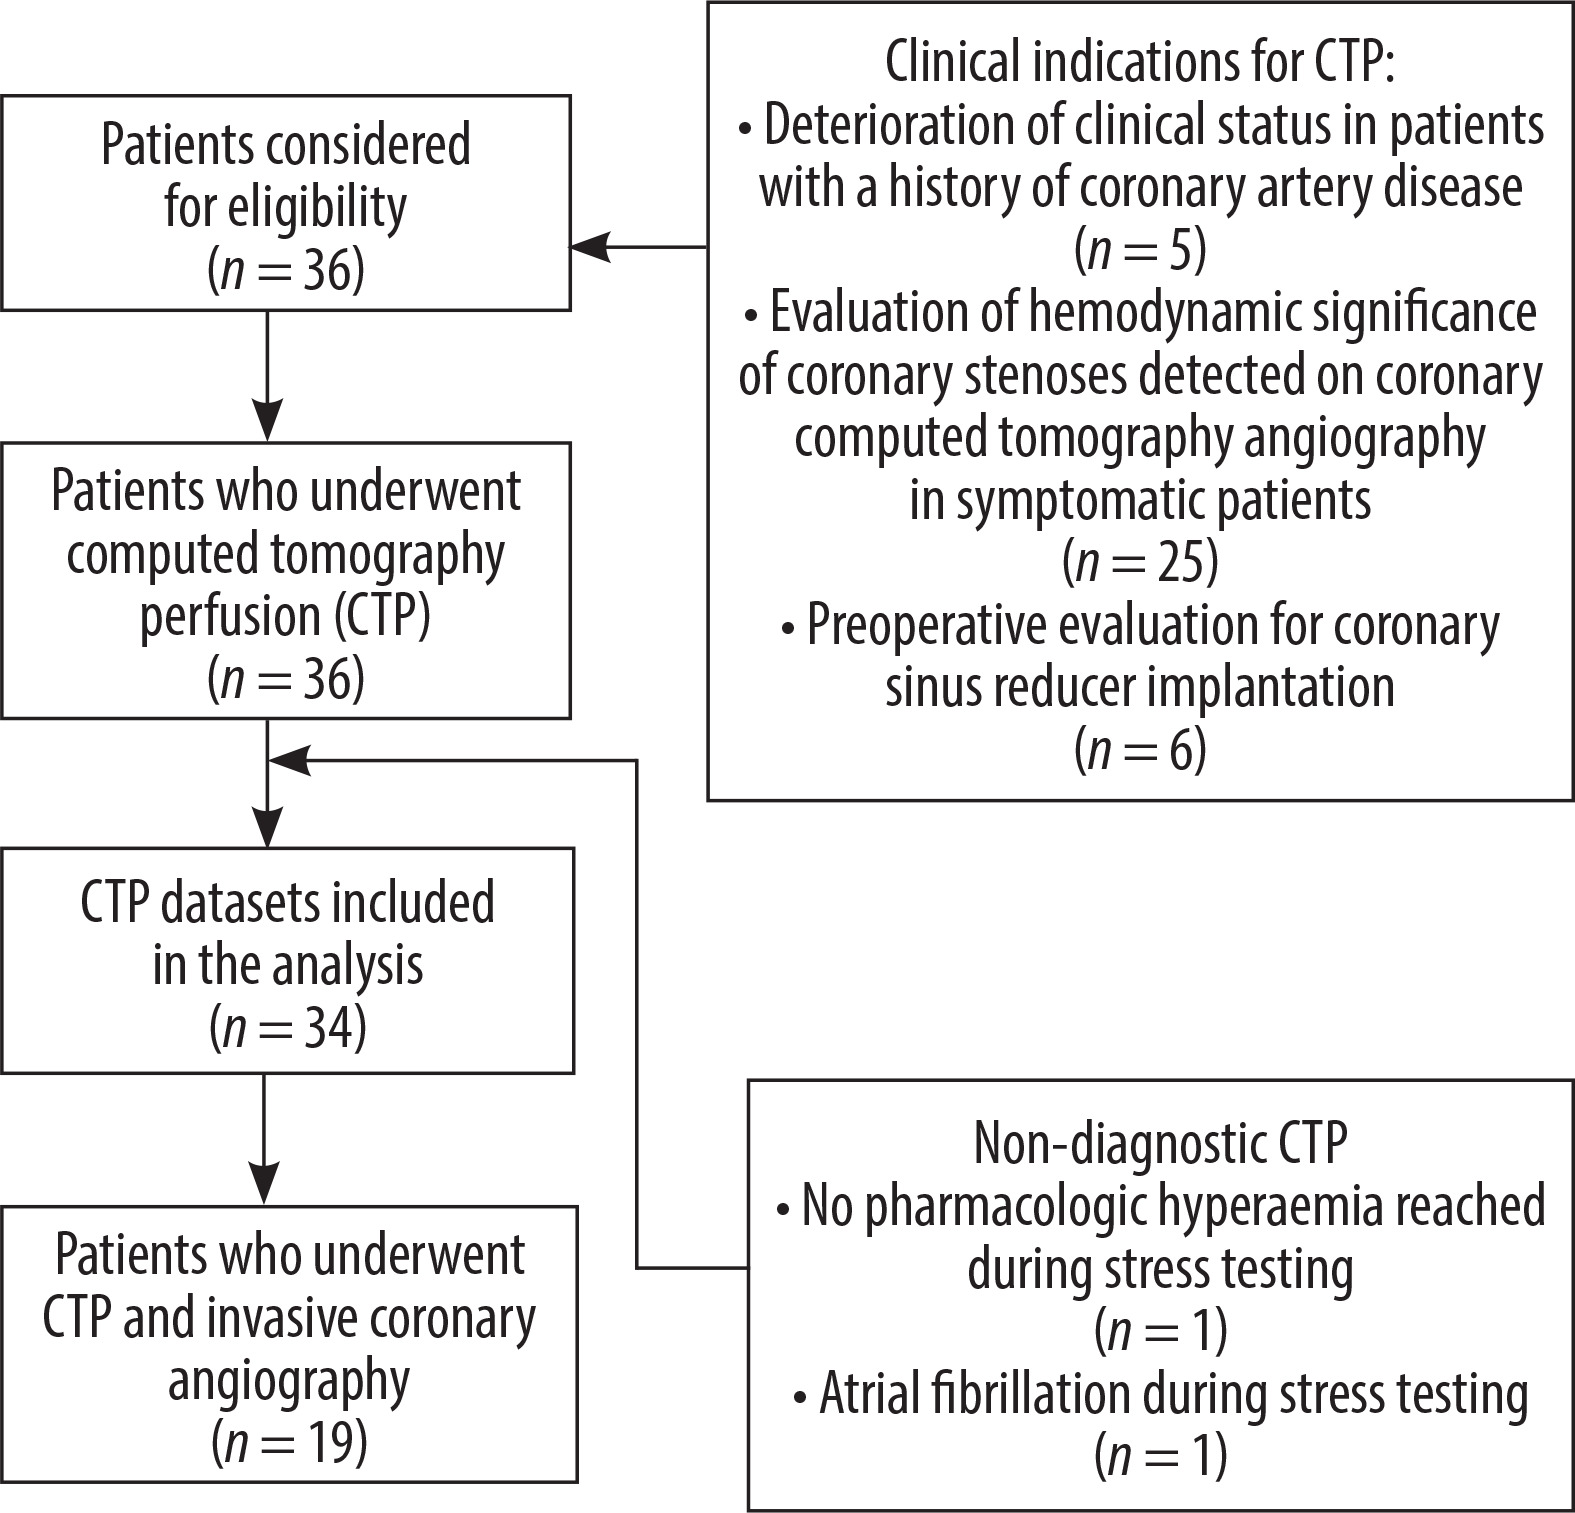
Of the 36 patients enrolled, 24 underwent CCTA at our institution. In 10 cases, CCTA datasets were acquired externally and therefore excluded. Nineteen patients underwent both comprehensive cardiac CT (CCTA and CTP) and ICA within a mean interval of 1 month (range: 0-3 months) and were included in the final analysis.
Inclusion criteria included adult age (≥ 18 years), absence of contraindications to diagnostic agents or procedures (such as regadenoson and iodinated contrast agents), and provision of informed written consent.
Exclusion criteria were acute coronary syndrome, haemodynamic instability or irregular heart rhythm during the examination, allergy to regadenoson or contrast medium, contraindications to CT, and consuming caffeine, theophylline, or chocolate within 12 hours before the diagnostic procedure. Two patients were excluded from the final analysis: one for failing to achieve pharmacologic hyperaemia as indicated by an inadequate heart rate response during stress testing and the other for developing atrial fibrillation. As a result, 34 patients were qualified.
This study was approved by the local Ethics Committee of the Wroclaw Medical University and performed in accordance with the Declaration of Helsinki and Good Clinical Practice.
Stress dynamic CT perfusion protocol
Image acquisition
CTP was performed on a Revolution Apex 256-slice CT scanner (GE Healthcare, Milwaukee, Wisconsin) with a 16-cm wide detector. The scanner acquires multiple sequential data sets that cover the entire heart from base to apex. Vasodilation was induced by administering a fixed dose of regadenoson (400 μg/5 ml; GE Healthcare, USA) as a bolus injection over 5-10 seconds using a prefilled syringe. The CTP protocol commenced with a low-dose, non-contrast scan.
After a delay of 50-120 seconds, 0.7 ml/kg of contrast (Visipaque 320 mg/ml, GE Healthcare, Oslo, Norway) was administered at a rate of 5 ml/s via an antecubital intravenous line, followed by a 50 ml saline flush at the same rate. Image acquisition was initiated simultaneously with contrast administration, using bolus tracking in the aortic root to optimise timing.
Prospective electrocardiogram (ECG) gating was employed, with dynamic acquisition triggered during the systolic phase (30-40% of the R-R interval). A series of 20 to 25 rapid CT scans were performed to capture the wash-in and wash-out phases of the contrast within the myocardium. CTP exposure parameters were adjusted according to patient weight (100 kV and 150 mA for body mass index [BMI] < 30 kg/m2; 120 kV and 150 mA for BMI 30-35 kg/m2). The technical details of the CTP acquisition protocol are shown in Table 1.
Table 1
Technical aspects of dynamic computed tomography perfusion image acquisition
Patients were monitored continuously throughout the procedure and instructed to maintain minimal, shallow breathing to reduce respiratory motion artifacts, optimise contrast opacification, and ensure that image acquisition coincided with peak arterial enhancement of the contrast agent in the myocardium.
Image reconstruction and analysis
Following image acquisition, the CTP datasets were transferred to a dedicated post-processing workstation (Advantage Workstation 4.7, GE Healthcare) via a picture archiving and communication system (PACS). All images were reconstructed using deep learning image reconstruction (DLIR; TrueFidelity, GE HealthCare) with high-strength settings.
Post-processing was conducted using semi-automated methods, typically requiring 15 to 30 minutes for completion. Manual adjustments were made to optimise both image quality and diagnostic accuracy, including the following:
phase selection for stress imaging: the stress phase with the most pronounced contrast enhancement in the left ventricle and visible contrast in the right ventricle was selected;
setting left ventricular axes: horizontal and vertical lines were aligned in both 2-chamber and 4-chamber views to ensure that the point of intersection was centred within the short axis of the left ventricle. Left ventricular myocardium was verified to fit within the span of the long axis;
contouring of the ventricle: multiple short-axis views of the left ventricle, spanning from base to apex, were utilised to manually adjust the ventricular contours (endocardial and epicardial borders) to delineate the myocardium while excluding extraneous regions accurately.
The next step was to analyse the time-attenuation curve. The contrast inflow time-density curve was used to assess changes in myocardial attenuation over time. The peak value of this curve was identified to determine the optimal time frame for further analysis. For myocardial blood flow (MBF) quantification, an arterial input function was sampled at the level of the ascending aorta, where the coronary arteries originate.
The reconstructed images were presented in short-axis views (apical, midventricular, and basal slices) and 2-, 3-, and 4-chamber long-axis views. MBF quantification was performed by assessing blood flow to the myocardium based on the time-attenuation curve for the designated region of interest. MBF results were reconstructed into a series of colour-coded images with a slice thickness of 3.0 mm and displayed using a 17-segment colour-coded perfusion map. To determine MBF per vessel territory, a region of interest (comprising ≥ 0.5 cm3 of subendocardial myocardium) was identified on the MBF polar maps for each coronary territory.
Normal stress MBF typically appears red, while ischaemic regions, associated with coronary artery disease, fall below 100 ml/100 g/min and are depicted in blue (Figures 2 and 3).
Figure 2
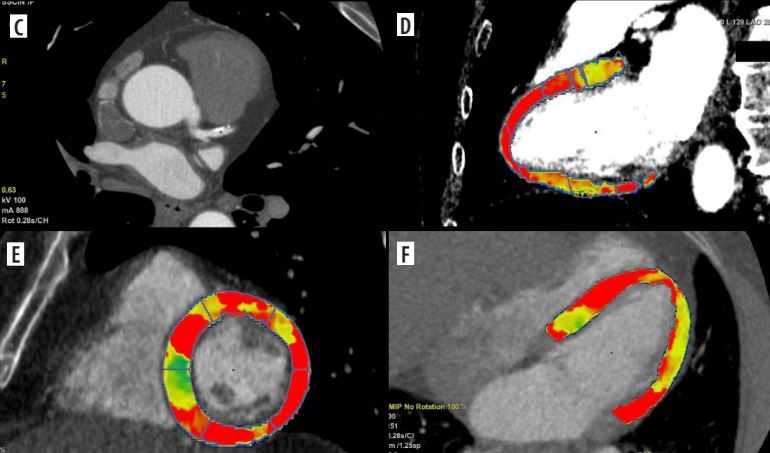
Coronary computed tomography angiography (CCTA) and dynamic computed tomography perfusion (CTP) scans from a 58-year-old male with a history of reduced exercise tolerance and shortness of breath. The patient underwent a comprehensive CT evaluation, including calcium scoring, CCTA, and dynamic stress CTP. The calcium score was 228 AU (80 mm3), consistent with moderate calcification (CAC-DRS A2 N2). Coronary CT angiography identified a 60-70% stenosis in the proximal-to-mid left anterior descending artery (LAD) (A-C). Dynamic stress CTP with regadenoson revealed reduced blood flow in the basal anterior and inferior-septal segments; mid anterolateral, inferolateral, inferior, and septal border zones; and the apical lateral segment. These findings indicated stress-induced ischaemia, predominantly affecting the LAD territory (D-F). Invasive coronary angiography confirmed 60–70% stenosis in the proximal-to-mid LAD. Based on the CTP findings of significant ischaemia, the patient was deemed suitable for ad hoc PCI targeting the LAD stenosis. Dynamic CTP Color-coding: Normal stress myocardial blood flow (MBF) is shown in red, and ischaemic regions (MBF < 100 ml/100 g/min) are depicted in blue
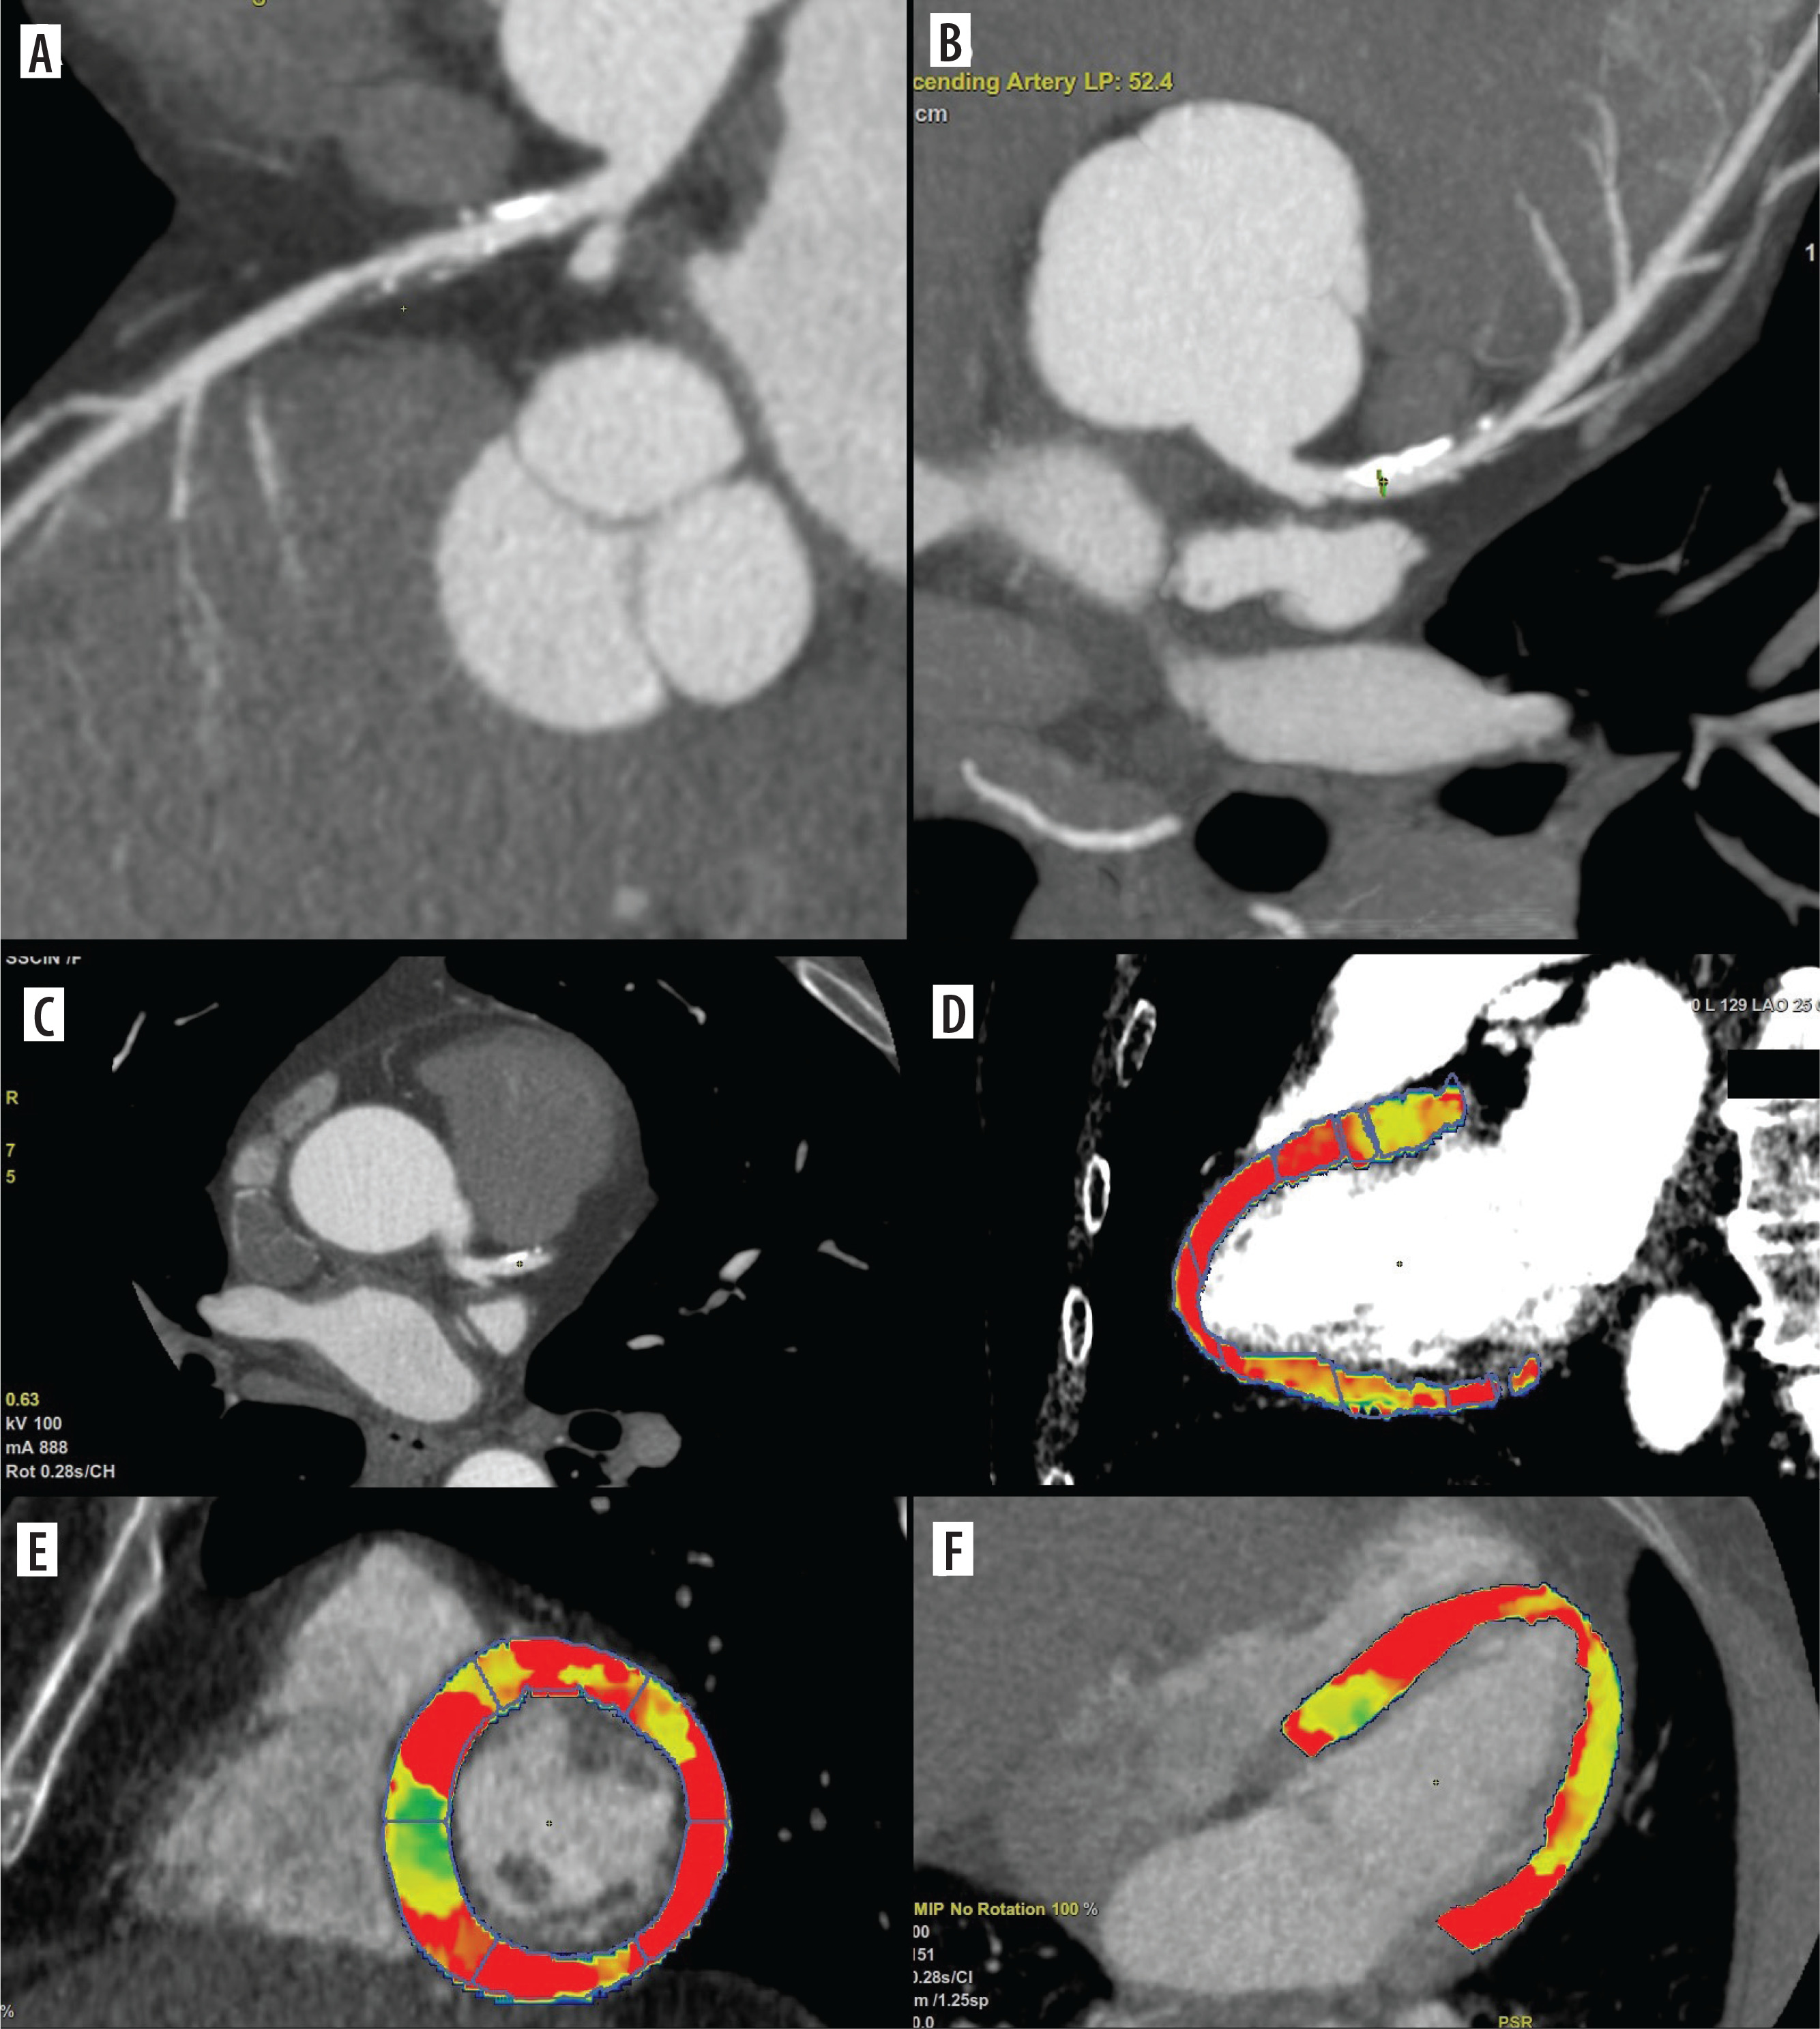
Figure 3
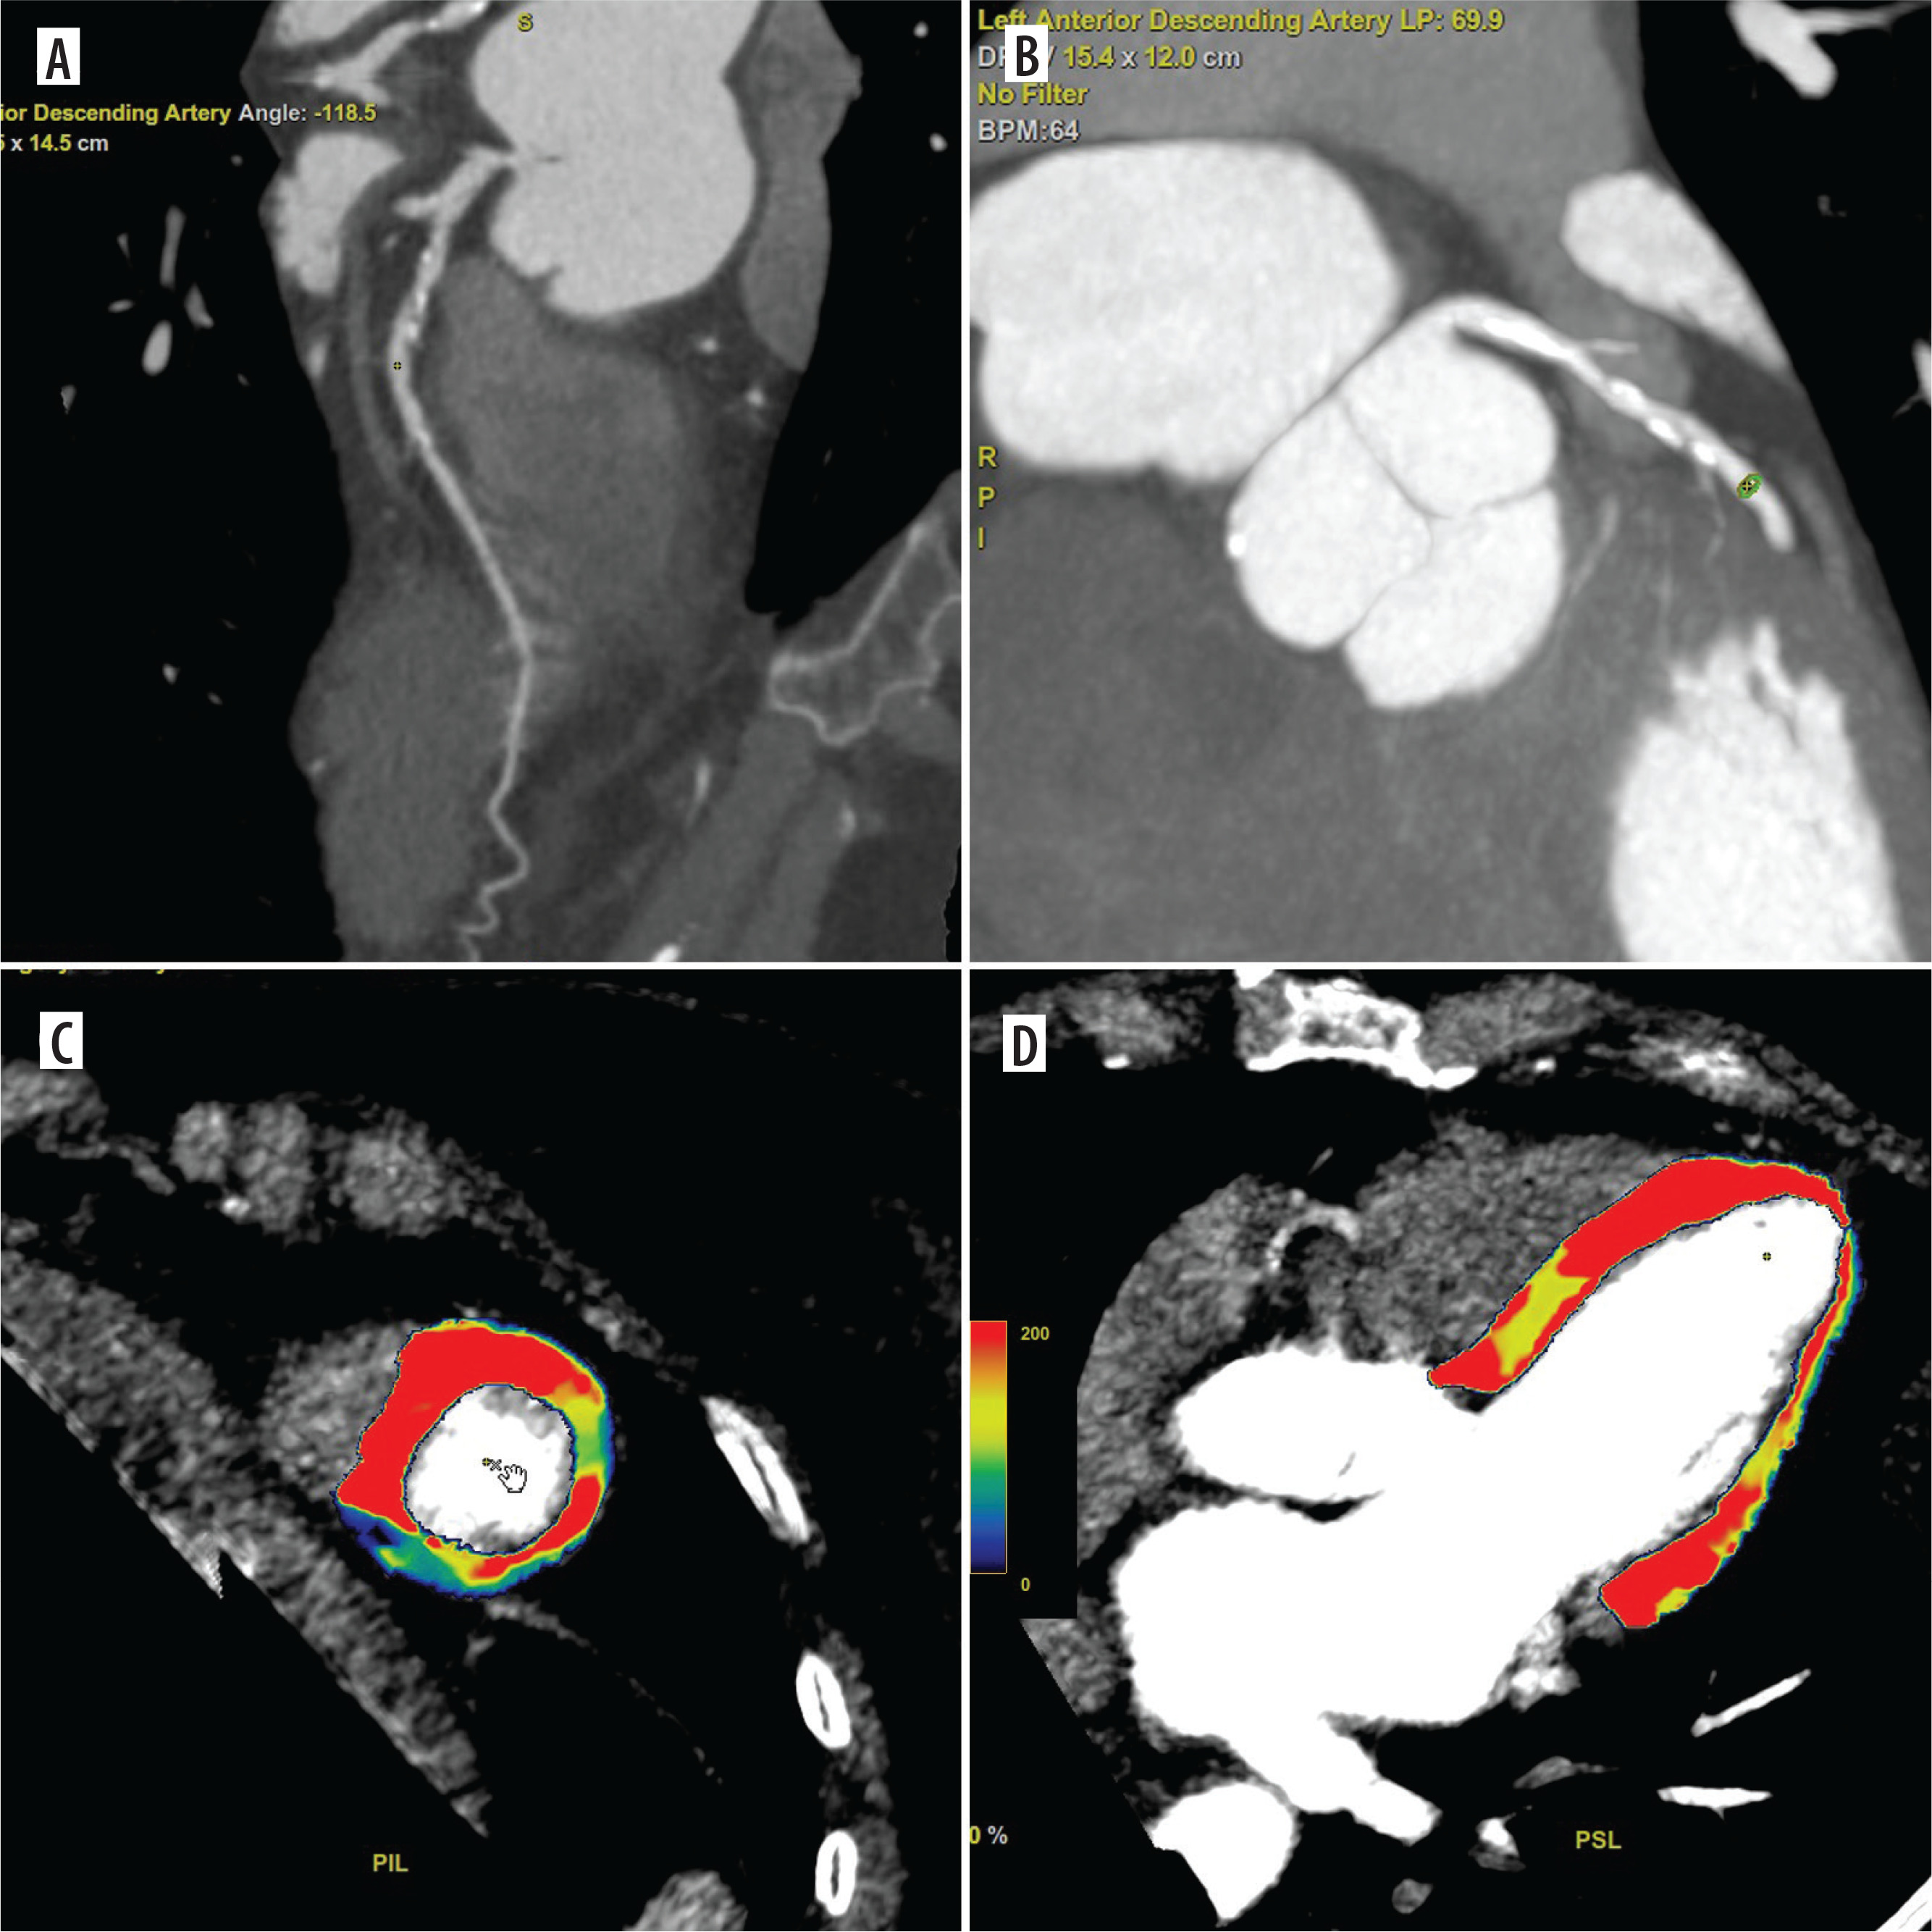
Coronary computed tomography angiography (CCTA) and dynamic computed tomography perfusion (CTP) scans from a 64-year-old female with non-specific chest discomfort and mild exercise intolerance. The patient underwent a comprehensive CT evaluation, including calcium scoring, CCTA, and dynamic stress CTP. CCTA revealed 30% stenosis in the left main (LM) and 50-60% stenosis in the left anterior descending artery (LAD) (A, B). Dynamic stress CTP with regadenoson showed reduced blood flow in the mid-anterior segment, apical anterior segment, and the border zone between the basal and mid-septal anterior segment (C, D). Based on the confirmed ischaemia, the patient was referred for invasive coronary angiography (ICA), which revealed 30% stenosis in the LM and a myocardial bridge in the LAD. The patient was deemed suitable for conservative management. Dynamic CTP Color-coding: Normal stress myocardial blood flow (MBF) is shown in red, and ischaemic regions (MBF < 100 ml/100 g/min) are depicted in blue
Although thresholds for hyperaemic MBF indicating significant stenosis remain unestablished, prior studies suggest 75-156 ml/100 g/min [11-15]. For consistency in our practice, a < 100 ml/100 g/min threshold is used to identify perfusion defects.
Stressor agent
Regadenoson, a selective A2A adenosine receptor agonist, is associated with a favourable side-effect profile, characterised by a reduced incidence of bronchoconstriction and hypotension. Its dosing is independent of patient weight or renal function, and it is administered as a rapid bolus injection, thereby eliminating the need for continuous infusion. Its rapid onset and short half-life further enhance procedural efficiency and expedite patient recovery [16,17].
In Poland, the use of regadenoson as a pharmacological stress agent is notably constrained by its high cost relative to traditional agents. This significant cost disparity limits its adoption within the public healthcare sector, particularly as the National Health Fund (NFZ) does not provide reimbursement for its use. Consequently, this financial barrier impedes both widespread clinical application and further research into its potential benefits [18].
Radiation exposure
The mean dose-length product for the CT-MPI protocol in this study was 391.5 mGy · cm2 (range: 312-435 mGy · cm). The effective dose (ED) was calculated using a conversion factor (k = 0.014 mSv/mGy · cm), yielding a mean effective dose of 5.48 ± 0.61 mSv (range: 4.37-6.09 mSv).
Radiation doses for dynamic CTP studies can vary depending on the protocol and CT system, with average effective doses ranging from 4.6 to 12.8 mSv [10,13,14,19-30].
Newer-generation CT scanners are designed to minimise radiation exposure while providing optimal image quality.
Coronary CT angiography acquisition
All datasets were acquired using a 256-slice Revolution Apex CT scanner (GE Healthcare, Chicago, IL, USA). Scans were performed with an axial acquisition technique, and ECG gating was applied to synchronise the image capture with the cardiac cycle. Image reconstruction utilised a focused field of view ranging from approximately 180 to 220 mm, optimised to enhance spatial resolution for coronary artery visualisation and to encompass the heart and proximal great vessels. Detailed acquisition parameters are summarised in Table 2.
Table 2
Scanning parameters for computed tomography angiography
Coronary CT angiography reconstruction and analysis
Following image acquisition, reconstruction was performed using a deep learning-based algorithm (TrueFidelity, GE Healthcare), which was trained on high-quality filtered back projection (FBP) images. The high-strength Deep Learning Image Reconstruction (DLIR-H) setting was selected for this process. All data were subsequently transferred to a specialized post-processing system (Advantage Workstation 4.7, GE Healthcare) via the PACS platform, where curved planar reconstructions were applied to each dataset. The datasets were evaluated by a specialised radiologist and reviewed in consultation with a cardiologist. The results were reported using the Coronary Artery Disease Reporting and Data System (CAD-RADS) classification. Significant coronary stenosis was defined as atherosclerotic plaquing in epicardial coronary arteries > 50%.
Invasive coronary angiography and functional assessment
ICA was performed by an experienced interventional cardiologist using a dedicated X-ray angiography system. Vascular images were acquired at a frame rate of 15 frames per second. A nonionic contrast agent (Omnipaque 350), unfractionated heparin, and intra-arterial nitroglycerin were administered during the procedure. The mean total radiation dose was 447 mGy.
FFR and DFR were measured using a PressureWire™ X (Abbott Vascular), with hyperaemia induced by intracoronary administration of adenosine (30 or 60 μg).
Haemodynamically significant stenosis was defined as ≥ 70% luminal narrowing in a major epicardial vessel, ≥ 50% in the left main coronary artery, or functionally significant if the FFR was ≤ 0.80 or the diastolic FFR (DFR) was ≤ 0.89.
Statistical analysis
Statistical analysis was performed using STATISTICA 13 (StatSoft, Tulsa, Oklahoma, USA). Due to the limited cohort size, the preliminary analysis primarily focuses on assessing the diagnostic performance of CTP-derived perfusion defects, using ICA and FFR as reference standards. Performance metrics, including sensitivity and specificity, are reported.
As the cohort expands, more advanced analyses will be conducted to evaluate the diagnostic performance of CTP alone, CCTA alone, and their combined approach, with ICA and FFR serving as reference standards.
Results
Baseline characteristics
A total of 34 patients were included in the analysis. Baseline characteristics are presented in Table 3.
Dynamic CTP: quantitative perfusion map evaluation – segment level analysis
Of the 578 myocardial segments quantitatively assessed across 34 datasets, 424 segments (73.3%) exhibited normal perfusion, whereas 154 segments (26.6%) were classified as hypoperfused. Among the hypoperfused segments, 28 demonstrated perfusion deficits indicative of prior myocardial infarction in the corresponding myocardial territories.
Dynamic CTP versus CCTA
The analysis revealed distinct patterns of correlation between coronary artery stenoses identified on CCTA and myocardial perfusion abnormalities detected by dynamic CTP. Concordant anatomical and perfusion abnormalities were observed in 14 patients (58.3%).
In one patient, a myocardial bridge corresponded with preserved perfusion. In 5 patients (20.8%), moderate stenoses were not associated with perfusion deficits. Conversely, 4 patients (16.6%) demonstrated perfusion abnormalities in the absence of significant anatomical stenosis.
Dynamic CTP versus ICA and FFR
Among the 19 patients who underwent both CTP and ICA, perfusion deficits were identified in 17. Concordant findings between CTP and ICA were observed in 10 patients (52.6%), while 7 (36.8%) demonstrated discordance. In the 2 patients without CTP-detected ischaemia, ICA confirmed the absence of haemodynamically significant stenosis. Using ICA as the reference, CTP yielded a sensitivity of 100% and a specificity of 22% for detecting functionally significant CAD.
Of these 19 patients, 10 underwent additional physiological assessment with FFR and diastolic flow reserve (DFR). In 4 cases, CTP identified perfusion abnormalities despite normal FFR/DFR values; in another 4, CTP findings were concordant with invasive functional assessment. In the 2 remaining patients without CTP-detected ischaemia, FFR and DFR were also within normal limits. The overall concordance between CTP and invasive functional testing was 60.0%. A detailed comparison is presented in Table 4.
Table 4
Comparison of dynamic stress CT perfusion and invasive angiography with FFR
Dynamic CTP and treatment strategy modifications
The reclassification rate, defined as the percentage of patients whose management plans changed based on CTP results, was 29.4% (10 of 34 patients). Specifically, 6 patients did not proceed to ICA, 2 underwent ad hoc revascularisation, and one received PCI despite normal FFR values. Conversely, conservative treatment was preferred over PCI in one case, resulting in clinical improvement.
A particularly illustrative case involved a 63-year-old male with a complex cardiovascular history who initially underwent ICA, which revealed an in-stent restenosis in the RCA and moderate stenosis in the LCx. Functional assessments using FFR and DFR indicated that the LCx lesion was haemodynamically insignificant (FFR = 0.98). As a result, PCI was performed on the RCA, while the LCx lesion was managed conservatively.
However, the patient experienced a periprocedural myocardial infarction followed by worsening clinical symptoms. Two weeks later, follow-up with CT-MPI revealed significant perfusion deficits in the LCx territory, despite ICA showing no haemodynamically significant stenosis. This finding prompted the decision to revascularise the LCx artery, leading to subsequent clinical improvement.
Discussion
Our study provides preliminary evidence supporting the clinical utility of dynamic CTP as a complementary modality to anatomical imaging in patients with suspected or known CAD. Specifically, dynamic CTP enabled segment-level quantification of myocardial perfusion and demonstrated potential for refining diagnostic accuracy and informing treatment strategies, particularly in cases with anatomically moderate or functionally ambiguous lesions.
A key observation in our cohort was the functional-anatomical discordance identified in a notable proportion of patients. Myocardial perfusion abnormalities were observed in 17% of patients despite the absence of significant stenosis on CCTA, while 21% of moderate stenoses on CCTA were not associated with functional impairment on CTP. These findings are consistent with prior literature emphasising the limited ability of anatomical imaging alone to predict lesion-specific ischaemia, as approximately 50% of obstructive lesions identified by CCTA or ICA do not result in ischaemia [31], while non-obstructive lesions may still cause ischaemia [32]. This discordance underscores the clinical utility of integrating functional assessment to enhance risk stratification, particularly in patients with intermediate-risk profiles or ambiguous anatomical findings.
The comparison of dynamic CTP with ICA and invasive physiological assessment using FFR and DFR further underscores the added diagnostic value of dynamic CTP. In the subset of patients undergoing ICA, CTP demonstrated a sensitivity of 100% and a specificity of 22% for detecting hemodynamically significant CAD. This performance falls short relative to broader findings, where CTP sensitivity reaches 93% and specificity is 82%, comparable to MRI and PET at the patient level [8]. The inclusion of subtle perfusion abnormalities, which may not necessarily reflect ischaemia, probably contributes to the reduction in specificity. Moreover, the reduced specificity may be related to the threshold used to define perfusion deficits. Therefore, further research is warranted to explore alternative threshold values that optimise alignment with clinical and physiological outcomes.
The observed discordance between CTP and FFR/DFR in 40% of patients who underwent invasive physiological testing highlights the complexity of CAD assessment and the limitations of relying on a single diagnostic standard. These discrepancies may be attributed to differences in stress-induction mechanisms, microvascular dysfunction undetectable by FFR, or temporal variations between imaging procedures [33,34].
Dynamic CTP also had a significant impact on clinical management decisions, with a reclassification rate of 29.4%. Based on CTP findings, 6 patients avoided unnecessary ICA, 2 underwent ad hoc revascularization, and one received PCI despite normal FFR values. In another case, conservative management was chosen over intervention, leading to clinical improvement. Notably, a patient in whom ICA and FFR failed to detect a haemodynamically significant lesion in the LCx territory was subsequently identified by CTP, which prompted successful revascularisation.
This illustrates the potential of CTP to detect ischaemia in cases of angiographic or physiological underestimation, possibly due to diffuse or microvascular disease.
Dynamic CTP offers distinct advantages over static perfusion imaging, providing reproducible MBF measurements and allowing time-resolved evaluation of myocardial perfusion. Unlike single-shot, visually interpreted static protocols, dynamic CTP supports objective quantification and the detection of balanced ischaemia in multivessel disease. While further studies in larger populations are warranted, our findings are consistent with prior reports that demonstrate the incremental diagnostic and prognostic value of dynamic CTP beyond CCTA alone.
Study limitations
Several limitations should be acknowledged. First, the single-centre design and relatively small sample size limit the generalisability of our findings and may reduce statistical power. Second, although CTP was interpreted by an experienced cardiac radiologist in consensus with a cardiologist, interobserver variability was not assessed, which may impact reproducibility. Third, the heterogeneity of the study population and the absence of a standardised imaging protocol, particularly the fact that not all patients underwent both CCTA and ICA, may have influenced concordance estimates and introduced selection bias. Finally, the observed low specificity of CTP compared with ICA underscores the need to refine MBF thresholds and standardise interpretation criteria. Future prospective studies with larger cohorts are warranted to validate these findings and to determine the prognostic value of MBF quantification in predicting long-term clinical outcomes.
Conclusions
Our findings support the integration of dynamic CTP into the non-invasive diagnostic pathway for coronary artery disease, particularly in patients with inconclusive anatomical findings or discordant functional assessments. By enabling simultaneous anatomical and functional evaluation within a single imaging modality, dynamic CTP can enhance risk stratification, guide individualised treatment decisions, and reduce unnecessary invasive procedures. However, given the limited sample size and single-centre design, these results should be considered preliminary and may not be generalisable to broader clinical populations. Further validation in larger, potentially multicentre cohorts is essential to establish standardised acquisition and interpretation protocols and to assess the prognostic significance of quantitative myocardial perfusion metrics in routine clinical practice.
Future research plans for dynamic CT myocardial perfusion imaging
Future research will assess the diagnostic performance of CCTA alone, dynamic CTP alone, and the combined use of both modalities, with ICA and invasive FFR serving as the reference standard. Key diagnostic metrics, including sensitivity, specificity, positive and negative predictive values, and diagnostic accuracy, will be evaluated at both the per-vessel and per-patient levels. To enhance the analysis and reduce variability, the patient cohort will be expanded and its heterogeneity minimised. Secondary analyses will focus on the reclassification rate, assessing how CTP alters initial management plans. Efforts will also aim to establish MBF cut-off values that differentiate ischemic from non-ischemic myocardial regions. Additionally, CTP protocol optimization will include refining acquisition parameters and reconstruction algorithms to improve imaging precision. The safety of CTP will be further evaluated, with a focus on minimising radiation exposure and optimising contrast media to ensure patient safety while enhancing image quality. This comprehensive approach will be pivotal in validating CTP as a reliable diagnostic tool for CAD and improving clinical outcomes.