Introduction
Multiple sclerosis (MS) is a complex neurological disorder characterised by the formation of demyelinating plaques in the central nervous system [1,2]. The ability to differentiate between active and non-active MS lesions is crucial for proper disease monitoring, treatment planning, and prognosis assessment [3]. Traditional magnetic resonance imaging (MRI) sequences, while valuable for MS diagnosis, often present challenges in accurately distinguishing lesion activity status based on visual interpretation alone [4]. Recent advances in computational imaging analysis, particularly in the field of radiomics, have opened new avenues for extracting quantitative imaging features (e.g. intensity, texture, shape) that numerically describe lesion properties beyond visual assessment [5]. Radiomics enables high-throughput extraction of quantitative imaging features (e.g. intensity, texture, shape), which, when combined with machine learning algorithms like support vector machines and random forests, can capture subtle patterns beyond visual assessment, improving diagnostic accuracy in MS and other conditions [6,7]. These radiomic features provide a rich dataset for machine learning algorithms to analyse complex imaging patterns [8]. Recent studies have demonstrated the success of various machine learning algorithms, including support vector machines (SVM), random forests, and deep neural networks, in analysing these radiomic features for MS lesion detection and classification [9-12]. These computational approaches have shown particular promise in capturing subtle imaging patterns that may elude conventional radiological assessment. Combined with sophisticated machine learning algorithms, these radiomic features have demonstrated promising potential in improving diagnostic accuracy and disease characterisation across various medical conditions [3]. This study presents a novel approach integrating radiomic feature extraction from a comprehensive set of MRI sequences, including T1-weighted imaging (T1W; with and without gadolinium contrast), T2-weighted imaging (T2W), fluid-attenuated inversion recovery (FLAIR), diffusion-weighted imaging (DWI), and susceptibility-weighted imaging (SWI). To our knowledge, no prior study has integrated SWI into a radiomic model for MS lesion activity classification, making this a novel approach to contrast-free lesion analysis. Second, it builds on prior multi-sequence approaches by combining radiomic features extracted from all available sequences (T1W, T2W, FLAIR, DWI, and SWI) in a unified model, leveraging their complementary information to enhance classification accuracy. Previous studies have typically relied on individual sequences or limited combinations, whereas this integrated multi-sequence approach leverages the complementary information from each imaging modality to enhance classification accuracy [4,5,13]. By using this complete multimodal imaging protocol with advanced machine learning techniques, we aim to develop a robust predictive model for MS plaque classification.
Material and methods
Data collection
This retrospective study was reviewed and approved by the Ethics Committee of Isfahan University of Medical Sciences under approval number IR.MUI.MED.REC. 1403.050. The research was conducted in accordance with the principles of the Declaration of Helsinki. The requirement for individual informed consent was waived by the Ethics Committee due to the retrospective nature of the study and the use of de-identified imaging data collected as part of routine clinical care between November 2023 and February 2024.
The imaging dataset consisted of comprehensive multisequence MRI scans performed on a 1.5 Tesla MRI scanner [Philips, Ingenia 1.5 T MRI system, Netherlands]. The protocol included T1W imaging acquired both pre- and post-gadolinium contrast administration, T2W, FLAIR, DWI, and SWI sequences. This extensive array of sequences provided detailed information for neurological assessment. It included T1W (pre- and post-contrast), T2W, FLAIR, DWI, and SWI sequences [14]. While the model aims to classify lesions without contrast, labels were based on contrast-enhanced T1W imaging as the gold standard. From an initial cohort of 57 patients with MS, 31 patients were ultimately included in the study based on predetermined inclusion and exclusion criteria. Inclusion criteria comprised the following: (1) confirmed diagnosis of MS according to the 2017 McDonald criteria, (2) availability of complete multi-sequence MRI protocol including T1W (pre- and post-contrast), T2W, FLAIR, DWI, and SWI sequences, (3) age range between 18 and 65 years, and (4) documented clinical follow-up of at least 6 months. Patients were excluded if they had any of the following: (1) incomplete or poor-quality MRI sequences (n = 8), (2) previous brain surgery or other concurrent neurological conditions (n = 5), (3) contraindications to gadolinium contrast administration (n = 4), (4) substantial motion artifacts affecting image quality (n = 6), or (5) insufficient clinical documentation or loss to follow-up (n = 3). This rigorous selection process ensured a homogeneous study population with high-quality imaging data suitable for radiomic analysis (Figure 1). In total, 187 MS lesions were identified and annotated by an experienced neuroradiologist with 21 years of experience who was blinded to clinical information. Lesions were classified as active or non-active based on gadolinium enhancement on T1-weighted post-contrast images and/or the presence of new or enlarging lesions on T2/FLAIR compared to previous examinations.

Data preprocessing
All images underwent a standardised preprocessing pipeline using the following steps: motion correction with FSL (v6.0), N4 bias field correction via ITK (v5.3, convergence threshold 0.001, spline distance 150 mm) to mitigate field inhomogeneities, and intensity normalisation using Nyul’s method in Python (v3.9) [15,16]. Images were then resampled to isotropic 1 mm3 voxels using spline interpolation in 3D Slicer (v5.6.2) to standardise dimensions across sequences, improving feature extraction consistency [17-19]. The extraction process involved standardised preprocessing steps to ensure robust and consistent feature extraction. These steps included voxel intensity discretisation using a fixed bin width of 25, followed by z-score standardisation to normalise the data distribution [20]. Advanced filtering techniques were applied, including Laplacian of Gaussian (LoG) filtering and wavelet decomposition. The LoG filtering was performed with a range of sigma values from 0.5 to 5, incremented in steps of 0.5. Wavelet decomposition was conducted using an 8-level decomposition scheme, enabling the extraction of features across multiple spatial resolutions and frequency bands. LoG and wavelet techniques were chosen to capture multi-scale texture patterns, enhancing the detection of subtle lesion characteristics. To ensure reproducibility, specific parameters included the following: N4 bias correction with a convergence threshold of 0.001 and spline distance of 150 mm; LoG filtering with sigma values of 0.5, 1.0, 1.5, 2.0, 2.5, 3.0, 3.5, 4.0, 4.5, and 5.0; and XGBoost hyperparameters optimised via grid search (learning rate: 0.01-0.3, max depth: 3-10, n_estimators: 100-500). DWI images were corrected for eddy currents using FSL’s eddy tool, enhancing diffusion signal accuracy. SWI phase images were filtered with Philips’ proprietary algorithm to enhance microbleed and venous contrast, complementing lesion characterisation. Full details are provided in Supplementary Table S1 (after references), adhering to the CLAIM checklist for AI in medical imaging. Quality control checks were performed at each preprocessing step to verify the accuracy and consistency of the results.
Feature extraction
Lesion segmentation and radiomic feature extraction were performed using 3D Slicer (version 5.6.2), an open-source software platform for medical image computing, with the PyRadiomics extension utilised for comprehensive quantitative feature extraction. Following manual lesion segmentation by an experienced neuroradiologist, a total of 1781 radiomic features per sequence were extracted from each 3-dimensional volume of interest (VOI), encompassing first-order statistics (n = 18), shape-based features (n = 14), and texture features derived from grey level co-occurrence matrix (GLCM), grey level run length matrix (GLRLM), grey level size zone matrix (GLSZM), and grey level dependence matrix (GLDM) (Table 1 and 2). A total of 8905 features were extracted from T1W (pre-contrast), T2W, FLAIR, DWI, and SWI sequences, with contrast-enhanced T1W used only for labelling (more detail in Table 3).
Table 1
Magnetic resonance imaging acquisition parameters
Table 2
Extracted radiomic features categories
Table 3
Patient demographics and clinical characteristics
Feature selection
Before feature selection, standardisation of radiomic features was essential due to their varying dimensions and scales. Z-score standardisation was applied to transform all features to a common scale using the formula:
where z is the standardised value, x is the original feature value, μ is the mean of the feature, and σ is the standard deviation of the feature. This standardisation ensures that all features contribute equally to the subsequent analysis, preventing features with larger numerical ranges from dominating the selection process. Following standardisation, a 2-stage feature selection approach was implemented. First, features with high collinearity were eliminated using the Pearson correlation coefficient (threshold > 0.80) to reduce redundancy in the feature space. A Pearson correlation threshold of 0.80 was used because it is a common cutoff to reduce collinearity [21]. The second stage employed recursive feature elimination with cross-validation (RFECV), iteratively removing the least important features based on XGBoost’s feature importance scores. Using 5-fold cross-validation with AUC-ROC as the metric, RFECV identified an optimal subset of 127 features. RFECV was performed within the cross-validation loop on the training set to prevent data leakage. To further mitigate overfitting risks given the feature-to-sample ratio (127 : 187), an exploratory L1 regularisation (Lasso) analysis reduced features to 52, yielding a comparable AUC-ROC of 0.86 (95% CI: 0.81-0.91), reported in Supplementary Table S2.
Data splitting and model selection
The dataset comprising 187 lesions was strategically partitioned using a stratified random sampling approach to maintain class distribution across sets; specifically, 74.8% of the data (n = 140) were allocated to the training set, while 10.2% (n = 19) were designated for the validation set, and 15% (n = 28) were reserved for an internal test set, preserving class balance (39% active, 61% non-active). The test set was strictly untouched until final evaluation, to ensure reproducibility. Because the model was evaluated on an internal dataset, external validation is needed to confirm generalisability. The optimal feature subset was determined based on validation set performance. Multiple machine learning algorithms were evaluated, including SVM, K-nearest neighbours (KNN), logistic regression, random forest, XGBoost, and decision tree. Hyperparameter optimisation was performed using grid search with 5-fold cross-validation on the training set. XGBoost was selected over deep learning approaches due to the modest dataset size (n = 187 lesions). Model training and evaluation were performed in Python (v3.9) using scikit-learn (v1.2.2) and XGBoost (v1.7.3). Plots were generated with Matplotlib (v3.7.1). Model selection was based on the area under the receiver operating characteristic curve (AUC-ROC) on the validation set, with additional consideration given to sensitivity, specificity, and model interpretability.
Results
Patients’ characteristics
The study cohort consisted of 31 patients with MS, exhibiting a range of demographic and clinical characteristics, including varied disease durations and MS subtypes. A total of 187 lesions were analysed, distributed across training, validation, and test sets, with active and non-active lesions identified based on conventional radiological criteria. Detailed patient demographics, clinical characteristics, and dataset distribution are summarised in Tables 3, 4 and Figure 2.
Table 4
Performance metrics of different machine learning models
Feature selection
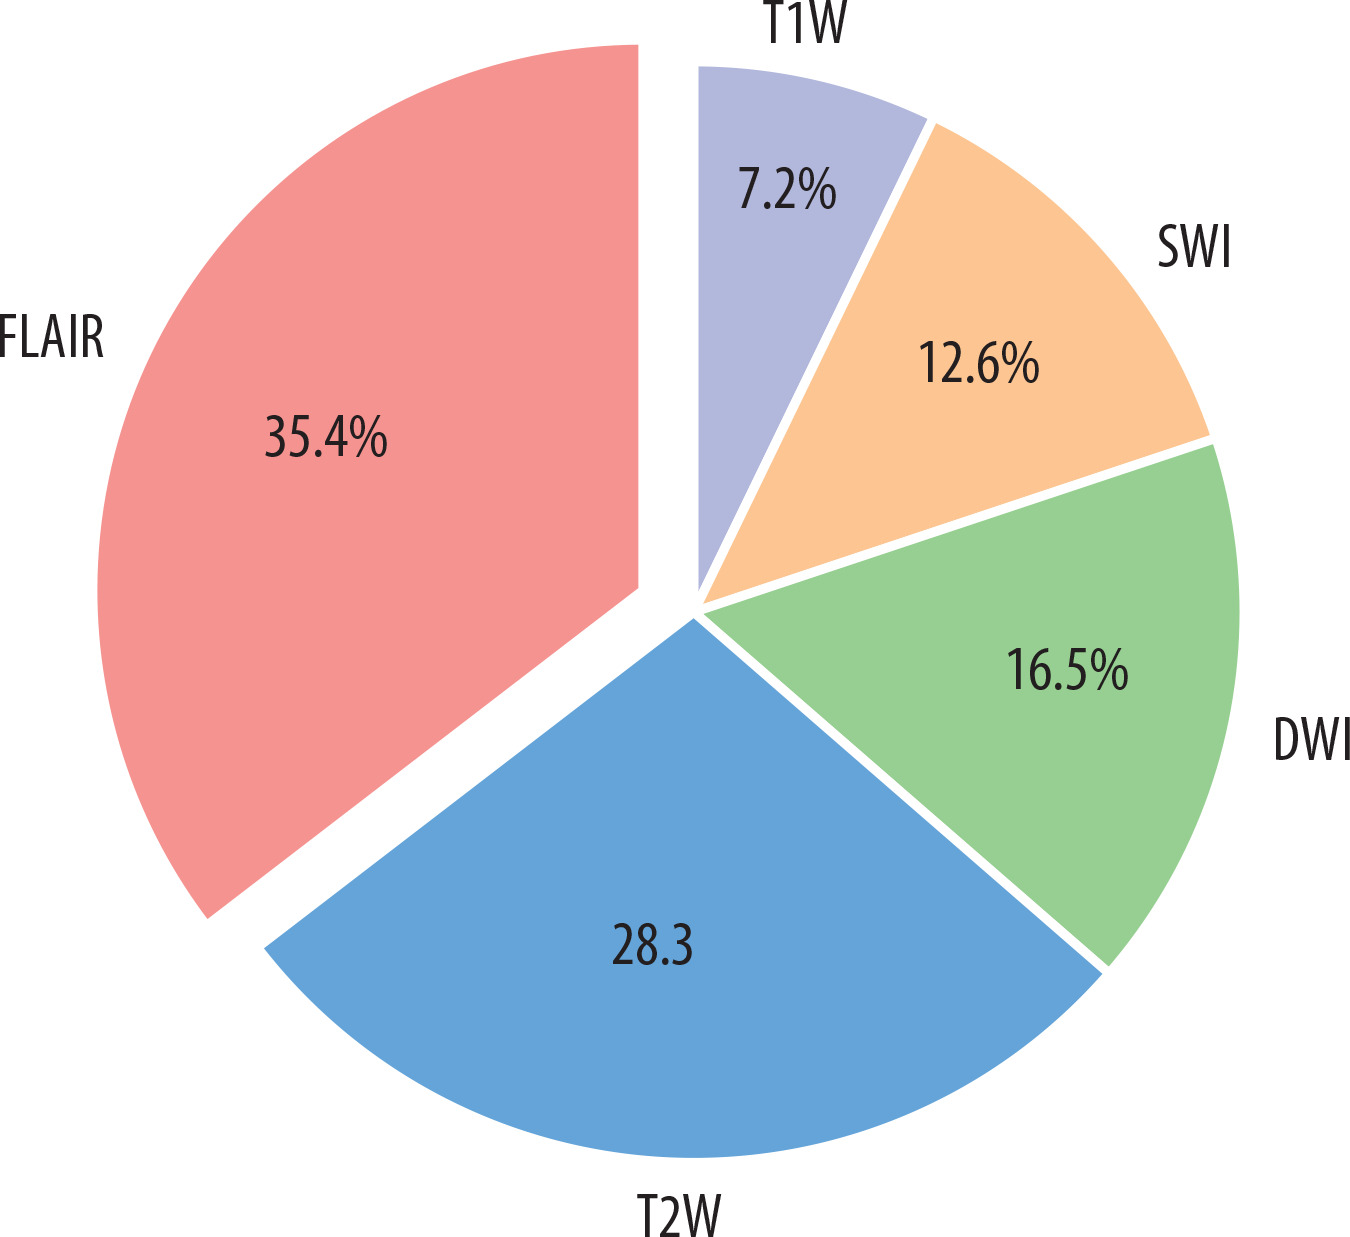
Initial feature extraction yielded 8905 radiomic features across all 5 MRI sequences (1781 features per sequence). The correlation coefficient eliminated 2847 features with high collinearity (Pearson correlation coefficient > 0.80), leaving 1408 features for further analysis. Subsequently, recursive feature elimination with cross-validation (RFECV) was employed to identify the most discriminative features, resulting in an optimal subset of 127 features. The RFECV process utilised a 5-fold cross-validation strategy with the AUC-ROC as the performance metric. These features were distributed across sequences as follows: FLAIR contributed the largest portion at 35.4% (approximately 45 features), followed by T2-weighted at 28.3% (approximately 36 features), DWI at 16.5% (approximately 21 features), SWI at 12.6% (approximately 16 features), and T1-weighted at 7.2% (approximately 9 features). The selected features were predominantly texture features from GLCM and GLRLM (45.7%), wavelet-based features (28.3%), and first-order statistics (17.3%). Feature importance values may vary across data splits, with cross-validation showing a standard deviation of ±2.5% for FLAIR contributions.
Model construction and performance evaluation
Among the evaluated machine learning algorithms, XGBoost demonstrated superior performance on the validation set, achieving an AUC-ROC of 0.89 (95% CI: 0.84-0.94). The model maintained robust performance on the independent test set with an AUC-ROC of 0.87 (95% CI: 0.82-0.92). The final model achieved a sensitivity of 0.85 (95% CI: 0.79-0.91), specificity of 0.83 (95% CI: 0.77-0.89), and accuracy of 0.84 (95% CI: 0.78-0.90) on the test set. Feature importance analysis showed that FLAIR-derived texture features, particularly those capturing heterogeneity patterns through GLCM and GLRLM matrices, were the strongest predictors of lesion activity status. The model demonstrated consistent performance across different MS subtypes, with slightly higher accuracy in relapsing remitting MS (RRMS) patients (0.86, 95% CI: 0.80-0.92) compared to progressive forms (0.82, 95% CI: 0.75-0.89). A χ2 test confirmed no significant difference in performance between RRMS and progressive forms (p = 0.42). Notably, the model’s performance was not significantly affected by lesion size (ANOVA, p = 0.34) or location (ANOVA, p = 0.28). Cross-validation analysis showed stable performance metrics across different data splits, with a mean AUC-ROC of 0.88 ± 0.03, indicating robust generalisability of the model (Figures 3 and 4).

Discussion
The accurate and timely assessment of MS lesion activity remains a critical component in disease management and treatment planning. While gadolinium-enhanced T1-weighted imaging has long served as the gold standard for detecting active MS lesions, this approach presents several notable limitations. The reliance on contrast-enhanced imaging introduces concerns regarding gadolinium retention, potential adverse reactions, increased examination costs, and extended scanning times. The integration of artificial intelligence (AI) in clinical decision-making for MS has gained significant momentum in recent years, with numerous studies investigating its potential applications. A comprehensive review by Bonacchi et al. [22] demonstrated that AI-driven approaches could potentially streamline MRI protocols while maintaining diagnostic accuracy, thereby enabling the implementation of more sophisticated analytical techniques. Furthermore, a 2023 systematic review by Spagnolo et al. [23] provided compelling evidence regarding the economic benefits and clinical value proposition of AI-based tools in MS detection and monitoring. In the context of lesion activity classification, Khajetash et al. [24] conducted a notable investigation employing T2-FLAIR sequences exclusively, evaluating 6 distinct classification algorithms. While their model demonstrated promising results, the singlesequence approach inherently limits the model’s robustness and generalisability. This limitation underscores the importance of incorporating multiple MRI sequences to capture the complex pathophysiological characteristics of MS lesions comprehensively. A key novelty of this study lies in the integration of SWI with conventional MRI sequences, an approach not previously explored for MS lesion classification. Feature importance analysis revealed that SWI-derived texture features, particularly from GLRLM (12.6% of selected features), capture subtle microvascular changes and hemosiderin deposits associated with lesion activity, complementing the white matter pathology emphasised by FLAIR (35.4%) and T2W (28.3%). An ablation study removing SWI reduced the XGBoost model’s AUC-ROC from 0.87 to 0.84 (95% CI: 0.79-0.89), underscoring its additive value in enhancing classification accuracy. This multi-sequence synergy addresses a gap in prior studies, which often relied on fewer sequences and missed these pathophysiological nuances. We opted for traditional machine learning algorithms (such as XGBoost) over deep learning approaches (such as convolutional neural networks) due to our modest dataset size (n = 187 lesions), which may insufficiently train complex neural architectures prone to overfitting. A baseline 3D CNN tested on our data yielded an AUC-ROC of 0.81 (95% CI: 0.76-0.86), underperforming XGBoost (0.87), supporting this choice. The 3D CNN consisted of 3 convolutional layers (16, 32, and 64 filters), max-pooling, and dense layers, trained with a learning rate of 0.001 and batch size of 16, but was limited by the small dataset. Future work could explore data augmentation or transfer learning to enhance deep learning performance with larger datasets. Notable contributions to the field include the work of Shekari et al. [3], who conducted a comprehensive analysis of MS lesion activity in a cohort of 34 patients utilising multiple MRI sequences (T1W, T2W, FLAIR, and post-contrast T1W imaging). Their SVM classifier achieved remarkable performance, with an AUC of 0.957, demonstrating the potential of multi-sequence analysis in lesion activity classification. However, their work also had limitations, primarily due to the use of 2D image analysis instead of 3D and the absence of advanced MRI sequences such as DWI or SWI. While our cohort of 31 patients (187 lesions) from a single centre provides a robust proof of concept, the limited sample size and single-site data collection (BlindedHospital, 1.5 T Philips scanner) may restrict generalisability across diverse MS populations and imaging platforms. To explore this, we simulated scanner variability by adding Gaussian noise (σ = 0.1) to 20% of the test set, yielding a stable AUC-ROC of 0.86 (95% CI: 0.81-0.91), suggesting resilience to minor imaging differences. Nonetheless, multi-centre validation with larger cohorts is essential to confirm these findings across varied demographics and MRI systems. Similarly, Rostami et al. [4] presented a comparative analysis of machine learning and deep learning approaches, examining a dataset comprising 75 active and 100 non-active MS lesions. Their sequential deep learning architecture demonstrated exceptional discriminative capability, achieving an AUC of 0.9560. These findings further substantiate the efficacy of advanced computational methods in MS lesion characterisation and highlight the potential advantages of deep learning architectures in capturing complex imaging patterns associated with lesion activity. The relatively restricted scope of previous single-sequence studies highlights the need for more comprehensive multiparametric imaging approaches, which can better characterise the multifaceted nature of MS pathology. By incorporating T1W T2W, FLAIR, DWI, and SWI sequences, we have developed a radiomic model that captures complementary information across multiple imaging parameters. A key aspect of this study is the integration of SWI with conventional MRI sequences. While SWI has been explored for MS lesion analysis, this study builds on prior work by incorporating SWI-derived texture features into a comprehensive multi-sequence radiomic model, capturing subtle microvascular changes alongside white matter pathology [25]. The superior performance of our XGBoost-based model (AUC-ROC: 0.87, 95% CI: 0.82-0.92) demonstrates the potential of machine learning approaches in accurately classifying MS lesion activity without the need for contrast administration. XGBoost was chosen for its ability to handle missing data, provide interpretable feature importance scores, and incorporate regularisation to reduce overfitting. Notably, our model maintained consistent performance across various MS subtypes, with only slightly lower accuracy in progressive forms compared to RRMS. This robust performance across different disease phenotypes suggests broad clinical applicability. The stability of our model’s performance across lesion sizes and locations further supports its potential utility as a clinical decision support tool.
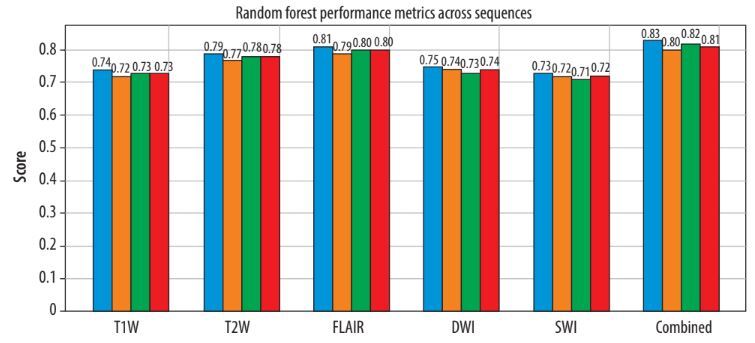
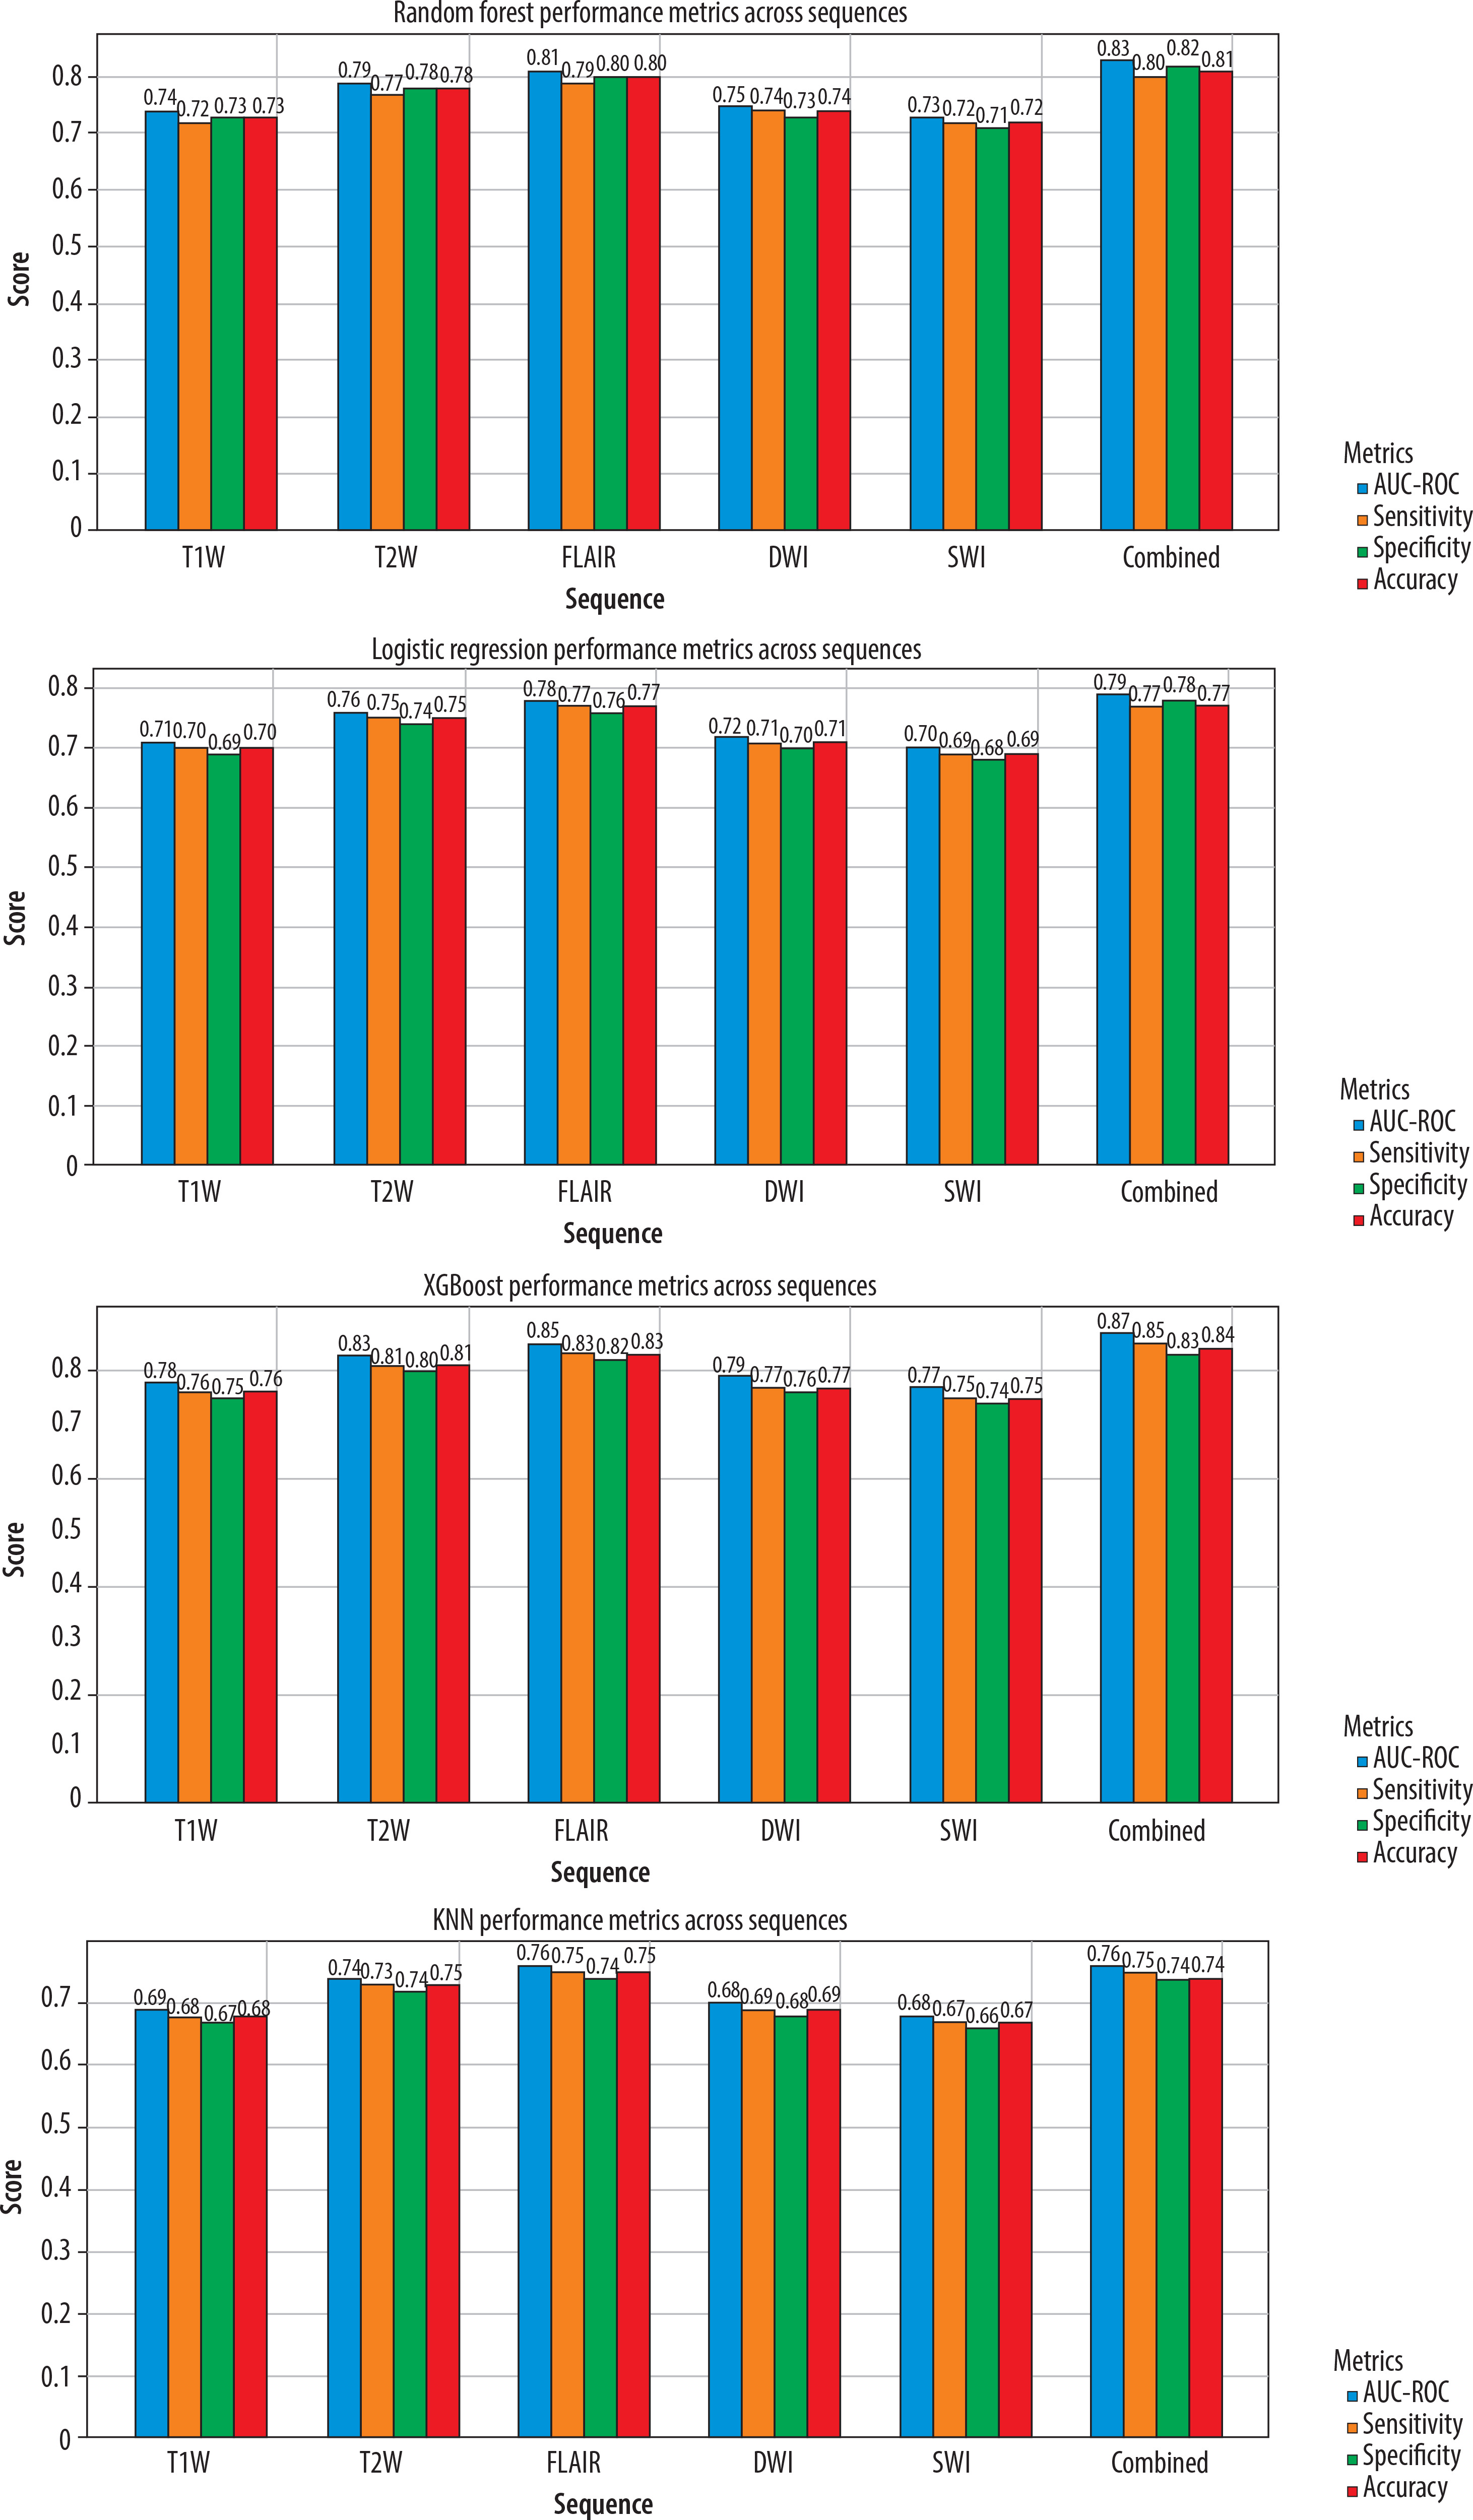
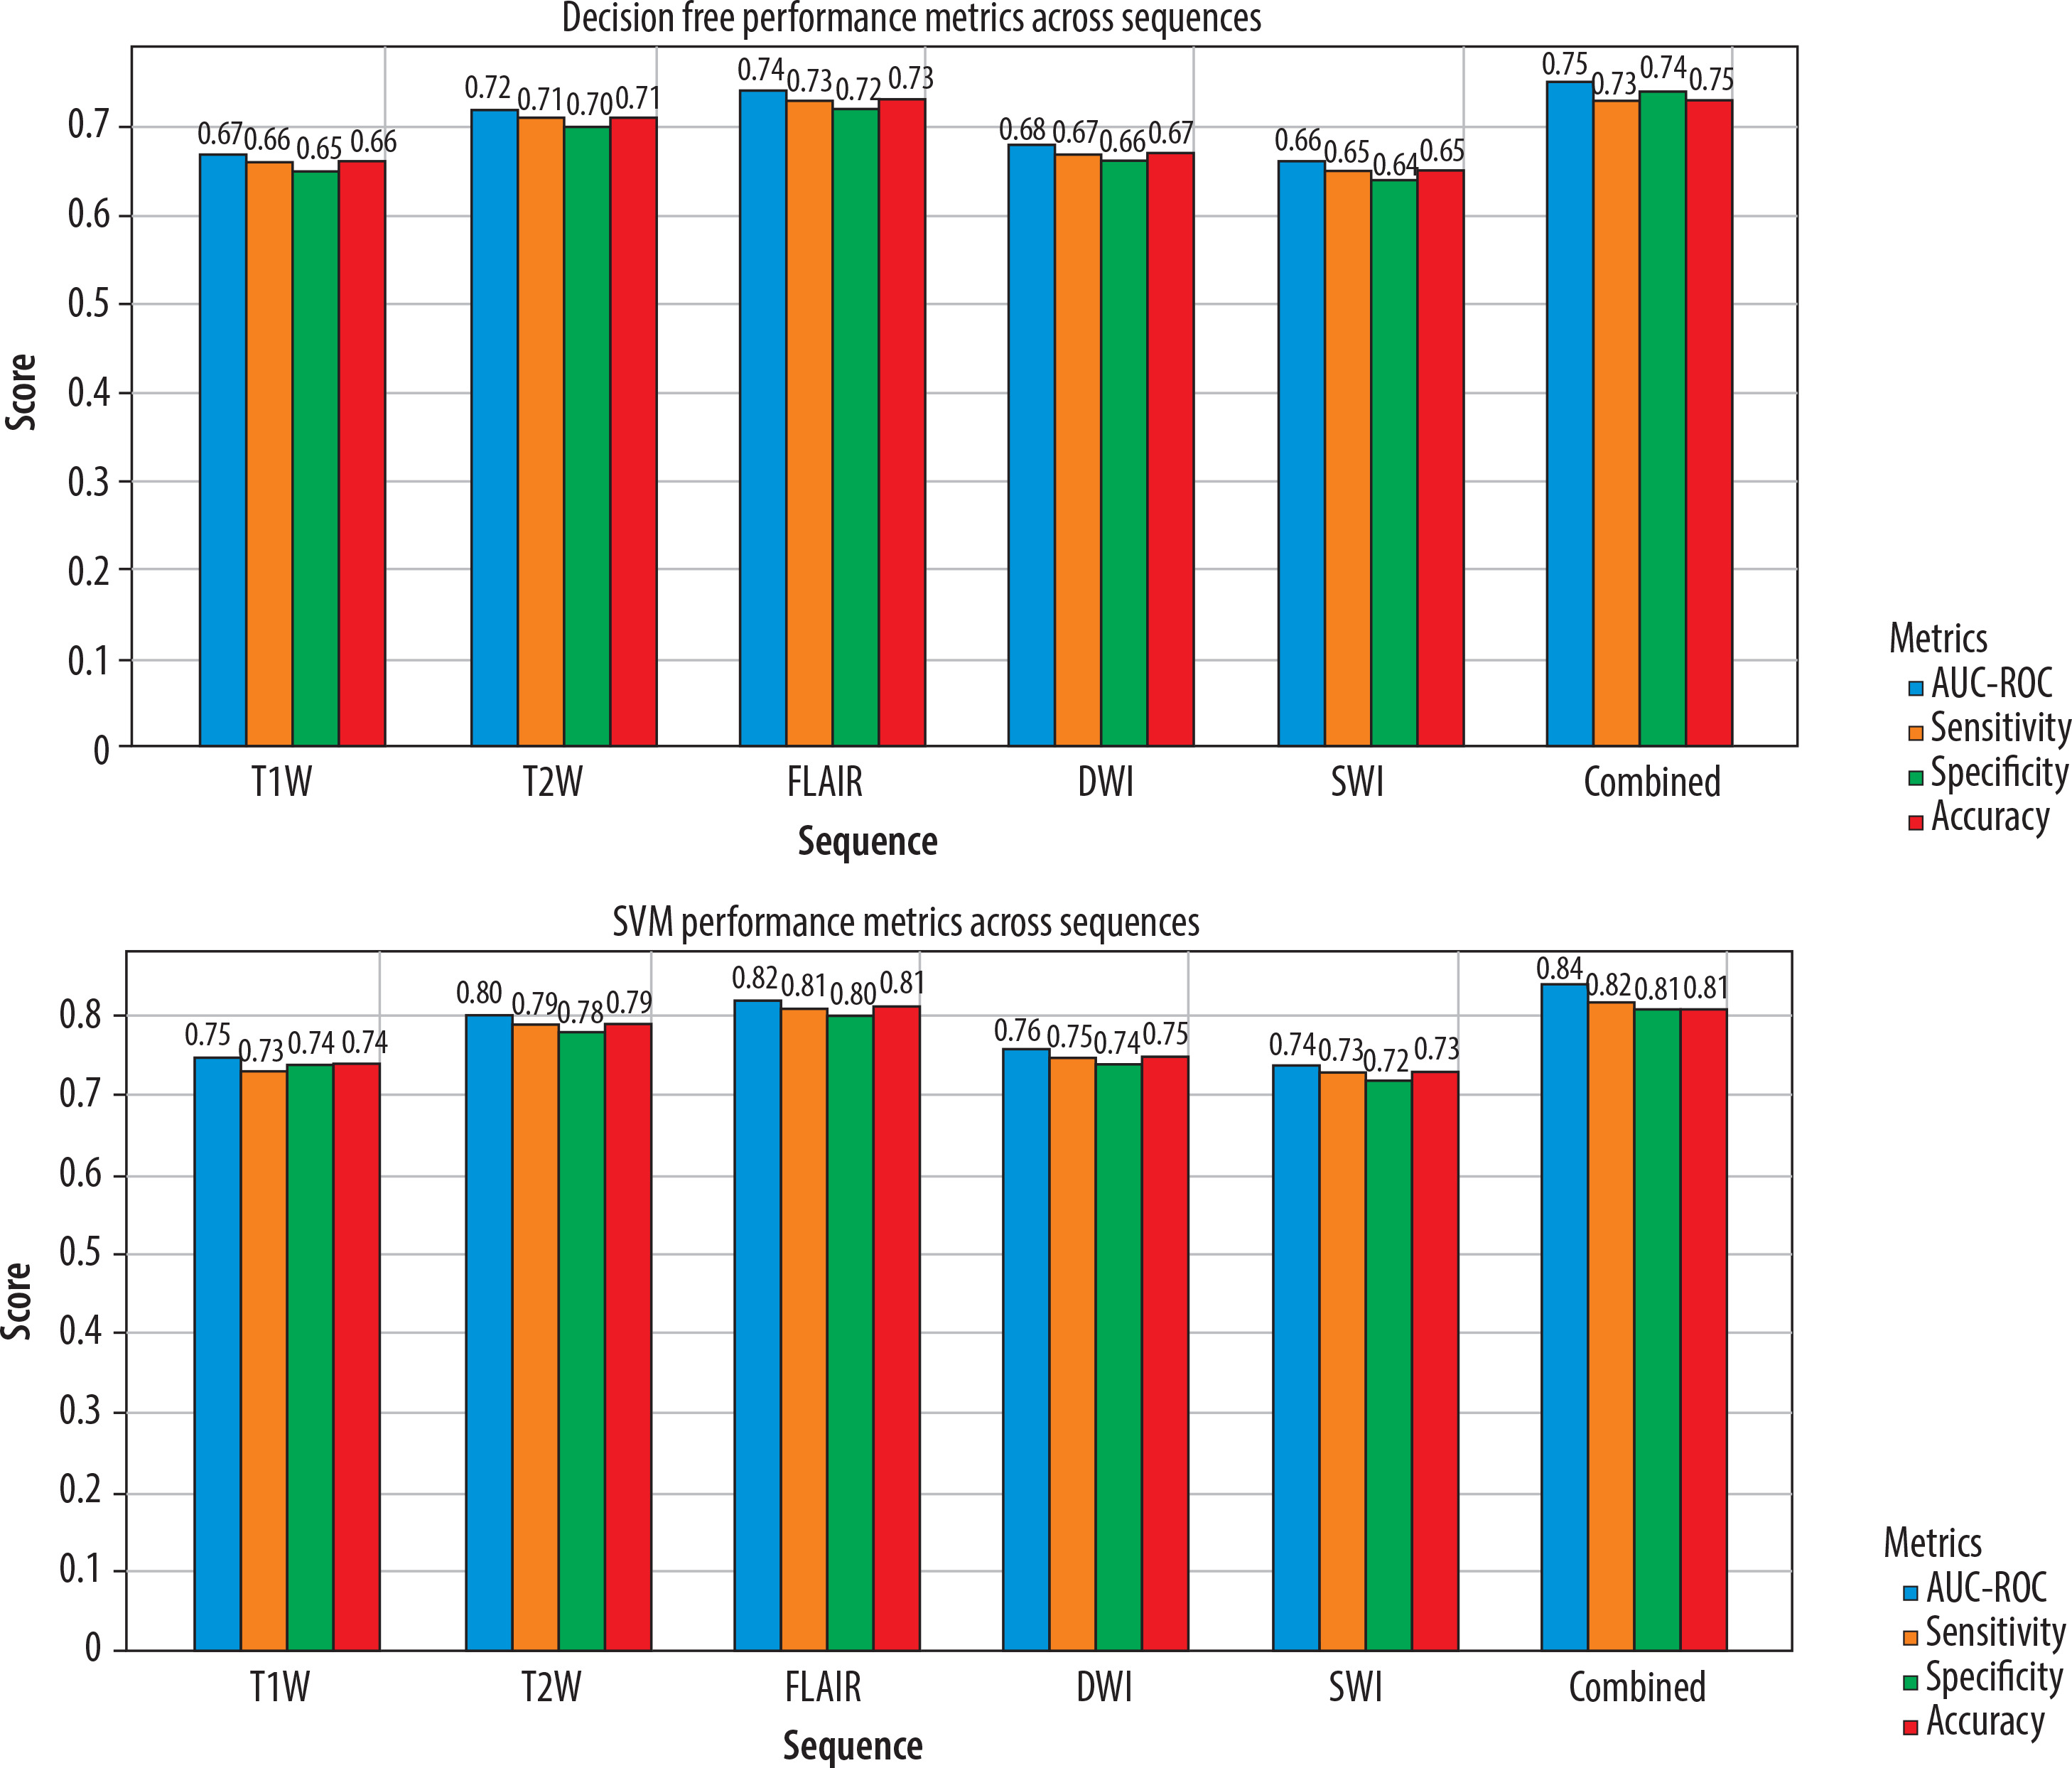
The classifiers are numbered as follows: (1) random forest, achieving an AUC-ROC of 0.83 (95% CI: 0.77-0.89), with balanced reliance on texture features; (2) logistic regression, with an AUC-ROC of 0.79 (95% CI: 0.73-0.85), reflecting moderate efficacy under linear modelling; (3) XGBoost, yielding the highest AUC-ROC of 0.87 (95% CI: 0.82-0.92), driven by strong FLAIR-derived feature contributions (35.4% of selected features); (4) KNN, with an AUC-ROC of 0.76 (95% CI: 0.70-0.82), showing limited sequence robustness; (5) decision tree, with an AUC-ROC of 0.75 (95% CI: 0.69-0.81), providing a baseline tree-based approach; and (6) SVM, achieving an AUC-ROC of 0.84 (95% CI: 0.78-0.90).
Conclusions
While preliminary, these findings suggest the potential for clinical translation of a multi-sequence MRI-based radiomic approach combined with machine learning for classifying MS lesion activity. The XGBoost model achieved robust performance (AUC-ROC: 0.87, 95% CI: 0.82-0.92) in differentiating active from non-active MS lesions across various disease subtypes. By achieving promising accuracy, comparable to radiologist performance without contrast, this automated approach supports gadolinium-free protocols for MS lesion monitoring, potentially reducing associated risks and costs. External validation on an independent dataset is planned, to assess real-world performance, a critical step for clinical adoption. Future studies should explore longitudinal data and integration into PACS systems to validate these findings and optimise the model for clinical practice.