Introduction
Interstitial lung diseases (ILDs) encompass a heterogeneous group of disorders characterised by varying degrees of inflammation and fibrosis affecting the pulmonary interstitium, alveolar spaces, and airways [1]. Among these, nonspecific interstitial pneumonia (NSIP) and organising pneumonia (formerly known as bronchiolitis obliterans organising pneumonia) are distinct clinicopathologic entities with differing therapeutic implications and prognoses. NSIP predominantly affects middle-aged adults and manifests with progressive dyspnoea and cough, and histologically, it is characterised by temporally uniform interstitial inflammation and fibrosis [2,3]. Accurate differentiation among ILD subtypes is essential, as management strategies and disease trajectories differ significantly; NSIP typically follows a more indolent course than usual interstitial pneumonia (UIP), with less responsiveness. However, distinguishing between these entities remains challenging, particularly in early or atypical presentations where histopathologic confirmation is limited or unavailable [4].
High-resolution computed tomography (HRCT) is the cornerstone imaging modality for assessing ILD, offering detailed characterisation of disease pattern, extent, and distribution. HRCT features strongly correlate with histopathologic and clinical findings and are integral to both diagnostic evaluation and longitudinal monitoring [5]. In NSIP, HRCT typically reveals bilateral, basal-predominant ground-glass opacities with fine reticulation and traction bronchiectasis, while honeycombing is uncommon. In contrast, UIP commonly presents with peripheral and basal reticulation, accompanied by honeycombing findings. Ground-glass opacities more distinctly characterise NSIP [6]. The integration of HRCT findings with clinical and serologic data in multidisciplinary discussions has become the diagnostic standard for ILD, often reducing the need for surgical lung biopsy in cases with characteristic imaging patterns [7]. Beyond qualitative visual assessment, quantitative computed tomography (QCT) techniques have emerged as valuable tools for the objective evaluation of parenchymal disease burden, regional deformation, and structural remodeling [8].
Recent advances in quantitative imaging have highlighted the significance of thoracic morphometric parameters in distinguishing between ILD subtypes and evaluating disease severity. Machine learning-based classifiers utilising texture and shape metrics have achieved high diagnostic accuracy (up to 90%) in distinguishing UIP from NSIP, highlighting the value of objective, reproducible image-derived features [9]. Among various morphometric indices, the anteroposterior-to-transverse (AP/T) thoracic diameter ratio is a simple yet potentially informative measure of thoracic configuration and lung mechanics. This ratio, which can be derived from routine CT scans without the need for advanced software, may reflect subtle structural alterations associated with changes in lung compliance, respiratory muscle function, and chest wall geometry. While the AP/T ratio has been applied to assess chest wall deformities and respiratory mechanics in other pulmonary disorders, its relevance in ILD remains largely unexplored. Given the distinct pathophysiologic mechanisms underlying NSIP and UIP, variations in thoracic morphometry may provide additional discriminatory value beyond conventional HRCT pattern recognition [10].
This study aims to quantitatively compare thoracic morphometric parameters, specifically the AP/T diameter ratio, among patients with NSIP, UIP, and healthy controls using CT. The study seeks to determine whether significant differences exist in AP/T ratios between these groups, evaluate the consistency of AP/T measurements across different thoracic levels, and explore the diagnostic potential of this ratio in distinguishing ILD subtypes. Furthermore, it investigates the association between thoracic morphometry and established CT imaging patterns. The overarching goal is to identify a simple, reproducible, and cost-effective imaging biomarker that may enhance diagnostic accuracy in the multidisciplinary evaluation of ILD. If validated, the AP/T ratio could provide complementary diagnostic information, particularly in clinical settings where advanced quantitative imaging tools are not available, and contribute to a deeper understanding of the morphologic and pathophysiologic distinctions between NSIP and UIP.
Material and methods
This study was a retrospective, cross-sectional case-control investigation conducted at a tertiary referral centre for ILDs. Sample size calculation was performed a priori using G*Power 3.1.9.4 software, based on a one-way analysis of variance (ANOVA) with fixed effects and two-way error for a three-group comparison (NSIP, OIP, and healthy controls). The study assumed α = 0.05, power (1 – β) = 0.80, and Cohen’s f = 0.25 (medium effect size), with k = 3 groups [11,12]. According to these calculations, the minimum total sample size required was 159, with 53 participants per group. To ensure adequate power and account for possible exclusions or missing data, this number was rounded to 162 participants (54 per group). An additional 10-15% of participants were allocated to mitigate potential exclusions, bringing the final target sample size to 180 participants, with 60 participants in each of the three groups.
This study included adult participants aged 30-70 years. A definitive diagnosis of NSIP or UIP was established through a multidisciplinary evaluation, integrating clinical, physiological, and CT findings, along with surgical or transbronchial lung biopsy data, when available. For all included patients, CT was performed within ± 3 months of diagnosis or within ± 3 months following pulmonary function tests when correlating disease severity. All CT scans were acquired in the supine position during full inspiration, utilising a thin-section imaging protocol. The control group comprised healthy individuals with no history of chest pathology and normal CT findings. Controls were matched with the patient groups based on age, sex, and body mass index (BMI), and underwent CT using the same imaging protocol. This matching ensured that measurements from both groups could be directly compared. Exclusion criteria included participants with a history of thoracic surgery (e.g., sternotomy, rib resection), significant pectus deformities, or severe spinal deformities (Cobb angle > 10°). Additionally, individuals with comorbid pulmonary conditions that could alter chest morphology (e.g., advanced emphysema with > 15% lobar involvement, large bullae, or fibrothoracic pleural disease) were excluded. Cases with insufficient image quality due to motion artifacts, incomplete field of view, slice thickness > 1.5 mm, or missing DICOM metadata were also excluded. Patients who experienced acute exacerbations or required mechanical ventilation during the imaging procedure were also excluded from the study.
Demographic data (age, sex, BMI, smoking history, comorbidities, and time elapsed between symptom onset and CT imaging) and clinical parameters (pulmonary function tests, including forced vital capacity [FVC], diffusion capacity of the lung for carbon monoxide [DLCO], total lung capacity [TLC], and dyspnoea scores) were recorded. Imaging variables, including HRCT features (e.g., honeycombing, ground-glass opacities, reticular patterns, disease extent scoring, and pulmonary artery diameter), were also assessed [13].
CT imaging protocol
All participants’ thorax CT images, obtained using a standardised protocol, were evaluated. Imaging was performed in the supine position during full inspiration, with a slice thickness of ≤ 1.5 mm for optimal detail [14]. Thoracic measurements were obtained at standardised axial levels, as defined in the literature. The primary measurement level was at the T3 vertebral body, followed by measurements at the T6 and T9 vertebral levels [15].
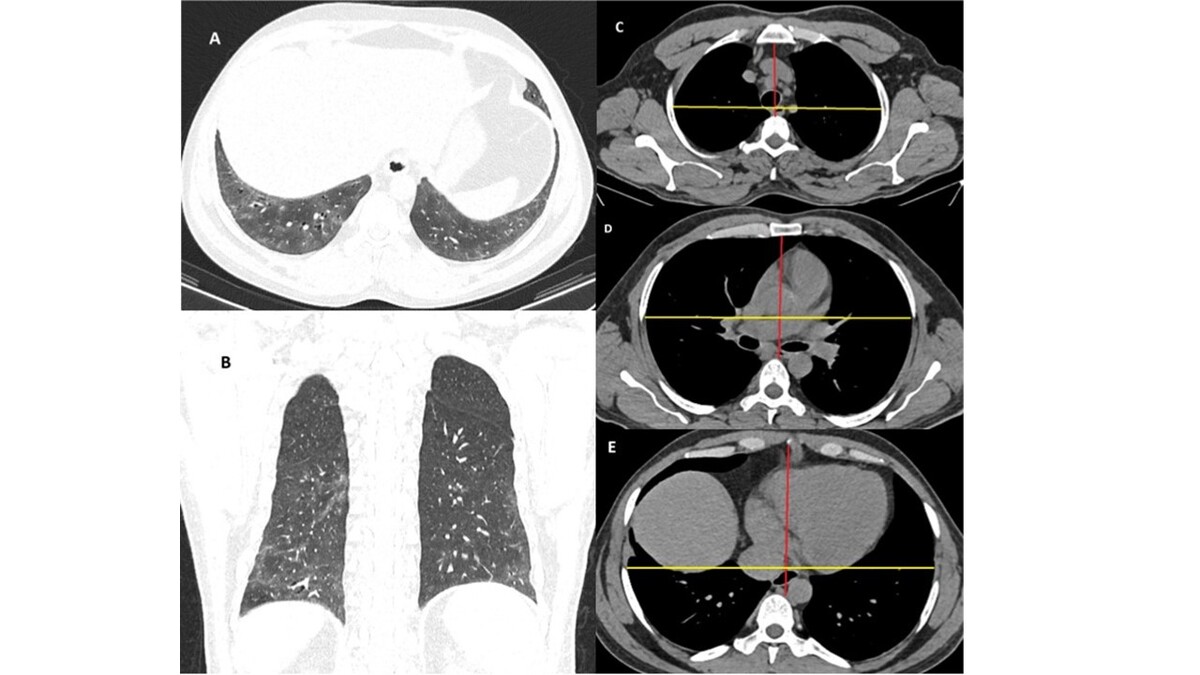
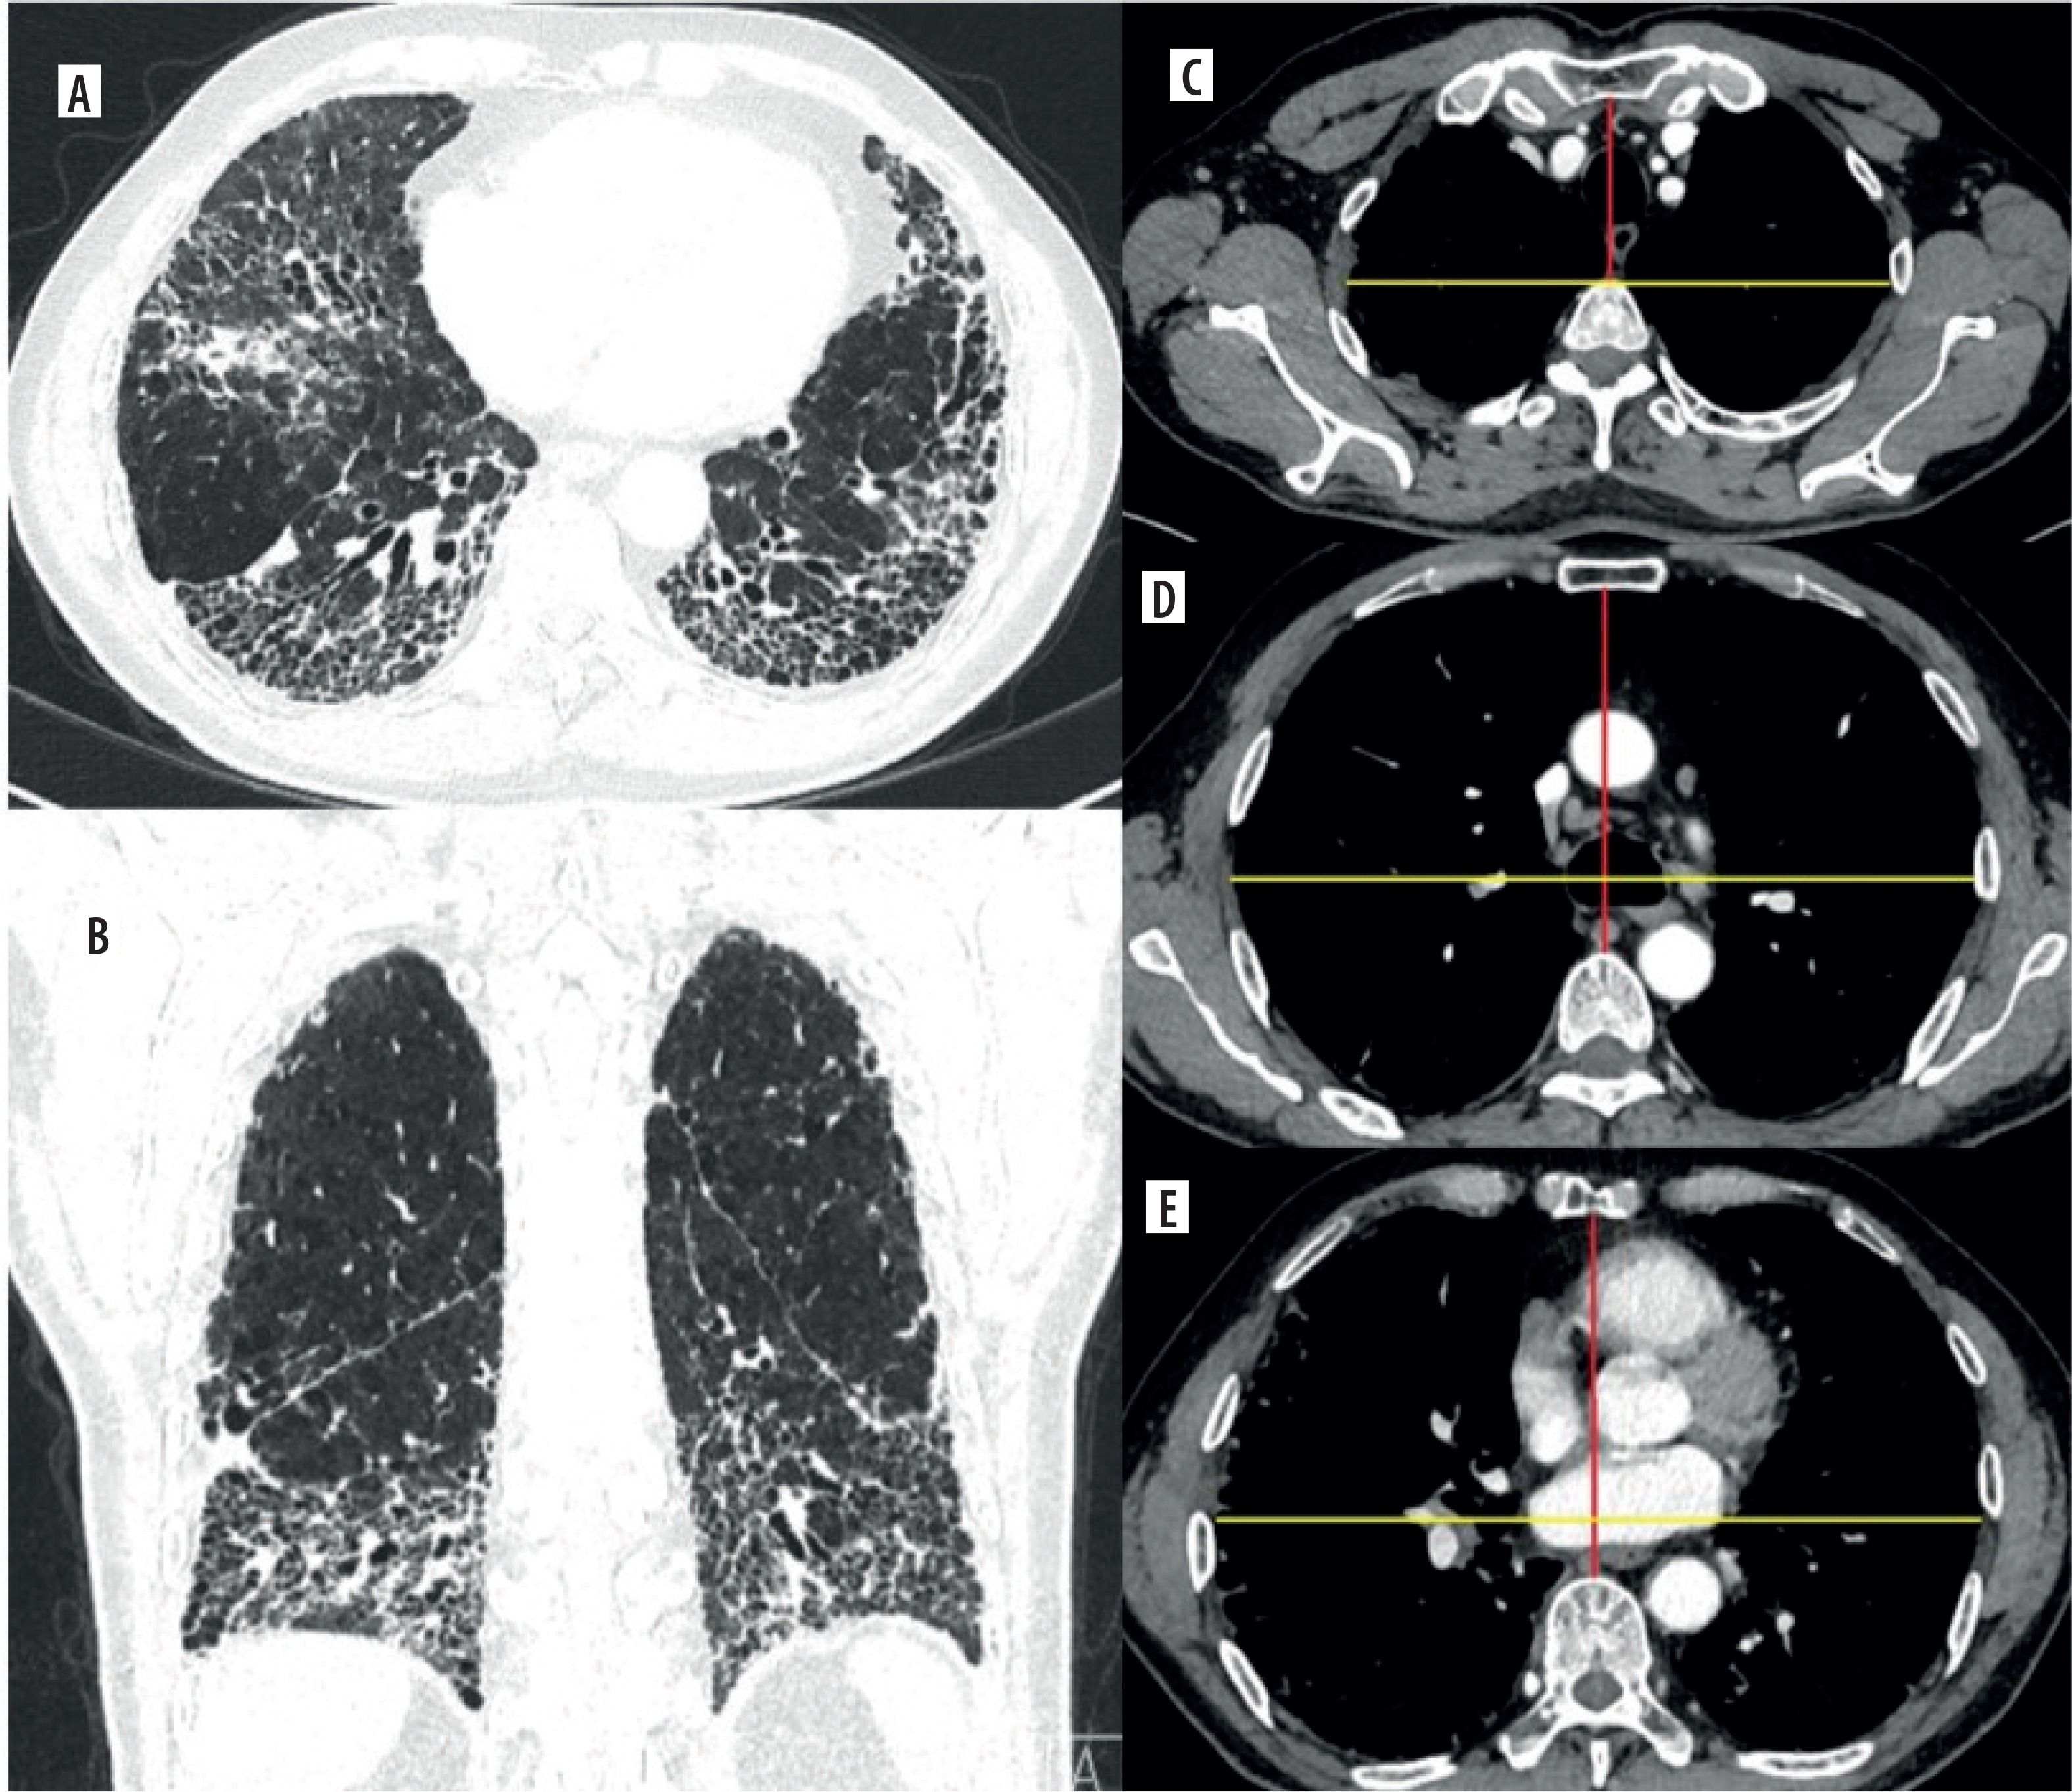
At each level, 2 key measurements were recorded on axial thorax CT images in the mediastinal window: the anteroposterior (AP) diameter, defined as the distance from the posterior surface of the sternum to the anterior surface of the opposing vertebral body, measured along the axial plane, and the transverse (T) diameter, defined as the maximum distance between the right and left pleural surfaces, perpendicular to the AP diameter (Figures 1 and 2). The AP/T ratio was calculated at each level (T3, T6, and T9). All measurements were performed by a radiologist with 14 years of experience.
Figure 1
Nonspecific interstitial pneumonia. (A) Axial and (B) coronal lung window computed tomography reconstructions demonstrate confluent groundglass opacities in the bilateral lower lobes associated with traction bronchiectasis. Peribronchovascular predominance with subpleural sparing is observed on the axial image. (C-E) Axial mediastinal window images show the anteroposterior (red line) and transverse (yellow line) diameters of the thoracic cage measured at the T3, T6, and T9 vertebral levels, respectively
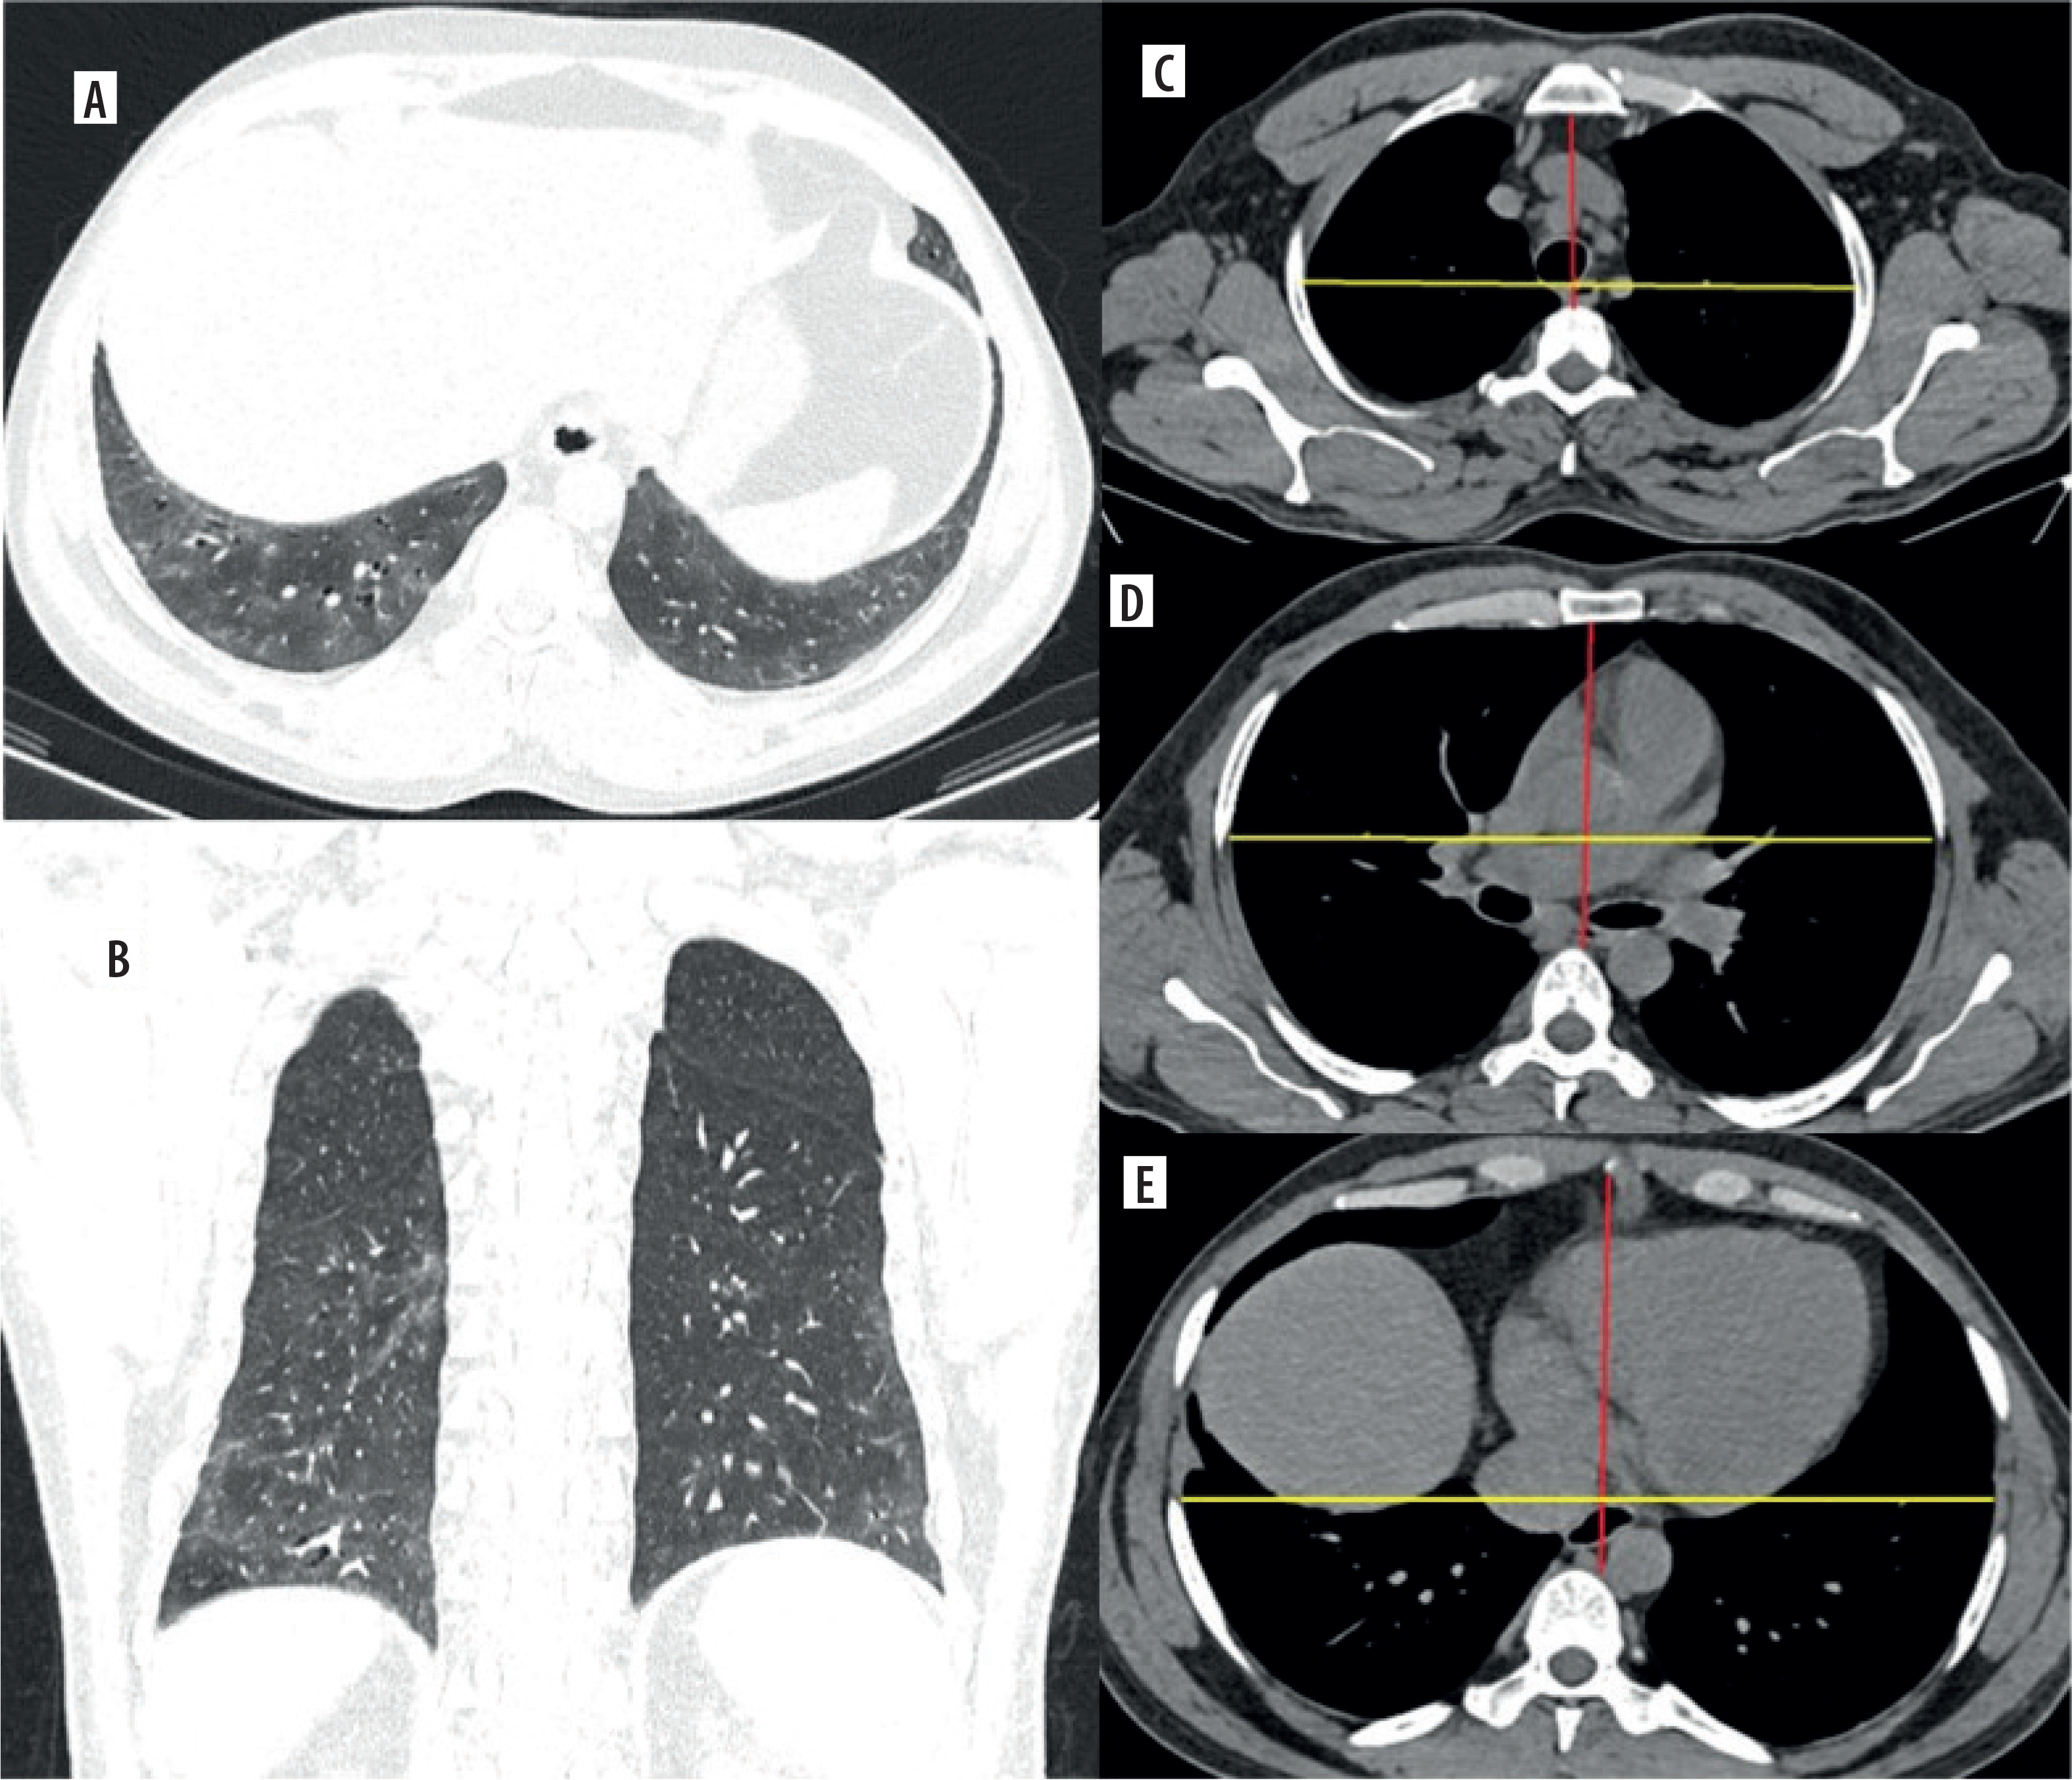
Figure 2
Usual interstitial pneumonia. A) Axial and (B) coronal lung window computed tomography reconstructions demonstrate predominant subpleural and basal honeycombing, traction bronchiectasis, reticulation, and interlobular septal thickening. C-E) Axial mediastinal window images show the anteroposterior (red line) and transverse (yellow line) diameters of the thoracic cage measured at the T3, T6, and T9 vertebral levels, respectively
Statistical analysis
All statistical analyses were performed using SPSS version 30.0 (IBM Corp., Armonk, NY, USA). Continuous variables were tested for normality using the Shapiro-Wilk test. Data with normal distribution were expressed as mean ± standard deviation, whereas categorical variables were summarised as frequencies and percentages. Comparisons among the 3 study groups (NSIP, UIP, and healthy controls) were conducted using one-way analysis of variance (ANOVA) for continuous variables and the c2 test for categorical variables. When the overall ANOVA yielded statistically significant results, post hoc pairwise comparisons were performed using the Tukey Honestly Significant Difference (HSD) test to identify specific intergroup differences. A p-value < 0.05 was considered statistically significant.
Results
Demographic and clinical characteristics
The demographic and clinical characteristics of the study population are summarised in Table 1. The control group consisted of male and female subgroups, with mean ages of 59.73 ± 6.36 years and 58.63 ± 9.03 years, respectively. In the NSIP cohort, males had a mean age of 65.96 ± 12.76 years, while females had a mean age of 62.06 ± 11.37 years. The UIP group consisted of male and female participants with mean ages of 63.61 ± 6.73 years and 59.48 ± 8.64 years, respectively. Collectively, these findings indicate that age distributions were relatively consistent across groups. The mean age distribution was comparable across the 3 diagnostic categories, with no statistically significant difference among the groups (p = 0.082) (Table 1). Although patients with NSIP were generally older on average compared with those in the UIP and control groups, this suggests a possible relationship between disease chronicity and age at presentation.
Table 1
Demographic and clinical characteristics of study participants
| Parameter | NSIP (n = 60) | UIP (n = 60) | Control (n = 60) | p-value |
|---|---|---|---|---|
| Age (years) | 63.8 ± 12.1 | 61.7 ± 7.8 | 59.1 ± 7.7 | 0.082 |
| Female, n (%) | 33 (55) | 27 (45) | 30 (50) | 0.632 |
| Male, n (%) | 27 (45) | 33 (55) | 30 (50) | 0.632 |
| BMI | 26.8 ± 3.9 | 27.2 ± 3.6 | 25.9 ± 3.2 | 0.174 |
| Smoker, n (%) | 24 (40) | 27 (45) | 26 (43.3) | 0.881 |
| Time from symptom onset to CT | 8.5 ± 3.7 | 7.9 ± 3.2 | – | 0.289 |
| FVC | 72.6 ± 14.1 | 70.3 ± 12.8 | – | 0.351 |
| DLCO | 62.5 ± 13.9 | 60.8 ± 14.7 | – | 0.516 |
| TLC | 76.2 ± 10.5 | 71.4 ± 11.2 | – | 0.017* |
| mMRC dyspnoea score | 1 (1-2) | 2 (1-3) | – | 0.018* |
| Resting SpO₂ | 95.8 ± 1.8 | 96.2 ± 1.7 | 97.1 ± 1.5 | 0.037* |
Sex distribution and smoking status did not differ significantly among the groups (p > 0.05), confirming that the study population was demographically homogeneous. Body mass index (BMI) was also similar across all groups (p = 0.174), indicating that body composition was not a confounding factor in assessing thoracic morphometry.
Quantitative assessment of thoracic morphometry
Comparative evaluation of thoracic morphometric parameters among the NSIP, UIP, and control groups is presented in Table 2. Significant intergroup differences were identified, particularly in measurements obtained at the upper thoracic levels.
Table 2
Comparison of thoracic morphometric parameters among nonspecific interstitial pneumonia (NSIP), usual interstitial pneumonia (UIP), and control groups
| Variable | NSIP (n = 60) | UIP (n = 60) | Control (n = 60) | F | NSIP-UIP-Control | NSIP-UIP | UIP-Control | NSIP-Control |
|---|---|---|---|---|---|---|---|---|
| T3 anterior | 70.55 ± 12.74 | 64.93 ± 9.09 | 68.23 ± 12.09 | 3.67 | 0.028* | 0.023* | 0.346 | 0.804 |
| T3 transverse | 185.35 ± 19.61 | 176.37 ± 18.63 | 187.60 ± 17.74 | 6.07 | 0.003* | 0.028* | 0.004** | 0.993 |
| T3 anterior/transverse | 0.38 ± 0.06 | 0.37 ± 0.06 | 0.37 ± 0.07 | 0.81 | 0.445 | 0,998 | 0.999 | 0.582 |
| T6 anterior | 117.70 ± 15.70 | 112.32 ± 15.47 | 114.32 ± 16.57 | 1.75 | 0.176 | 0.197 | 0.994 | 0.738 |
| T6 transverse | 226.45 ± 18.31 | 223.37 ± 19.53 | 231.98 ± 15.52 | 3.58 | 0.029* | 0.992 | 0.027* | 0.275 |
| T6 anterior/transverse | 0.52 ± 0.07 | 0.51 ± 0.08 | 0.49 ± 0.07 | 2.14 | 0.121 | 0.640 | 0.996 | 0.109 |
| T9 anterior | 131.30 ± 20 | 125.05 ± 19.34 | 128.88 ± 20.87 | 1.48 | 0.231 | 0.270 | 0.891 | 0.995 |
| T9 transverse | 245.08 ± 22.48 | 240.72 ± 22.49 | 250.48 ± 20.43 | 3.02 | 0.051* | 0.824 | 0.046* | 0.531 |
| T9 anterior/transverse | 0.54 ± 0.08 | 0.52 ± 0.09 | 0.52 ± 0.08 | 1.10 | 0.333 | 0.942 | 0.999 | 0.411 |
| T3 + T6 + T9/3 | 0.48 ± 0.06 | 0.47 ± 0.07 | 0.46 ± 0.07 | 1.63 | 0.198 | 0.469 | 0.798 | 0.167 |
At the T3 vertebral level, both the AP and transverse diameters demonstrated statistically significant variation (p = 0.028 and p = 0.003, respectively). The mean T3 anterior diameter was smaller in UIP (64.93 ± 9.09 mm) than in NSIP (70.55 ± 2.74 mm, p = 0.023) and in the control group (68.23 ± 12.09 mm). Likewise, the T3 transverse diameter was reduced in UIP (176.37 ± 18.63 mm) relative to controls (187.60 ± 17.74 mm, p = 0.004). The AP-to-transverse ratio did not differ significantly across groups (p = 0.445), indicating preservation of overall thoracic proportions despite smaller dimensions.
At the T6 level, the transverse diameter differed significantly among groups (p = 0.029), with UIP exhibiting lower mean values (223.37 ± 19.53 mm) than controls (231.98 ± 15.52 mm, p = 0.027). No significant variation was observed in AP diameters or AP/T ratios at this level (p > 0.05).
At the T9 level, intergroup differences in the transverse diameter approached statistical significance (p = 0.051), with smaller measurements in UIP compared to controls (240.72 ± 22.49 mm; 250.48 ± 20.43 mm, p = 0.046). The AP diameter and AP/T ratio at this level remained comparable across groups (p > 0.05). The composite mean of all thoracic levels ([T3 + T6 + T9]/3) showed no significant intergroup difference (p = 0.198).
Post hoc Tukey HSD testing revealed that these differences primarily arose from comparisons between UIP and NSIP, as well as between UIP and Control, at the upper thoracic levels. Significant pairwise differences were observed for T3 anterior (NSIP-UIP, p = 0.023), T3 transverse (UIP-Control, p = 0.004), and T6 transverse (UIP-Control, p = 0.027).
Taken together, these findings demonstrate that thoracic dimensional reduction is most evident in UIP, particularly in the upper thoracic cage, suggesting greater restrictive remodeling and decreased chest wall compliance associated with advanced fibrosis. The NSIP group exhibited intermediate morphometric values, reflecting a relatively preserved thoracic configuration consistent with its less fibrotic and more reversible disease pattern.
Discussion
This study provides a novel quantitative evaluation of thoracic morphometry among patients with NSIP, UIP, and healthy individuals, focusing particularly on the AP and transverse thoracic diameters and their ratio (AP/T) across standardised vertebral levels (T3, T6, T9). The results demonstrate that UIP is associated with a reduction in both anterior and transverse thoracic dimensions (most prominently at the upper thoracic level). In contrast, overall thoracic proportions (AP/T ratio) remain preserved. These findings suggest that advanced fibrotic remodeling in UIP leads to a generalised reduction in thoracic expansibility and compliance, consistent with the restrictive ventilatory mechanics characteristic of this disease.
Although previous quantitative imaging studies in ILDs have largely emphasised parenchymal and textural features, few have explored thoracic morphometric alterations as surrogate markers of structural remodeling. The observed reduction in transverse and anterior thoracic diameters in UIP aligns with the concept of fibrotic lung contraction and chest wall restriction reported in earlier physiologic and imaging studies [8]. Walsh et al. [8] emphasised that progressive fibrosis results in decreased thoracic volume and compliance, corresponding to impaired TLC and reduced FVC findings that were likewise reflected in the current study, where TLC was significantly lower in UIP compared with NSIP.
The absence of significant alterations in the AP/T ratio across groups indicates that, despite dimensional reductions, the relative thoracic configuration is maintained. Similar proportional preservation has been described in chronic fibrosing lung diseases, where both anteroposterior and transverse chest dimensions decline concurrently [10]. This may reflect compensatory adjustments in chest wall mechanics and diaphragm excursion that prevent disproportionate deformation of the chest wall.
Our finding that the most pronounced morphometric changes occur at the upper thoracic level (T3) is particularly noteworthy. The upper thoracic cage contributes substantially to inspiratory mechanics and overall chest wall compliance; therefore, localised rigidity in this region may signify early mechanical consequences of fibrosis. Prior HRCT-based morphometric studies in chronic obstructive pulmonary disease (COPD) similarly demonstrated that upper thoracic narrowing correlates with disease severity and lung hyperinflation [10]. In the fibrotic ILD spectrum, however, the reverse phenomenon (reduction of upper thoracic diameters due to volume loss and scarring) appears to be pathophysiologically relevant.
The reduction of thoracic dimensions in UIP likely reflects the interplay between parenchymal fibrosis, pleural traction, and altered chest wall mechanics. Progressive fibrotic stiffening of the lung parenchyma leads to retraction of adjacent structures, decreased intercostal muscle excursion, and eventual restriction of thoracic cage movement [4]. This biomechanical remodeling is less pronounced in NSIP, which tends to exhibit more uniform and potentially reversible interstitial inflammation [3]. The intermediate morphometric profile observed in the NSIP cohort in this study supports this notion. Additionally, thoracic morphometric reduction may serve as a quantifiable external marker of internal fibrotic progression. Advances in radiomic and QCT analysis have increasingly focused on volumetric and textural markers to evaluate ILD severity [9]. While such techniques require specialised software and computational resources, the AP and transverse thoracic diameters can be derived rapidly from standard CT images, providing a simple and reproducible alternative for routine clinical assessment.
The identification of quantifiable morphometric differences between NSIP and UIP holds significant clinical relevance. These measurements can serve as supplementary, objective parameters within the multidisciplinary discussion framework for diagnosing ILD, complementing traditional HRCT pattern recognition and clinical evaluation [7,8]. Due to their simplicity, which requires only standard axial CT images and conventional measurement tools, thoracic morphometric indices such as the anteroposterior and transverse diameters can be seamlessly incorporated into routine radiological workflows without the need for advanced post-processing or machine learning software. From a clinical standpoint, quantitative assessment of thoracic configuration provides indirect yet valuable insights into disease chronicity and the mechanical consequences of fibrotic remodeling. Notably, significant reductions in upper thoracic diameters (particularly in the absence of extensive honeycombing) may reflect early restrictive remodeling and could aid in differentiating UIP from NSIP in cases with overlapping imaging features [5,10]. In resource-limited settings, serial measurement of thoracic diameters may represent a cost-effective alternative for longitudinal monitoring of disease progression and therapeutic response when access to sophisticated quantitative imaging platforms is restricted [8]. The relatively preserved anteroposterior-to-transverse (AP/T) ratios observed across disease groups in this study further suggest that thoracic morphometry alone may not be a substitute for comprehensive parenchymal texture analysis but could be integrated into composite diagnostic indices to enhance diagnostic accuracy. Future research should aim to elucidate the correlations between thoracic morphometric parameters, functional decline, and validated prognostic models, such as the GAP (Gender-Age-Physiology) index, to determine their predictive and longitudinal value [3,9].
Future research should aim to validate these findings through larger, prospective, multicentre studies that incorporate longitudinal follow-up to evaluate temporal changes in thoracic morphometric parameters in relation to pulmonary function decline and therapeutic response [5,8]. The development and validation of automated, machine-learning-based measurement algorithms could further enhance reproducibility and facilitate integration of thoracic morphometry into routine clinical practice [9]. Moreover, combining thoracic morphometric analysis with other quantitative imaging biomarkers (such as parenchymal texture assessment, vascular morphology, and functional imaging) may enable the creation of composite indices with superior diagnostic and prognostic performance [13,14]. Ultimately, incorporating morphometric endpoints into clinical trials of antifibrotic and anti-inflammatory therapies could provide objective and sensitive measures of treatment response, enabling the earlier detection of therapeutic efficacy or disease progression.
Conclusions
This study demonstrates that thoracic morphometry, derived from standard axial CT images, reveals measurable structural distinctions between NSIP, UIP, and healthy lungs, most notably, reduced upper thoracic dimensions in UIP. These quantitative parameters offer a straightforward, reproducible, and cost-effective method for evaluating restrictive remodeling, potentially complementing established imaging and functional markers of disease severity. The clinical implementation of thoracic morphometry, potentially enhanced by automated measurement techniques and integration with other quantitative CT methods, could improve diagnostic accuracy and provide objective measures for disease monitoring and treatment response assessment in patients with ILD.