

Introduction
Radiological reporting in the emergency setting, particularly in high-volume facilities, represents a “perfect storm,” often associated with high rates of diagnostic errors, omissions, and addendums [1–3]. In this context, incidental and collateral findings are frequently overlooked, as priority is typically given to acute and life-threatening conditions. Incidental findings may be observed in 25-31% of chest computed tomography (CCT) scans performed for trauma, yet they are mentioned in only one-third of cases [4–7]. While many of these findings are clinically irrelevant, others may have relevant implications for patients’ prognosis if left undiagnosed. For example, roughly 20% of incidentally detected pulmonary nodules require radiological follow-up to exclude cancer [8]. Similarly, the presence of coronary calcification may enable recognition of patients at high risk for cardiovascular disease who might benefit from pharmacological treatments to reduce morbidity and mortality [9–11].
Artificial intelligence (AI) technology is rapidly gaining traction across a variety of radiological scenarios and has demonstrated efficacy in thoracic imaging for exam triage, error monitoring, and opportunistic diagnoses [12]. Moreover, AI has been shown to reduce CCT interpretation times by 22% [13].
The aim of this study was to evaluate the potential benefits of using AI technology in the evaluation of CCT in an emergency setting.
Material and methods
Patient population
In this Institutional Review Board (IRB)-approved retrospective study, the need for informed consent was waived due to the retrospective nature. We considered for inclusion 105 consecutive patients who underwent unenhanced CCT scans in an emergency setting at Bolzano Central Hospital over a 2-month period (November-December 2024). Exclusion criteria included patients younger than 18 years (9/105) and insufficient image quality due to severe motion or metal artifacts (e.g., caused by extracorporeal medical devices) that made radiological image evaluation unreliable (6/96). CT scans affected by mild motion artifacts that still allowed for a reliable radiological assessment (23/90) were retained in the study population, as well as patients with post-surgical thoracic changes (5/90). There were no cases of incomplete anatomical coverage. Consequently, the study population included 90 patients (48 male and 42 female, mean age 65 + 17 years).
CT technique
CCT scans were acquired in inspiration using a spiral technique with the patient in the supine position with the arms raised above the head. Two different scanners were used: 12/90 (13.3%) exams were acquired on a dual source scanner (Somatom Drive, Siemens), with acquisition parameters of 110 kVp and 81 mAs as reference, and 78/90 (86.7%) on a twin beam scanner (Somatom Edge, Siemens), with acquisition parameters of 120 kVp and 66 mAs as reference. Both scanners were equipped with the same detector (Stellar).
CT evaluation
Original radiology reports, written in free-text format, were retrieved from the Radiology Information System, anonymized, and reviewed by a single experienced radiologist (M.B.). The radiologist was asked to verify whether any of the following 12 findings were mentioned in the reports: lung opacifications, lung nodules, emphysema, coronary artery calcifications, aortic dilatation, pulmonary artery dilatation, pleural effusion, pericardial effusion, pneumothorax, rib fractures, vertebral fractures, and adrenal masses. When mentioned, the radiologist was further asked to determine whether each finding was described as present (positive finding) or absent (negative finding).
Anonymized 3 mm thick axial iterative multiplanar reconstructions (MPR, ADMIRE 3, BL57 lung kernel) were retrieved from the Picture Archiving and Communication System and analyzed using commercially available cloud-based AI software (xAID version 1.0.0, xAID Barcelona LLC, Spain) consisting of 11 functional modules totaling 12 functions (pleural effusion and pneumothorax modules are represented by a single network). Each module was developed based on AI-driven technology and implemented as a sequential image-processing pipeline. Individual modules could incorporate one or more AI models serving distinct diagnostic or analytical purposes, as well as auxiliary software components responsible for various computational tasks, including the calculation of quantitative imaging parameters. The AI-generated outputs were subsequently processed and converted into human-interpretable formats, including annotated image series, structured text reports, and graphical representations (Secondary Capture and Summary). We chose to perform the software analysis using 3 mm reconstructions instead of 1 mm ones to minimize data transfer and processing times.
Finally, the complete CCT images sets, comprising 1 mm and 3 mm series reconstructed with an iterative ADMIRE 3 reconstruction algorithm, using both soft tissue (BR38) and lung (BL57) kernels, were reviewed by two experienced radiologists (MB and BP) in consensus on a commercially available workstation (Syngo.via, Siemens). Additional MPR and maximum intensity projection reconstructions were performed on the workstation by the readers when needed. The readers were asked to assess the presence or absence of the same 12 findings, and this was considered the ground truth for the study.
Statistical analysis
Continuous variables were expressed as mean ± standard deviation or as medians with interquartile ranges, depending on distribution normality. Categorical variables were summarized as proportions and percentages.
Categorical outcomes were paired at the case level, comparing diagnostic classifications obtained with and without AI assistance for the same set of examinations. The McNemar test was applied to evaluate differences in paired binary outcomes (e.g., correct vs. incorrect classification relative to the ground truth).
Diagnostic performance metrics (sensitivity, specificity, positive predictive value, and negative predictive value) were calculated with 95% confidence intervals using the Wilson score method, which provides robust estimates for moderate sample sizes [14]. A c2 value of 3.84 (1 degree of freedom) was used as the threshold for statistical significance (p < 0.05).
Results
A detailed summary of the description and prevalence of the 12 considered findings in the original radiology reports, in the AI evaluation, and in the experienced radiologists re-evaluation is provided in Table 1.
Table 1
Results regarding the description of the considered imaging findings and their prevalence according to the original reports, according to software evaluation, and after computed tomography image revision (ground truth)
In the original reports, a comparison with prior CCT scans was performed in 38 out of 90 cases (42.2%), while no prior CCT scans were available in the remaining 52 cases (57.8%). The frequency of reported findings ranged from 96.7% for pleural effusion to 5.6% for pulmonary artery dilatation. Among the described findings, the proportion of positive cases ranged from 100% for emphysema to 11.4% for pericardial effusion.
The diagnostic performance, measured in terms of sensitivity, specificity, positive predictive value, and negative predictive value, of both the original radiology reports and the AI software in detecting the 12 imaging findings, as compared to the expert radiologist-defined reference standard, is summarized in Table 2, along with the results of the statistical comparison between the two approaches. The AI software demonstrated non-inferior performance to the original reports across all findings, except for emphysema. The AI software showed significantly higher sensitivity in detecting coronary artery calcifications, aortic dilatation, and pulmonary artery dilatation, whereas the original radiology reports exhibited significantly higher specificity for lung emphysema, coronary arteries calcifications, pulmonary artery dilatation, vertebral fractures, and rib fractures (p < 0.05).
Table 2
Diagnostic performance of original reports and AI in the evaluation of the 12 imaging findings in comparison to experienced radiologists’ re-evaluation (ground truth)
| Finding | Sensitivity (95% CI), % | Specificity (95% CI), % | Positive predictive value (95% CI), % | Negative predictive value (95% CI), % | McNemar’s coefficient | ||||
|---|---|---|---|---|---|---|---|---|---|
| Original report | AI | Original report | AI | Original report | AI | Original report | AI | ||
| Lung nodules | 77.8 (61.9-88.3) | 69.4 (53.1-82.0) | 83.3 (71.3-91.0) | 94.4 (84.9-98.1) | 75.7 (59.9-86.6) | 89.3 (72.8-96.3) | 84.9 (72.9-92.1) | 82.3 (71.0-89.8) | 1.00 |
| Lung opacification | 86.7 (73.8-93.7) | 100.0 (92.1-100.0) | 88.9 (76.5-95.2) | 71.1 (56.6-82.3) | 88.6 (76.0-95.0) | 77.6 (65.3-86.4) | 87.0 (74.3-93.9) | 100.0 (89.3-100.0) | 0.39 |
| Lung emphysema* | 60.0 (35.7-80.2) | 33.3 (15.2-58.3) | 94.7* (87.1-97.9) | 1.3* (0.2-7.2) | 69.2* (42.4-87.3) | 6.3* (2.7-14.0) | 92.2* (84.0-96.4) | 9.1* (1.6-37.7) | 0.09 |
| Coronary calcium* | 25.5* (15.3-39.5) | 93.6* (82.8-97.8) | 95.3* (84.5-98.7) | 65.1* (50.2-77.6) | 85.7 (60.1-96.0) | 74.6 (62.2-83.9) | 53.9 (42.8-64.7) | 90.3 (75.1-96.7) | 8.02** |
| Aortic dilatation* | 27.3* (9.7-56.6) | 100.0* (74.1-100.0) | 92.4 (84.4-96.5) | 88.6 (79.7-93.9) | 33.3 (12.1-64.6) | 55.0 (34.2-74.2) | 90.1 (81.7-94.9) | 100.0 (94.8-100.0) | 1.09 |
| Pulmonary trunk dilatation | 14.3* (5.0-34.6) | 100.0* (84.5-100.0) | 100.0* (94.7-100.0) | 84.1* (73.7-90.9) | 100.0 (43.8-100.0) | 65.6 (48.3-79.6) | 79.3 (69.6-86.5) | 100.0 (93.8-100.0) | 1.69 |
| Pleural effusion | 89.7 (73.6-96.4) | 96.6 (82.8-99.4) | 100.0 (94.1-100.0) | 100.0 (94.1-100.0) | 100.0 (87.1-100.0) | 100.0 (87.9-100.0) | 95.3 (87.1-98.4) | 98.4 (91.4-99.7) | 1.00 |
| Pericardial effusion | 100.0 (43.8-100.0) | 66.7 (20.8-93.9) | 94.3 (87.2-97.5) | 98.9 (93.8-99.8) | 37.5 (13.7-69.4) | 66.7 (20.8-93.9) | 100.0 (95.5-100.0) | 98.9 (93.8-99.8) | 1.80 |
| Pneumothorax | 100.0 (34.2-100.0) | 100.0 (34.2-100.0) | 97.7 (92.1-99.4) | 100.0 (95.8-100.0) | 50.0 (15.0-85.0) | 100.0 (34.2-100.0) | 100.0 (95.7-100.0) | 100.0 (95.8-100.0) | 2.00 |
| Compression fracture* | 57.1 (32.6-78.6) | 100.0 (78.5-100.0) | 97.4* (90.9-99.3) | 21.1* (13.4-31.5) | 80.0* (49.0-94.3) | 18.9* (11.6-29.3) | 92.5 (84.6-96.5) | 100.0 (80.6-100.0) | 42.25** |
| Rib fracture | 50.0 (18.8-81.2) | 100.0 (61.0-100.0) | 100.0* (95.6-100.0) | 59.5* (48.8-69.4) | 100.0* (43.8-100.0) | 15.0 (7.1-29.1) | 96.6 (90.3-98.8) | 100.0 (92.9-100.0) | 25.97** |
| Adrenal mass | 0.0 (0.0-49.0) | 75.0 (30.1-95.4) | 96.5 (90.2-98.8) | 95.3 (88.6-98.2) | 0.0 (0.0-56.2) | 42.9 (15.8-75.0) | 95.4 (88.8-98.2) | 98.8 (93.5-99.8) | 0.00 |
Discussion
This study evaluated the potential benefits of using AI software for interpreting 90 unenhanced CCT scans acquired in an emergency setting. The findings demonstrated that the AI software achieved an overall diagnostic performance that was non-inferior to that of radiologists operating under high workload conditions. Notably, the software exhibited superior sensitivity in detecting ancillary findings, including coronary artery calcifications, aortic dilatation, and pulmonary artery dilatation, although it showed lower specificity for other imaging features.
Radiology reports generated in emergency contexts are generally more concise than those produced in elective settings. In our series, 8 out of the 12 evaluated findings – specifically, emphysema, coronary artery calcifications, aortic dilatation, pulmonary artery dilatation, pneumothorax, vertebral fractures, rib fractures, and adrenal masses – were documented in fewer than 50% of the original radiology reports. In most cases, these omissions corresponded to the actual absence of the findings on computed tomography (CT) imaging. However, the underreporting of certain ancillary findings may carry implications for a patient’s long-term clinical management and future health outcomes. Consequently, the use of AI-based software might improve the rate of description of ancillary findings [15].
Conversely, emergency-related findings, namely lung opacifications, pleural effusion, pericardial effusion, and pneumothorax, were reported with excellent sensitivity (86.7% to 100%) and specificity (88.9% to 100%) by radiologists in the original reports. For this task, AI software showed non-inferior performance compared to the original readers, as already demonstrated in a previously published paper [16], and might be helpful for radiologists with limited experience.
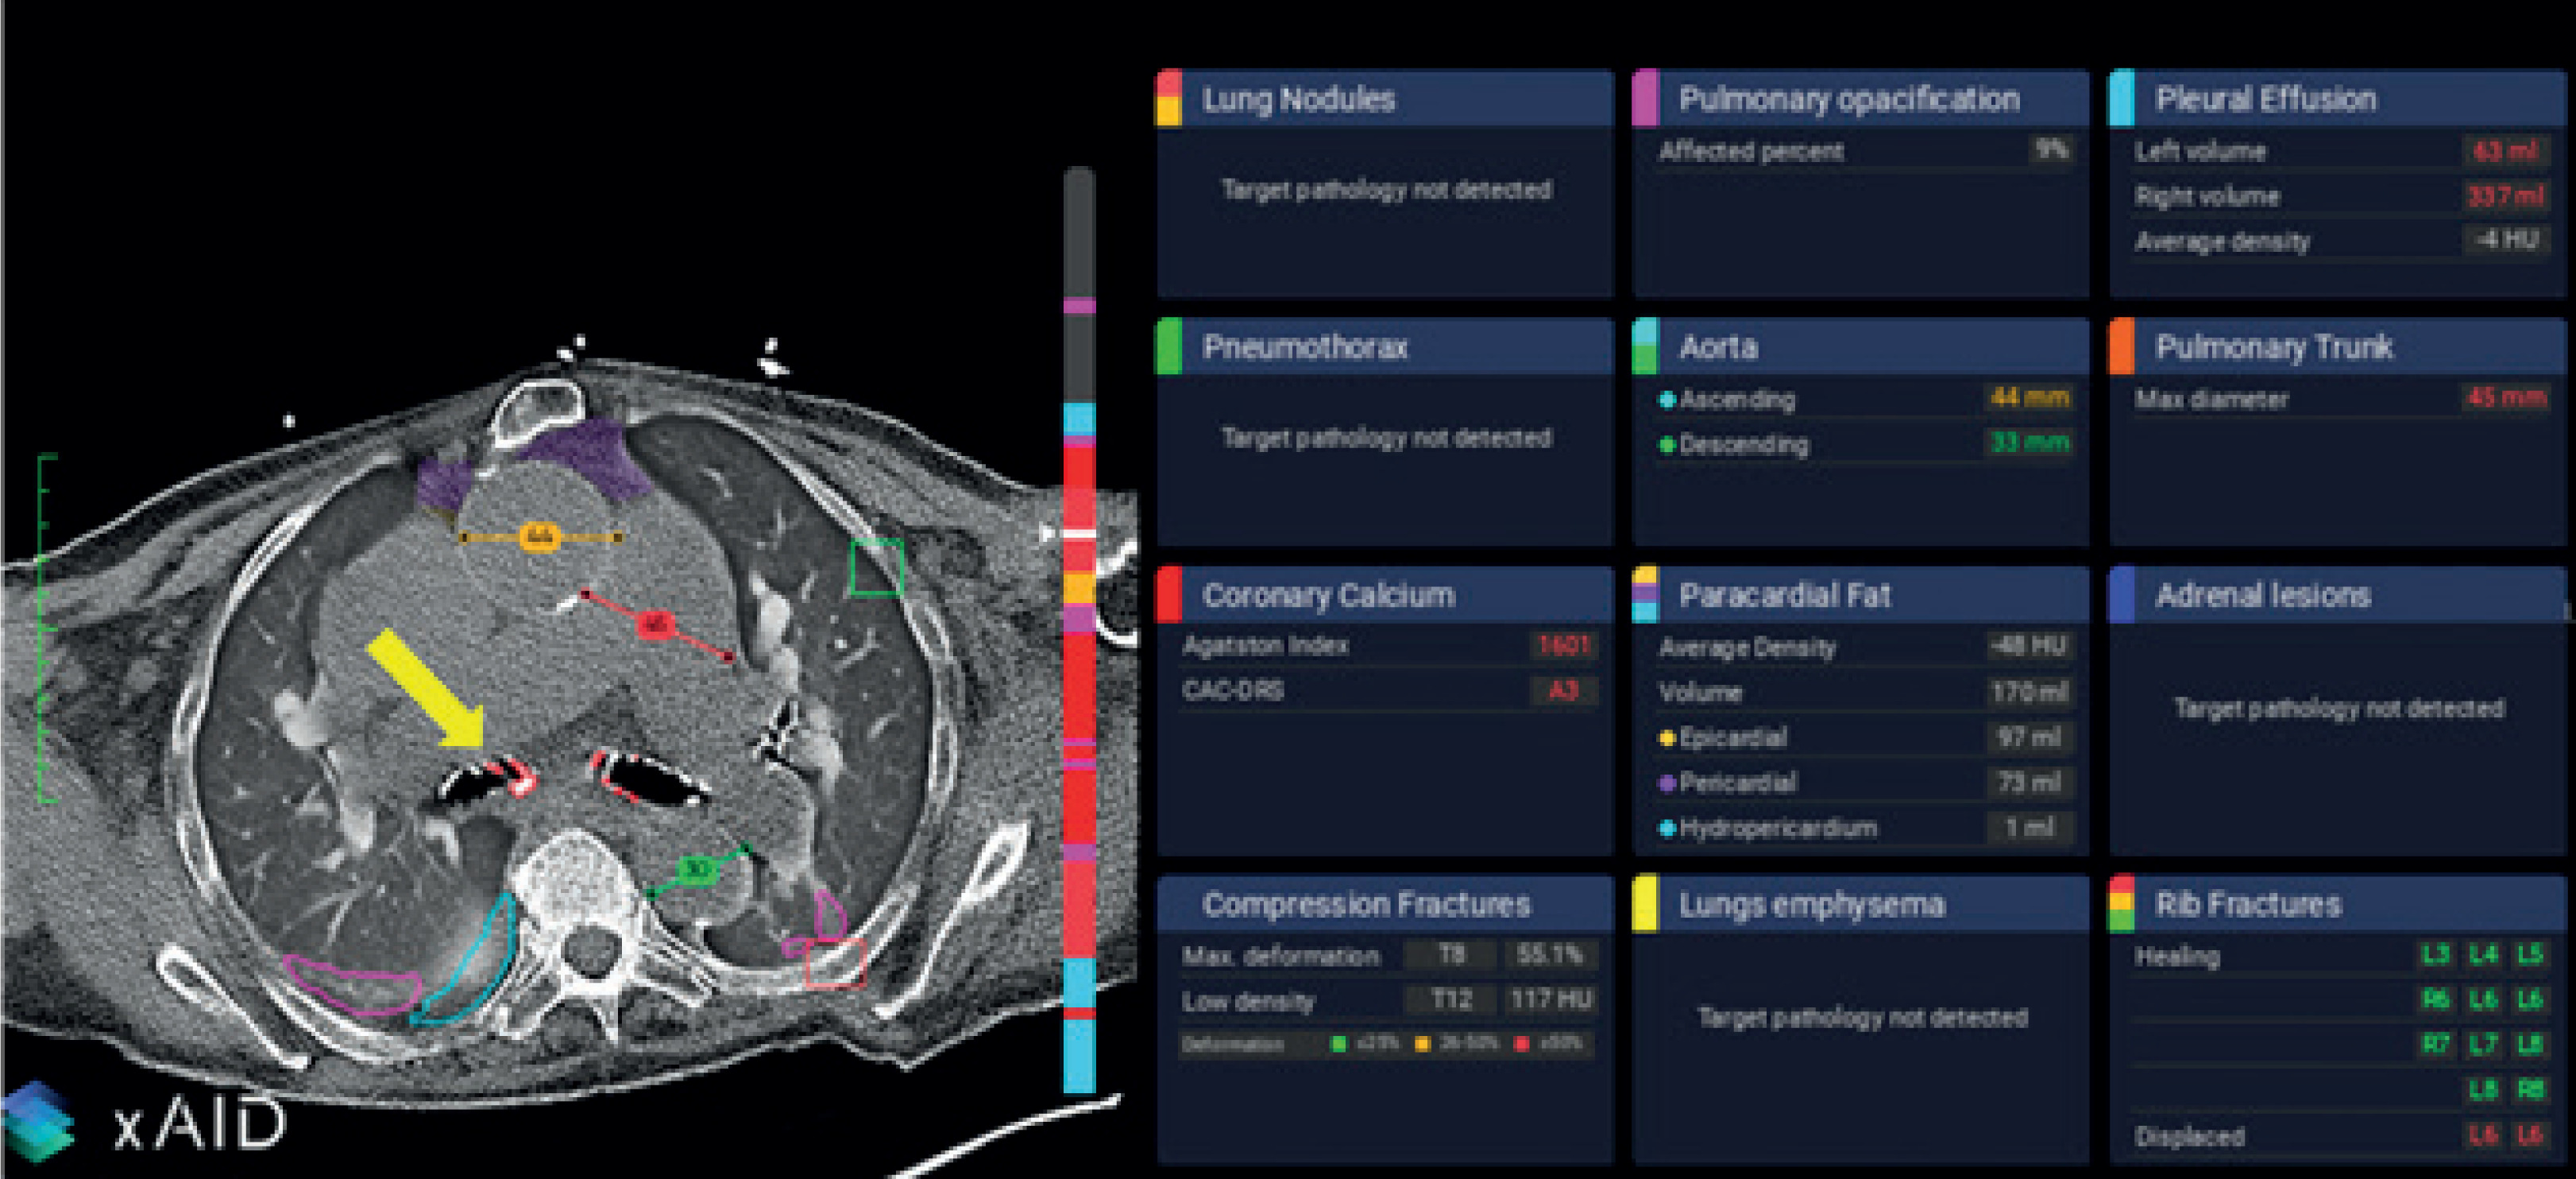
Previous studies have already demonstrated that AI software can accurately segment thoracic vessels and assess their diameters [17–19]. A dilated pulmonary trunk may serve as a marker for pulmonary hypertension, with sensitivity and specificity varying according to the selected threshold used [20–22]. In our cohort, experienced radiologists identified a dilated pulmonary trunk, using a cutoff value of 32 mm, in 21 out of 90 cases (23.3%). In comparison, pulmonary trunk dilatation was reported in only 3 out of 90 cases (3.3%) in the original radiology reports. The AI software, which applied a cutoff value of 29 mm, detected this finding in 32 out of 90 cases (35.6%) (Figure 1). Accordingly, the use of AI software increased sensitivity from 14.3% to 100%, albeit with a corresponding reduction in specificity from 100% to 84.1%.
Figure 1
Example of software output. In this image, ascending aorta dilatation (orange line), pulmonary trunk dilatation (red line), lung opacifications (pink lines), and intrascissural pleural effusion (light blue line) are correctly highlighted. On the other hand, bronchial calcifications (yellow arrow) are incorrectly interpreted as coronary calcifications
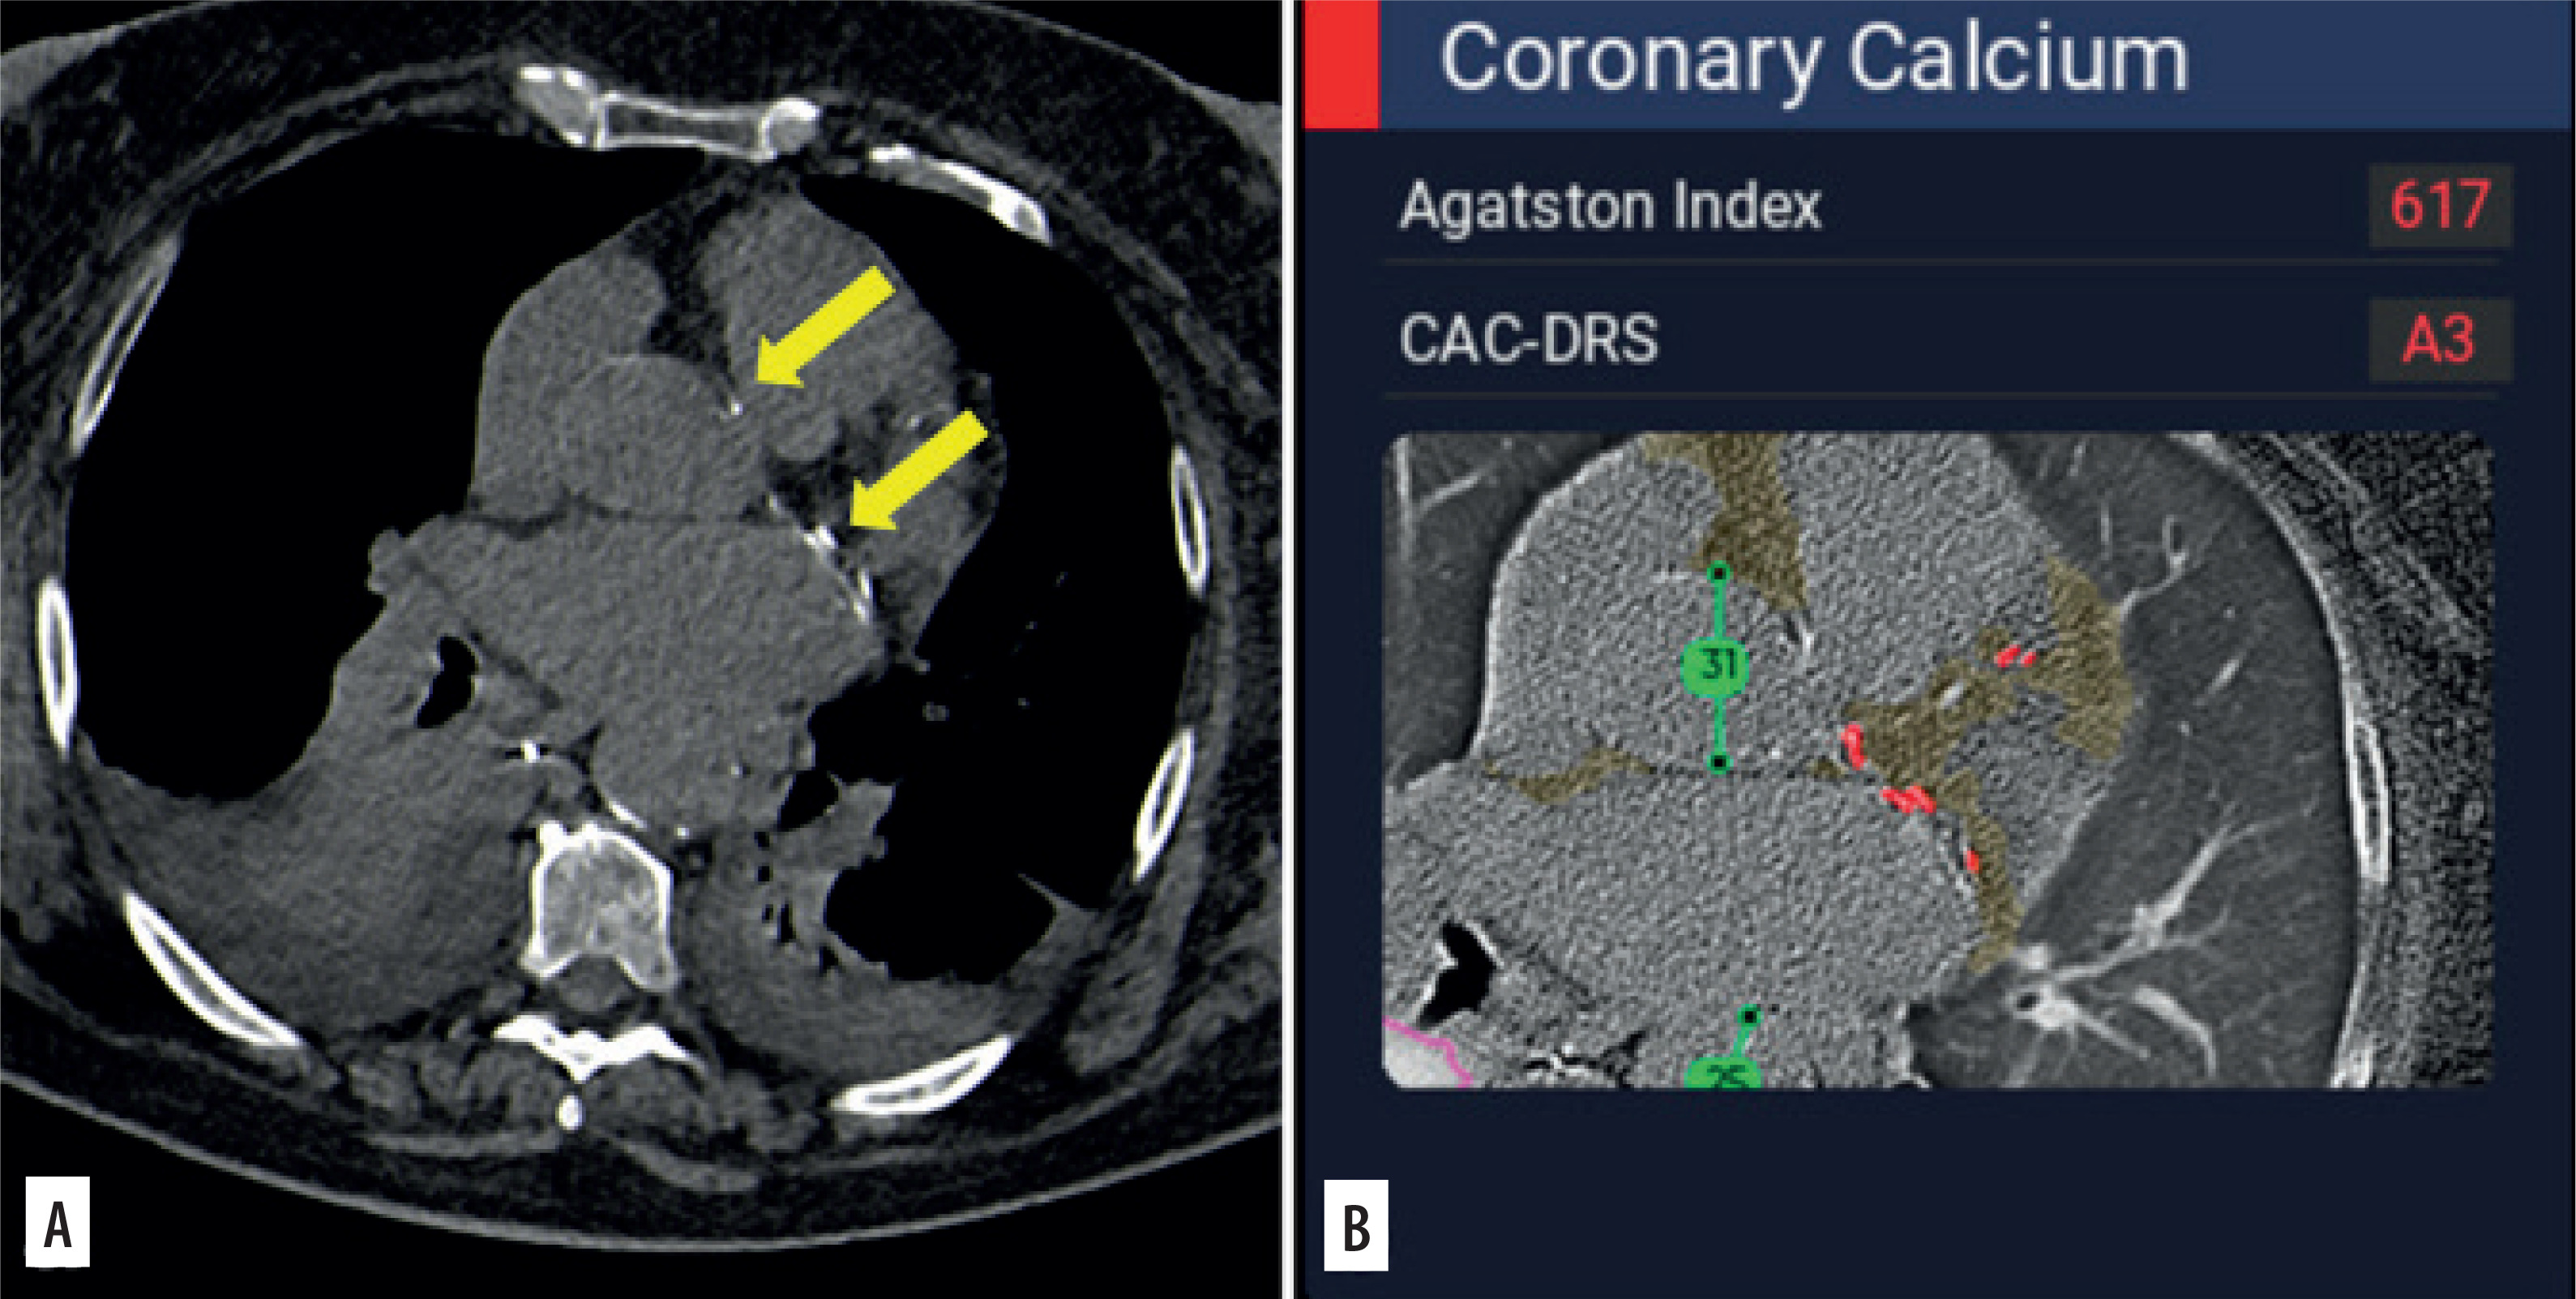
Similarly, prior research has shown that AI algorithms can detect coronary artery calcifications with high accuracy on non-cardiac-gated CT scans [23]. In our study, expert radiologists identified relevant coronary artery calcifications in 47 out of 90 cases (52.2%). In contrast, coronary calcifications were reported in 14 cases (15.6%) in the original radiology reports, while the AI software detected them in 59 cases (65.6%) (Figure 2). Accordingly, the use of AI software increased sensitivity from 25.5% to 93.6%, although this was accompanied by a decrease in specificity from 95.3% to 65.1%, mainly because of misinterpretation of other mediastinal calcifications (Figure 1).
Figure 2
On the 3 mm thick axial image reconstructed using a soft tissue kernel (A), coronary calcifications are recognizable in this patient with bilateral pleural effusions and pulmonary opacifications. Coronary calcifications were overlooked in the original report, whereas the software (B) correctly highlighted them (red dots)
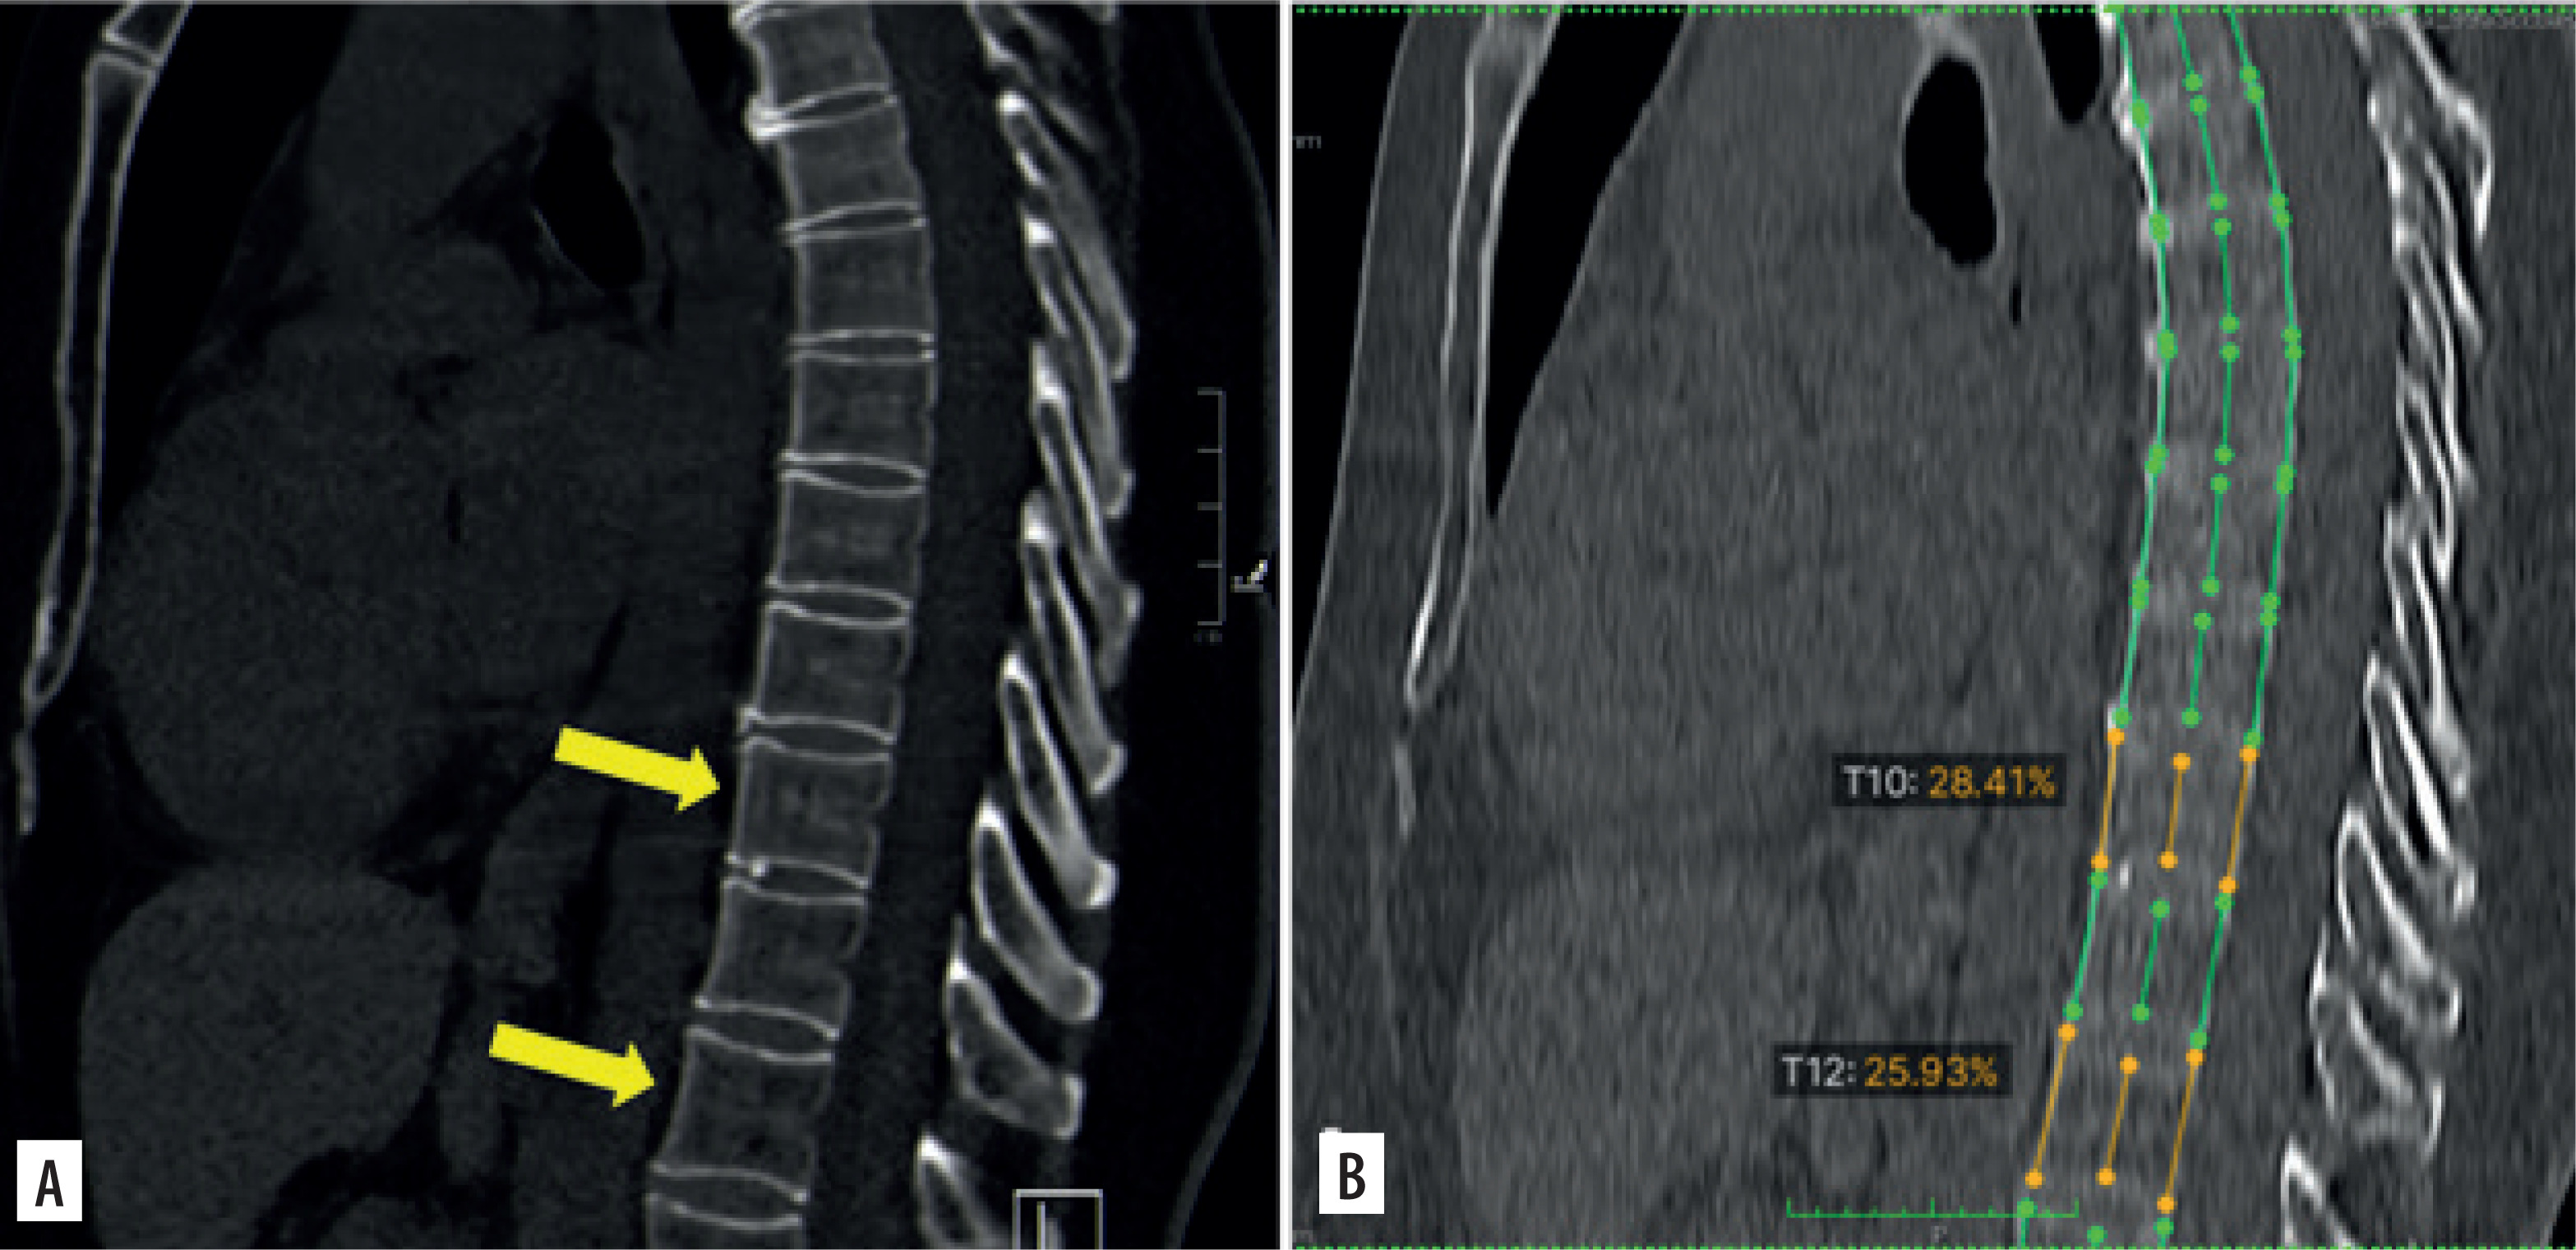
The AI software demonstrated excellent sensitivity in detecting vertebral and rib fractures (Figure 3), achieving 100% sensitivity for both. These findings confirm the excellent results reported by Zhou et al. [24] and Spangeus et al. [25], as well as those described in a recently published systematic review in which AI was able to detect rib fractures with a pooled sensitivity of 0.853 [26]. On the other hand, in our series, AI specificity was significantly lower (21.1% for vertebral fractures and 59.5% for rib fractures) compared to the literature [27,28]. The suboptimal specificity observed in our study may be attributed to the use of 3 mm thick axial reconstructions with a lung kernel, which may have negatively affected the software’s ability to accurately depict fractures, as already demonstrated for the detection of coronary calcifications [29] (Figure 4).
Figure 3
On the 1 mm thick axial image reconstructed using a soft tissue kernel (A), an acute fracture is recognizable on the left side (arrow), whereas healed fractures are appreciable contralaterally. The software (B) correctly identified the left acute fracture, categorizing it as a dislocated fracture (red boxes), but it also misclassified the right-sided healed fractures as non-dislocated fractures (green boxes). No acute fractures were reported in the original report
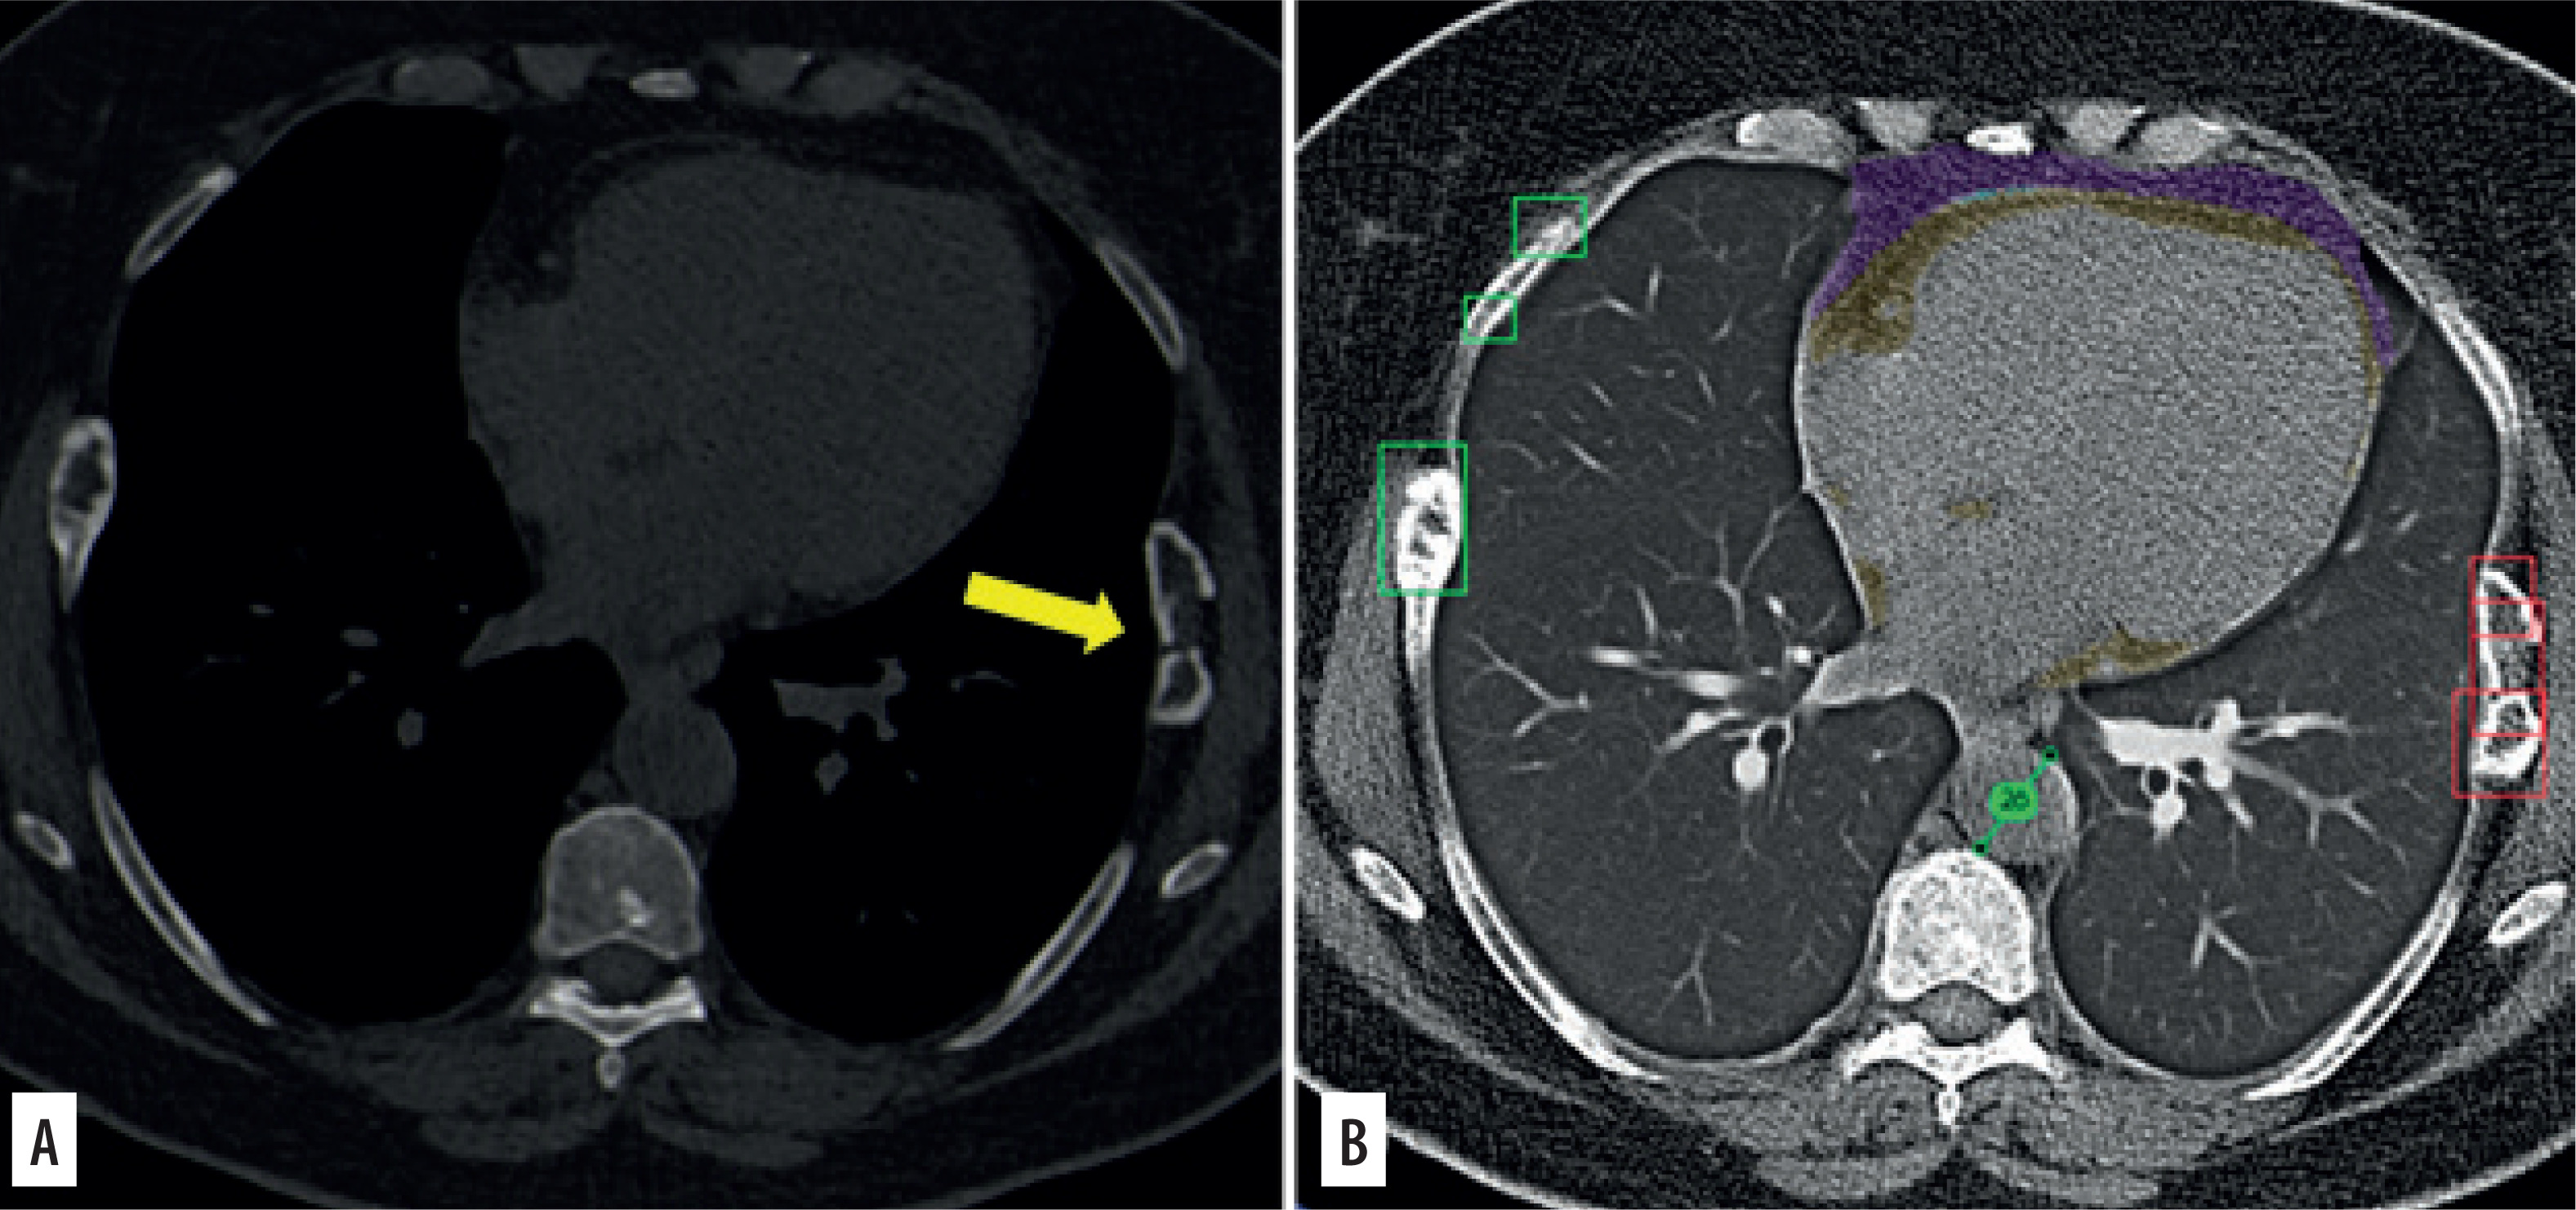
Figure 4
On the 3 mm thick sagittal MPR image (A) no vertebral fractures are recognizable, whereas the software wrongly indicated the presence of two vertebral fractures (orange lines). Note the poor image quality of the sagittal reconstruction created by the software using the 3 mm thick axial series reconstructed with a lung kernel
For lung nodule detection, the AI software demonstrated diagnostic performance comparable to that of the original readers, with a sensitivity of 69.4% and specificity of 94.4%. These results are consistent with previously reported values in patients with complex lung diseases [30] and in a recently published systematic review [31]. Conversely, the performance of AI in evaluating lung emphysema was unsatisfactory, with a sensitivity of 33.3% and specificity of 1.3%, significantly lower than values reported in the literature [32]. Improvements in the algorithm are needed to enhance its diagnostic accuracy for emphysema evaluation.
Our study has several limitations, primarily related to its retrospective design. First, the use of 3 mm reconstructions for software analysis might have reduced its diagnostic performance; further research is warranted to investigate potential differences in software performance when using thin versus thick slices. Second, CCT scans were acquired using two different scanners; however, as the reconstruction algorithms and kernels were identical, this should not have influenced the results.
Third, we did not evaluate the impact of the additional findings identified by the software on patient management, as this was beyond the scope of the present study.
Conclusions
Our study demonstrated that AI software may assist radiologists in emergency settings by improving the detection of potentially relevant ancillary findings on unenhanced CCT scans. Moreover, its diagnostic performance for acute findings was non-inferior to that of radiologists working under real-world, high-pressure conditions. On the other hand, the use of thick slices for software analysis, aimed at speeding up the workflow, should be discouraged, as it may reduce accuracy in the evaluation of bone findings.