Introduction
Magnetic resonance imaging (MRI) has become an indispensable tool in the study and management of neurological diseases. This imaging technique not only allows for the visualisation of brain structures but also enables quantitative assessments of brain volume changes associated with various neurological conditions, thereby providing crucial insights into disease progression and potential therapeutic interventions [1]. Specifically, magnetic resonance (MR) volumetry plays a key role in identifying atrophy patterns associated with clinical symptoms in disorders like multiple sclerosis (MS), Alzheimer’s disease (AD), and hippocampal sclerosis, aiding in the development of biomarkers for early diagnosis and treatment monitoring [2].
Volumetric MRI techniques further enhance diagnostic and research capabilities by combining 3D T1, 3D T2, and 3D fluid-attenuated inversion recovery (FLAIR) sequences, each of which highlights unique relaxation properties in brain tissue [3]. T1 relaxation measures the recovery of longitudinal magnetisation, whereas T2 relaxation characterises the decay of transverse magnetisation – both reflecting how tissue composition and molecular interactions influence signal intensity [4,5].
3D T1 and 3D T2 sequences therefore capture complementary aspects of tissue structure, enabling detailed differentiation between grey matter, white matter, and other anatomical features [6]. The 3D FLAIR sequence further refines lesion detection by suppressing cerebrospinal fluid (CSF) signals, making periventricular or cortical abnormalities (such as MS lesions) more conspicuous than on standard T2-weighted images [7,8]. Collectively, these imaging sequences optimise volumetric mapping of subtle pathological alterations, thereby enhancing the accuracy of disease monitoring and progression assessment. Ultimately, optimising sequence parameters for each modality is crucial, as fine-tuning system sensitivity and imaging protocols ensures more accurate tissue differentiation [9] (Figure 1).
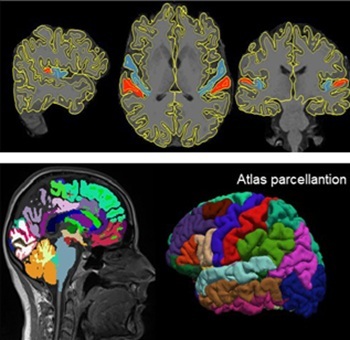
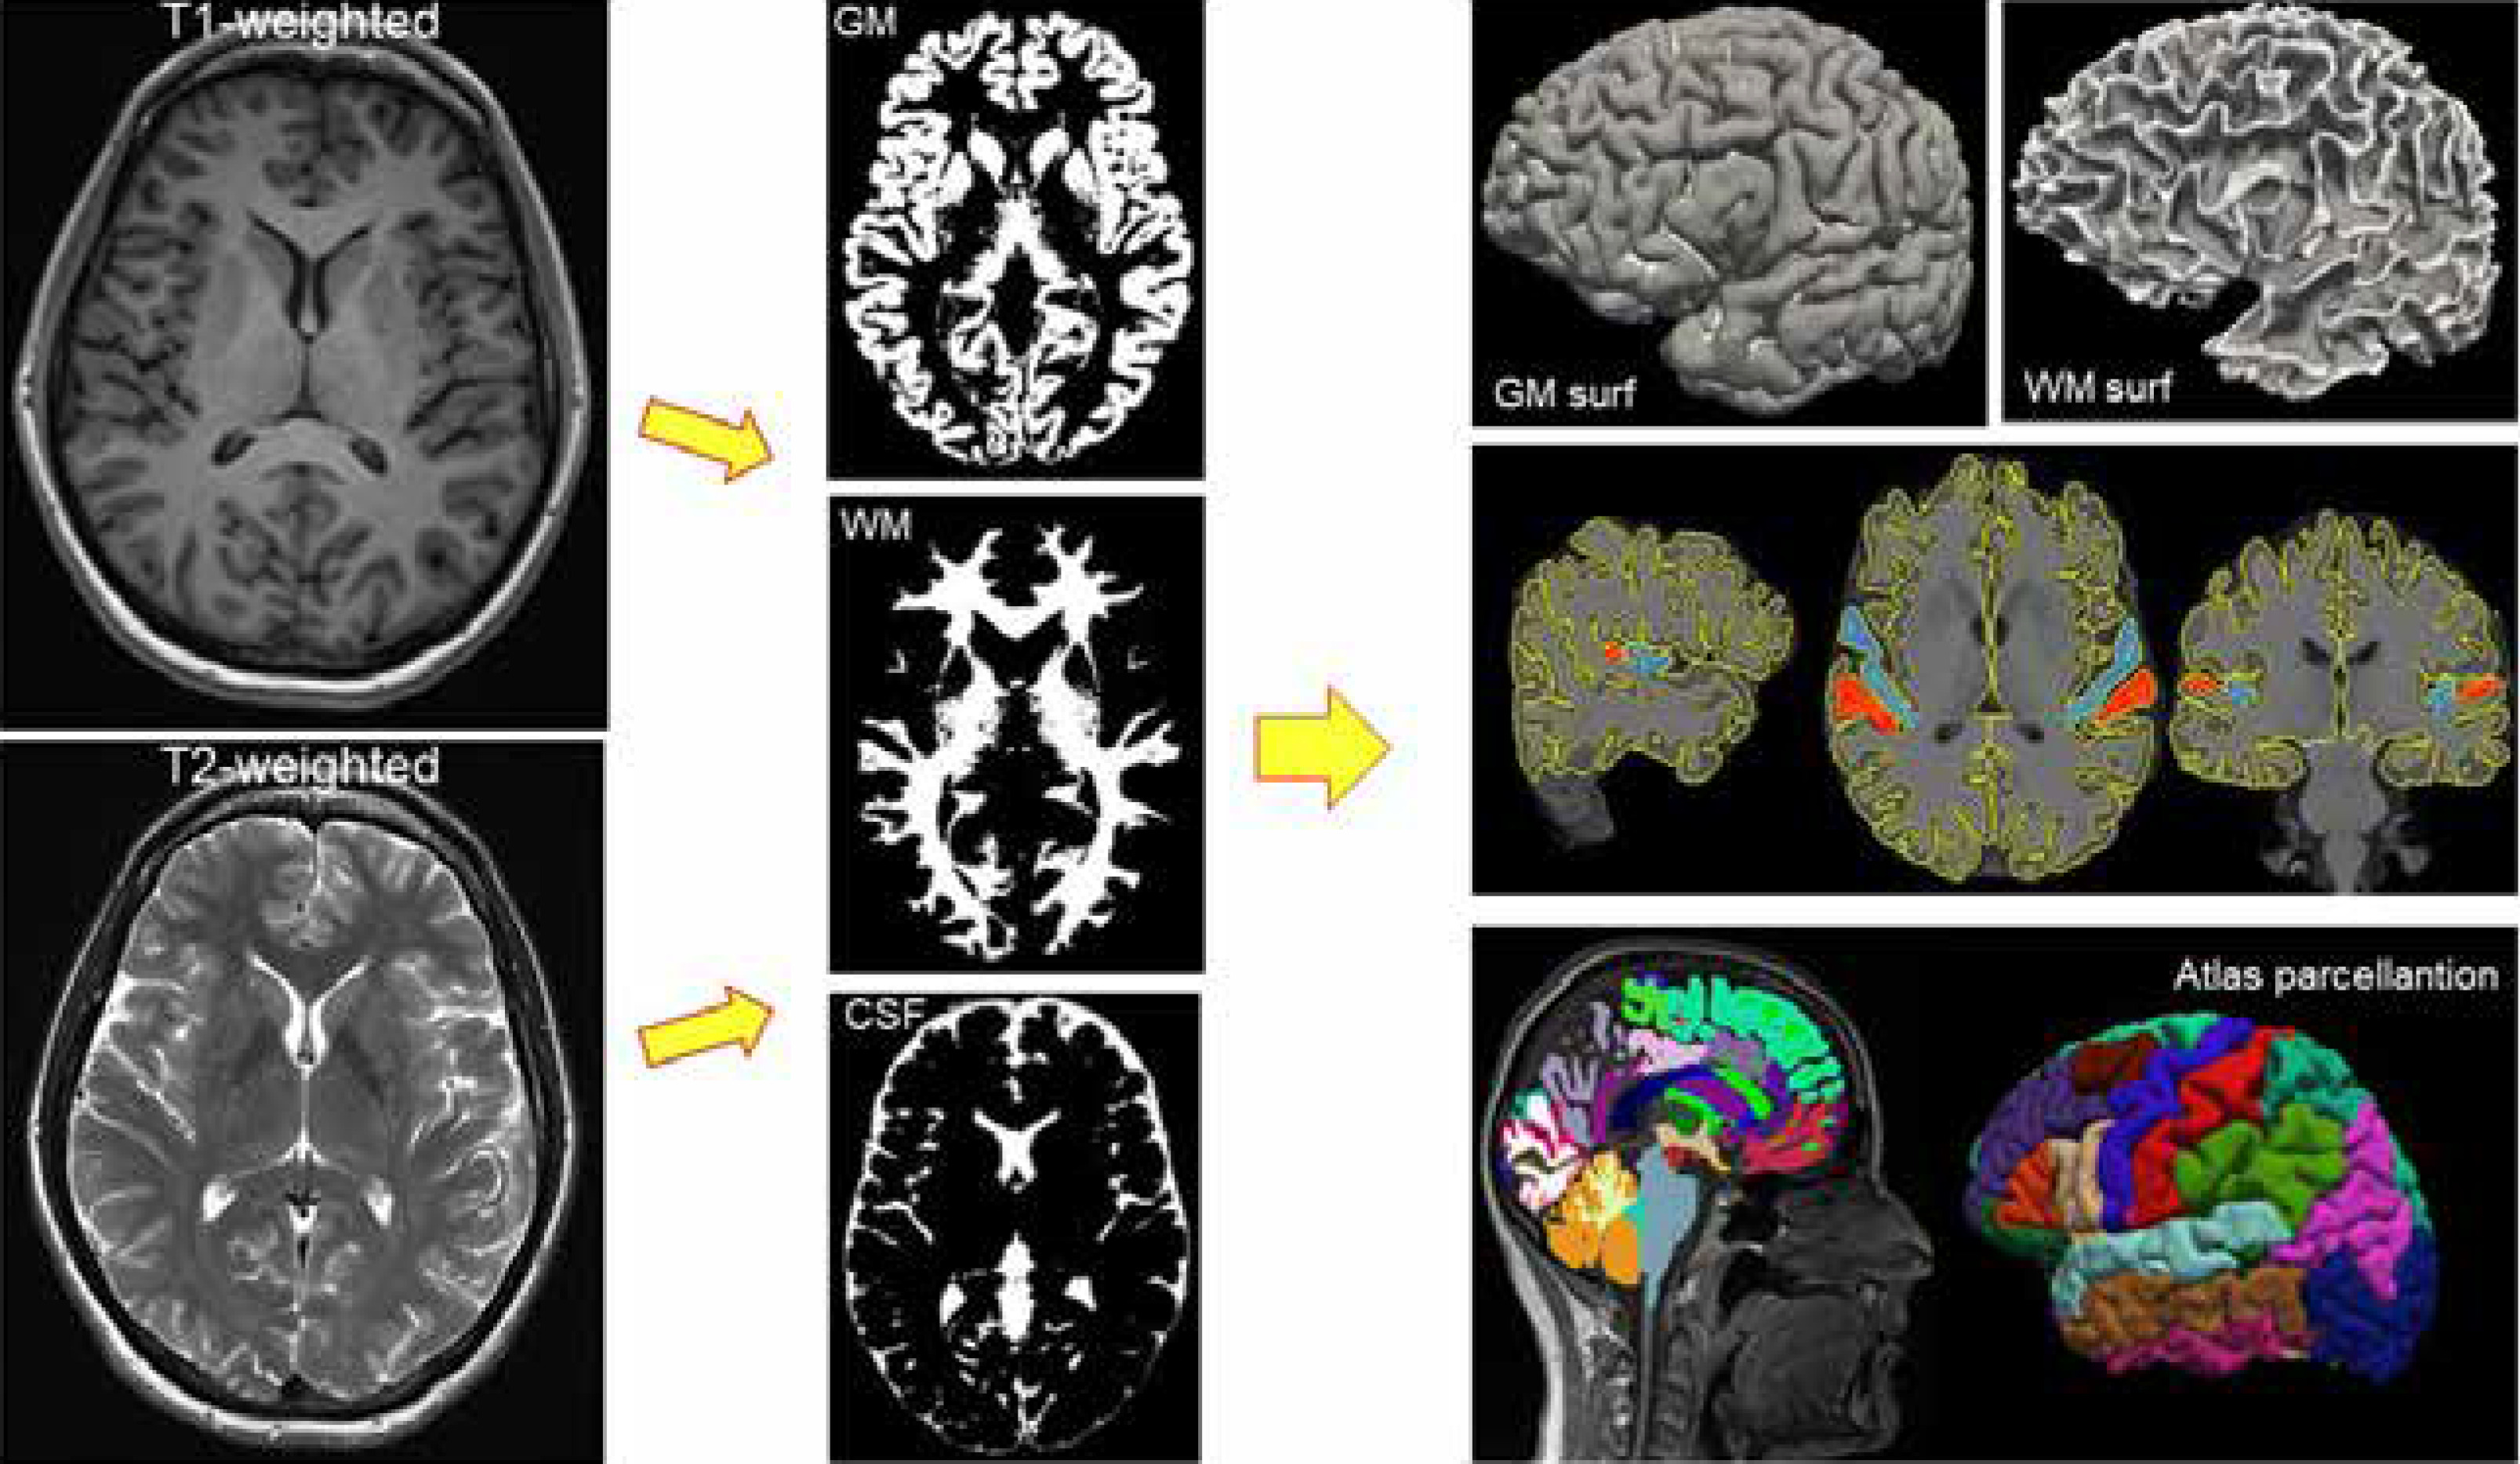
Figure 1
T1-weighted and T2-weighted images are segmented into grey matter, white matter, and cerebrospinal fluid (middle column). The grey matter surface or white matter surface of the brain (upper right corner) can then be reconstructed on this basis. The middle image on the right shows the boundaries of tissue segmentation (WM, GM) and an example of manual parcellation of Heschl’s gyri. The bottom right image shows brain parcellation based on an anatomical atlas matched to the subject’s brain
Alzheimer’s disease
Magnetic resonance volumetry has emerged as a crucial imaging tool in AD, providing essential insights into structural brain changes associated with disease onset, progression, and severity [10]. AD, the most prevalent form of neurodegenerative dementia, is characterised by progressive neurodegeneration and subsequent brain atrophy, primarily affecting specific brain regions critical for memory and cognitive functions [11]. Volumetric MRI enables clinicians and researchers to objectively measure brain volumes, capturing subtle changes not easily identified through conventional qualitative imaging assessments [12].
Brain volume loss (BVL) in Alzheimer’s patients occurs significantly faster than normal age-related atrophy, with annual global volume reductions averaging approximately 1.5-2.5%, compared to roughly 0.1-0.3% in healthy older adults [13,14]. Regional analyses consistently demonstrate marked atrophy in structures critically involved in cognitive processes, notably the hippocampus, entorhinal cortex, and temporal lobes [15]. Hippocampal atrophy is especially significant in AD, with annual volume reductions of approximately 4-6%, far exceeding the minimal annual reduction (~0.5-1%) observed during healthy aging [16,17]. Such pronounced hippocampal atrophy directly correlates with episodic memory deficits, one of the earliest and most characteristic clinical symptoms of AD [18].
Additionally, regions such as the entorhinal cortex, amygdala, and medial temporal lobes exhibit considerable volume reductions, reflecting the pathological spread of neurofibrillary tangles and amyloid plaques [19]. These anatomical alterations are closely associated with impairments in cognitive domains beyond memory, including language, attention, visuospatial skills, and executive function [20]. The capability of volumetric MRI to detect these early and region-specific changes enhances its utility as a diagnostic biomarker, facilitating earlier and more accurate identification of individuals at risk for AD.
Moreover, volumetric MRI plays a vital role in monitoring disease progression, evaluating therapeutic efficacy, and predicting cognitive decline. Longitudinal assessments provide quantifiable markers that enable clinicians to track disease evolution and assess the effectiveness of interventions aimed at slowing or preventing neurodegeneration. By precisely measuring global and regional brain atrophy, volumetric MRI significantly enhances the clinical understanding of AD pathology, ultimately supporting improved patient management and aiding in the development of more effective therapies [21].
Multiple sclerosis
Magnetic resonance volumetry has proven to be an invaluable tool in the diagnosis and management of MS [22]. It distinguishes MS from other conditions with similar clinical presentations and detects global and regional brain volume changes that are often missed by conventional imaging [22-24]. Detecting these changes early in the disease process is critical because prompt diagnosis can significantly improve treatment outcomes. In practice, integrating volumetric data with lesion mapping and clinical evaluations enhances overall diagnostic accuracy and allows treatment plans to be tailored to each individual [25]. Beyond its diagnostic role, MRI volumetry is pivotal for monitoring disease progression. In relapsing-remitting MS (RRMS), brain volume loss (BVL) occurs at a markedly accelerated rate of approximately 1.24% per year compared with only 0.1-0.3% in age-matched healthy individuals [26,27]. On average, patients receiving first-generation, disease-modifying treatments (DMTs) or no DMT lose about 0.7% of their brain volume annually. This rapid loss is a key predictor of future disability and cognitive impairment [28]. Volumetric assessments reveal that both grey and white matter undergo significant atrophy in MS. Grey matter loss, particularly in regions such as the prefrontal cortex, temporal lobes, and parietal lobes, correlates strongly with deficits in learning, memory, attention, processing speed, and visuospatial abilities [29,30]. White matter atrophy, notably in structures like the corpus callosum and corticospinal tracts, reflects the underlying demyelination and axonal degeneration that lead to motor impairments, including spasticity and gait disturbances [31,32]. Even during the clinically isolated syndrome (CIS) phase, early volume loss is evident, in stark contrast to the minimal, age-related cortical thinning observed in healthy adults [33,34].
Comparisons between MS patients and healthy controls (HC) underscore these differences. While normal aging may cause minor BVL especially in areas like the prefrontal cortex and hippocampus, MS patients experience a far more rapid and widespread decline. This accelerated atrophy is directly linked to the cognitive and motor symptoms characteristic of MS [35].
The application of MRI volumetry in MS offers a comprehensive understanding of the disease’s structural brain changes by measuring both global and regional atrophy in grey and white matter. This makes volumetric MRI a critical tool for early diagnosis, disease monitoring, and evaluating therapeutic outcomes. However, achieving reliable assessments requires addressing several technical factors [35]. For instance, repeated scans within a short timeframe or even on the same day can help mitigate inaccuracies from patient movement or image interpolation. Additionally, non-linearities in the gradient coil may introduce distortions causing certain brain regions to appear compressed or stretched, which can be corrected using phase mapping techniques. Longitudinal assessments must also consider natural variability in brain volume due to factors like hydration status [36,37]. Finally, segmentation quality is influenced by technical aspects such as MRI coil type, signal homogeneity correction filters, and voxel size, all of which affect the signal-to-noise ratio (SNR). Optimising these variables is crucial for maximising the accuracy and clinical utility of MRI volumetry in both MS research and patient management [36].
Myotonic dystrophy type 1 and type 2
Myotonic dystrophy (lat. dystrophia myotonica – DM) is a complex, multisystemic genetic disorder characterised by progressive muscle wasting and weakness, cardiac abnormalities, and cognitive impairment [38]. There are two main subtypes of the disease: DM type 1 and DM type 2 [39]. Recent studies have utilised advanced MRI techniques, such as volumetric analysis, to investigate the nature and extent of neuroanatomical alterations in DM. Both forms of the disease lead to notable changes in brain structure, although the degree and regions of impact differ significantly between DM1 and DM2 [40]. In DM1, extensive brain atrophy is prominent, with both grey and white matter volume significantly reduced compared to controls. Key regions affected include the prefrontal cortex, temporal lobes, and anterior cingulate cortex [41,42]. This correlates with cognitive and behavioural deficits such as impaired executive function [43]. Additionally, subcortical structures such as the thalamus and hippocampus, which are crucial for memory processing, also exhibit notable atrophy in DM1 patients, further explaining the observed cognitive disturbances [41].
In contrast, DM2 patients typically exhibit less extensive brain atrophy overall, with more localised structural changes observed primarily in specific regions of the cerebellum [41]. Volumetric reductions in cerebellar structures are associated with the motor symptoms commonly seen in DM2 [44]. Grey and white matter changes in DM2 tend to be more subtle and regionally restricted compared to DM1 [45]. White matter abnormalities in DM2 usually manifest as focal hyperintensities predominantly located in periventricular and frontal areas, as opposed to the broader, more diffuse white matter degeneration observed in DM1 [46,47]. These localised alterations have specific but less extensive implications for cognitive and motor functioning compared to the widespread degeneration seen in DM1 [45,48].
Compared to HC, both DM1 and DM2 show significant overall BVL. Notably, cortical thickness was markedly reduced in DM1 and DM2, with more pronounced atrophy observed in DM1, particularly in the frontal and occipital cortical regions. Furthermore, total grey matter volumes were noticeably lower in both DM groups than in HC, emphasising more extensive structural brain alterations in DM1 [44]. These findings underscore the necessity of continued research into the underlying pathophysiological mechanisms of DM.
Focal cortical dysplasia and hippocampal sclerosis
Focal cortical dysplasia and hippocampal sclerosis are recognised as key pathological conditions contributing to drug-resistant epilepsy [49]. These neurological conditions are characterised by structural abnormalities in the brain that can be detected using MRI [50].
Focal cortical dysplasia refers to a heterogeneous group of disorders marked by abnormal cortical development and disruption of the normal cortical layering and architecture [51]. In some cases, these malformations can be associated with focal neurological deficits, developmental delay, and intellectual disability, in addition to drug-resistant epilepsy [52]. Hippocampal sclerosis, on the other hand, involves atrophy and neuronal loss in the hippocampus, a critical structure for memory and learning [53].
Quantitative MRI methods, including volumetric analysis, are useful for objectively evaluating the structural alterations in the brain that are associated with these conditions. Identifying specific patterns of volumetric abnormalities can aid in the diagnosis of focal cortical dysplasia and hippocampal sclerosis, and potentially guide surgical planning for patients with medically refractory epilepsy [50,54]. Previous studies have shown that focal cortical dysplasia can manifest as a localised area of thickened or thinned cortex, with associated signal changes on MRI [55].
The presence of an MRI-visible lesion has been associated with a higher chance of drug-resistant epilepsy and increased likelihood of successful surgical intervention [56]. However, the sensitivity of conventional MRI for detecting focal cortical dysplasia can be limited, particularly for subtler or smaller lesions [57].
More recently, the use of high-field (7T) MRI has demonstrated improved detection of focal cortical dysplasia-like lesions compared to lower field strength scanners [58]. Similarly, hippocampal sclerosis can be reliably detected using quantitative MRI measures, such as hippocampal volume and signal intensity. Significant unilateral or asymmetric hippocampal atrophy and increased signal on T2-weighted imaging are typical findings associated with hippocampal sclerosis [59].
Quantitative MRI techniques provide objective measurements that significantly enhance the evaluation of brain abnormalities associated with focal cortical dysplasia and hippocampal sclerosis [60]. While volumetric MRI effectively identifies overall volume loss and increased signal intensity changes, its ability to capture subtle regional variations within complex structures can be limited [61]. Morphometric analysis complements volumetry by evaluating the precise shape and regional patterns of atrophy, especially within the hippocampus. This allows for a more precise evaluation of which hippocampal subregions such as the head, body, or tail are most affected, leading to more refined diagnostic conclusions and hypotheses regarding disease progression [62]. By integrating both volumetric and morphometric analyses, clinicians can obtain a more nuanced understanding of hippocampal pathology, enhancing the accuracy of epilepsy assessment and treatment planning [63].
Software programs for automatic brain volumetry
The accurate and reliable assessment of brain volume is a critical component of neuroimaging research and clinical practice. There are many programs for calculating brain volumetrics, and one of the most widely used is FreeSurfer, an open-source tool that processes T1-weighted MRI scans to provide detailed volumetric and cortical measurements [64]. FreeSurfer is particularly valuable in research settings due to its precise morphometric and cortical thickness analyses [65].
While FreeSurfer primarily relies on T1-weighted images for segmentation, incorporating additional sequences such as T2 or FLAIR can enhance the accuracy and reliability of the segmentation process [66]. Certain brain regions may be segmented differently depending on whether only T1 data are used or if T1 is combined with T2 or FLAIR, because these additional sequences provide complementary tissue contrast information [67]. Moreover, using multiple T1-weighted scans from the same individual can improve the signal-to-noise ratio, further increasing the reliability of segmentation and reducing potential artifacts [68]. By leveraging multimodal imaging, FreeSurfer can generate more precise volumetric assessments, which is particularly beneficial for studying subtle neuroanatomical changes in various neurological conditions [69].
Similarly, NeuroQuant, which is designed for clinical applications, utilises T1-weighted MRI along with FDA-approved AI algorithms to assess brain volumes, particularly in cases of AD and epilepsy, offering clinicians a streamlined, reliable diagnostic tool [70].
VolBrain software presents a cloud-based solution, processing T1-weighted MRI images quickly and efficiently [71]. This tool is accessible and convenient, catering to researchers and clinicians with an interest in rapid, automated volumetric data for specific age demographics [72].
AccuBrain, another advanced platform, is distinguished by its compatibility with multiple MRI protocols and its detailed, region-specific volumetric data, which are beneficial in diagnosing complex neurological conditions like MS [73]. Each of these platforms leverages T1-weighted MRI to generate precise volumetric measurements suitable for both research and clinical needs. However, they differ in accessibility, focus, and technological adaptability [74,75]. To delineate brain regions, these tools employ diverse segmentation strategies ranging from atlas-based registration to deformable models, enabling clinicians and researchers to measure specific structures for diagnostic and longitudinal assessments [76]. For example, FreeSurfer’s recon-all pipeline can derive subcortical segments and cortical surface parcellations that facilitate targeted analyses of regions like the hippocampus and amygdala [77]. Ongoing improvements in automated segmentation, notably with atlas-based methods, have reduced the labour and subjectivity of manual approaches [65]. Despite these advancements, conventional algorithms can struggle with complex pathologies [78]. Lesions or extreme anatomical variations may lead to segmentation errors, preventing successful delineation of tumour boundaries or other focal abnormalities. As a solution, AI-driven segmentation methods harness deep learning to distinguish pathological tissue more effectively [79,80]. By continuously learning from diverse imaging datasets, these newer approaches overcome many of the limitations of rule-based pipelines, leading to more reliable anomaly detection and improved diagnostic insights in conditions such as gliomas and other focal lesions [81].
Software tools for brain segmentation in MRI provide automated or semi-automated identification of brain structures and enable quantitative volumetric analysis. However, the reliability and accuracy of these tools largely depend on the quality of input MRI data [82]. Widely used software packages such as FreeSurfer, FSL, and CAT12 – an extension of SPM – as well as newer deep learning-based models, achieve optimal performance with high-quality structural MRI scans.
The standard input typically involves high-resolution, 3D, T1-weighted images, such as the MPRAGE sequence, with a near-isotropic voxel size around 1 mm³ or less, offering sufficient spatial resolution and tissue contrast to effectively differentiate grey matter, white matter, and CSF. Tools like FreeSurfer may additionally utilise T2-weighted or FLAIR sequences with comparable spatial resolutions to further enhance segmentation precision.
Adequate tissue contrast, indicated by a high contrast-to-noise ratio (CNR), is essential for accurate tissue classification; poor contrast may cause tissue mislabelling or boundary blurring. Spatial resolution directly affects partial volume effects, where a single voxel contains multiple tissue types; lower resolution increases these effects and decreases segmentation precision [83].
Image intensity homogeneity is another critical factor. Field inhomogeneities, known as bias fields, lead to slow intensity variations unrelated to actual tissue differences, significantly impairing segmentation algorithms that assume uniform tissue intensity. Consequently, bias field correction methods, such as N4ITK, constitute a necessary preprocessing step [84]. Additionally, the SNR substantially impacts segmentation quality: low SNR or motion-related artifacts degrade image quality, causing errors such as the misclassification of noise as anatomical structures or missing tissue boundaries [85]. If these quality criteria are unmet, segmentation outputs may include incorrect tissue labels and distorted volumetric estimates, misleading clinical interpretations.
Given these risks, MRI scan quality assessment is essential both pre- and post-segmentation. In clinical settings, trained radiologists or technicians commonly perform visual inspections, evaluating contrast, artifact presence, SNR, and anatomical integrity [86]. However, this method remains subjective and time-intensive, particularly in high-throughput environments. Therefore, automated quality control (QC) tools are gaining prominence in clinical research and may soon integrate into routine workflows [87]. For instance, MRIQC is an open-source software that calculates quantitative quality metrics – such as SNR, CNR, and intensity homogeneity – from raw T1-weighted scans, employing machine learning classifiers trained on extensive datasets to identify scans requiring review or repetition [87]. Another tool, Qoala-T, performs post-segmentation QC by analysing segmentation outputs (e.g. from FreeSurfer), applying machine learning methods to predict segmentation quality with expert-level accuracy (AUC ~0.98) [88]. Similarly, CAT12 offers integrated QC tools that assess T1-weighted scan quality by calculating a composite image quality index, incorporating contrast, noise, intensity variability, and spatial resolution; higher values (closer to 1) denote superior image quality [6]. Integrating automated or semi-automated QC tools like MRIQC, Qoala-T, or CAT12 into neuroimaging workflows facilitates identifying suboptimal scans, reducing false-positive results in volumetric analyses, and ensuring that only high-quality images support diagnostic decision-making. Ultimately, such integration enhances the reliability, reproducibility, and clinical utility of brain segmentation outcomes.
Conclusions
Magnetic resonance imaging volumetry has proven to be a fundamental tool for detecting and monitoring structural brain changes across multiple neurological disorders. In MS, volumetric imaging provides critical insights into grey and white matter atrophy, which correlate with disease progression and cognitive decline. Alzheimer’s disease studies highlight the role of volumetry in detecting hippocampal atrophy, aiding early diagnosis and tracking of cognitive deterioration. In myotonic dystrophy, volumetric differences between DM1 and DM2 reflect distinct neuropathological patterns, helping refine disease classification and management. Additionally, in drug-resistant epilepsy, volumetric and morphometric analyses of focal cortical dysplasia and hippocampal sclerosis contribute to improved diagnostic precision and surgical outcomes. The continued integration of volumetric MRI into clinical and research settings holds promise for advancing early diagnosis, personalised treatment, and improved long-term prognostic assessments in neurological disorders.