

Introduction
An anterior cruciate ligament (ACL) tear is a common and significant knee joint injury, with an annual incidence of approximately 8 cases per 10 000 individuals aged 10 to 64 years [1]. For most patients, ACL reconstruction (ACLR) is required, and both reconstruction rates and hospitalization costs have risen globally in recent decades, particularly among female and pediatric populations [2-6]. The process of ACL graft healing in the human knee following ACLR is not yet fully understood [7], and it remains unclear how much postoperative time is required for an ACL graft to fully mature in humans [8]. Typically, three stages of graft maturation are recognized: the initial inflammatory phase, the revascularization phase, and the final remodeling phase [8]. To date, no study has definitively determined the optimal time for returning to activity after ACLR, while considering both the patient’s functional recovery and the ACL graft maturation phase to ensure the highest level of safety. Numerous tests have been established for functional evaluation, including movement and biomechanical assessments [9,10], hop tests [11], balance tests [12], and evaluations of quadriceps and hamstring strength [13,14]. However, the correlation between functional performance and graft healing remains a topic of debate [15,16]. Van Eck et al. [17] reported that most ACL graft failures occurred between 6 and 9 months following ACLR, which coincides with the period when most patients are allowed and clinically or functionally cleared to return to sports activities. This finding not only highlights the importance of assessing functional readiness but also emphasizes the need for ACL graft evaluation to ensure a safe return to sport and reduce the risk of graft failure.
Magnetic resonance imaging (MRI) has been extensively studied as a tool for predicting the biomechanical and histological properties of ACL grafts following ACLR, both in animal models [18] and in humans [19]. The signal intensity (SI) of the ACL graft has been shown to reflect the progressive remodeling process of the graft [20]. Higher SI, indicative of increased vascularity or cellularity, is commonly observed during the early postoperative phase and gradually diminishes, with significant reductions occurring between the first and second years after ACLR, reflecting the graft’s ongoing remodeling process [21]. Abnormal SI, inconsistent with the expected healing phase, has also been associated with ACL graft damage caused by factors such as iterative injury or surgical complications, including improper tunnel positioning [22]. Stöckle et al. [23] first proposed the use of the signal-to-noise quotient (SNQ) to normalize graft SI grayscale values, a method that has since been widely used in studies assessing graft maturity via MRI. Despite normalization using the SNQ, SI variations remain influenced by technical and biological factors, highlighting the limited sensitivity of current clinical outcome measures in accurately evaluating ACL graft recovery following ACLR.
Therefore, this study was performed to evaluate the reliability of measuring ACL graft SI using a standardized assessment protocol that could serve as an additional metric in ACL graft evaluation following ACLR. Specifically, we analyzed both intrarater and interrater reliability of ACL graft SNQ measurements in the coronal-oblique plane over a 1-week interval.
Material and methods
Participants
This study was a prospective analysis of retrospectively collected data from patients who underwent anatomic single-bundle ACLR using autologous grafts (hamstring: n = 10; patellar tendon: n = 2) followed by postoperative MRI using a 1.5-T MRI magnet. All images were acquired between December 2023 and March 2024. The research was conducted in accordance with the Declaration of Helsinki and received approval from the local research ethics committee (Approval No. 2017/3). Patients with evidence of ACL graft rupture, concurrent posterior cruciate ligament (PCL) injury, or imaging artifacts were excluded. The final cohort comprised 12 participants (6 males), with a mean age of 30.7 ± 9.7 years, height of 173.8 ± 10 cm, body mass of 86.8 ± 23.9 kg, body mass index of 28.4 ± 5.3 kg/m2, and time from ACLR to MRI evaluation of 31.1 ± 25 months (Table 1).
Raters
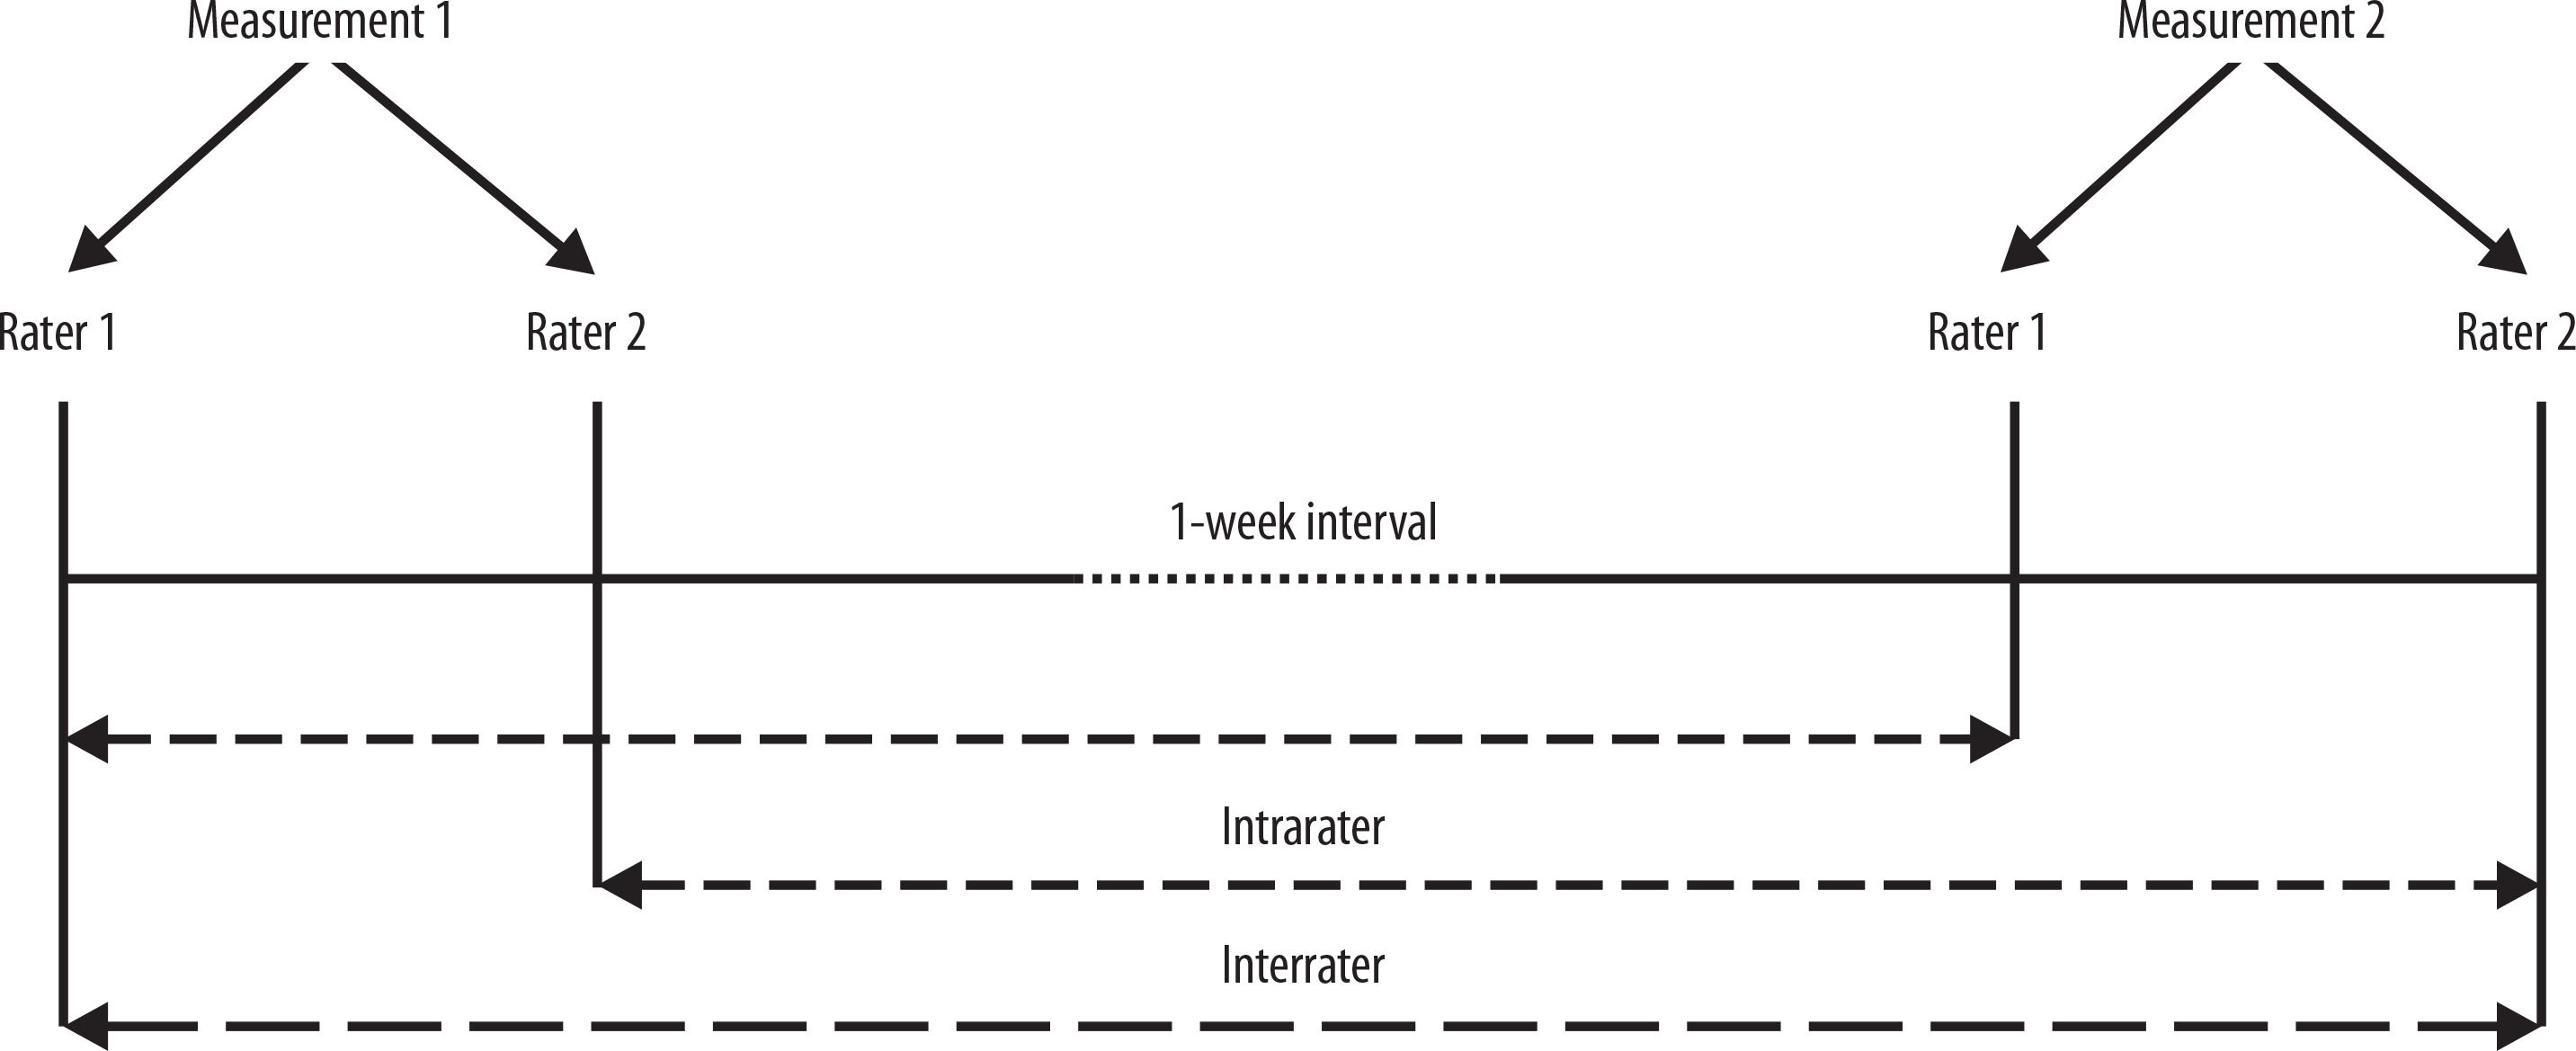
Two raters, each with more than 10 years of experience in musculoskeletal radiology, were responsible for ACL graft SI data collection. Prior to the measurements, both raters received detailed instructions on the procedure for assessing ACL graft SI and were given sufficient time to practice the protocol. To evaluate intra- and interrater reliability, each rater measured the ACL graft SI twice, with a 1-week interval between measurement sessions. The images were randomized and blinded to the raters to ensure unbiased assessment across all evaluations. The measurement protocol is illustrated in Figure 1.
MRI scans and ACL graft SI measurement
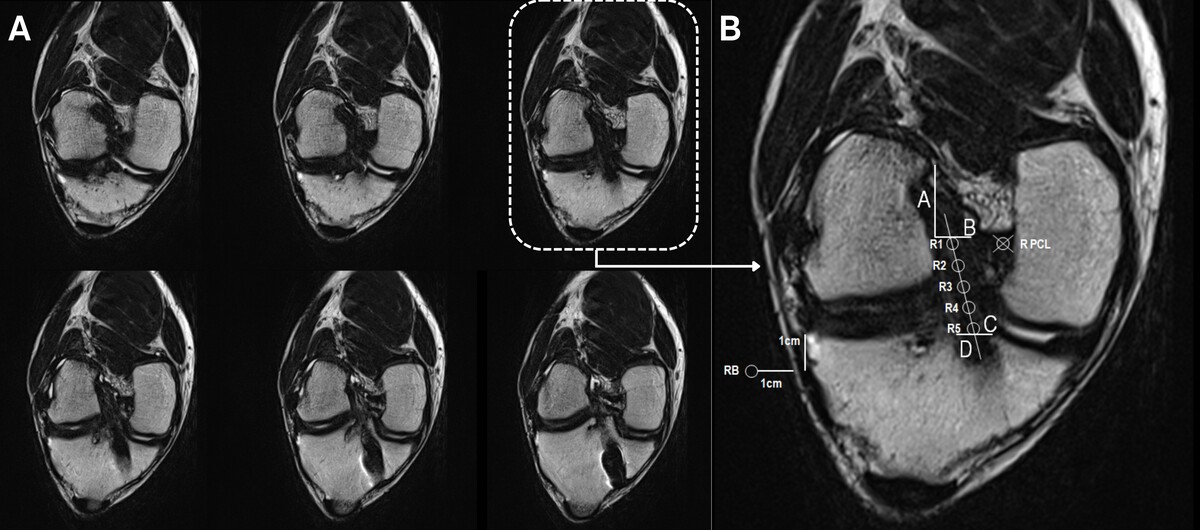
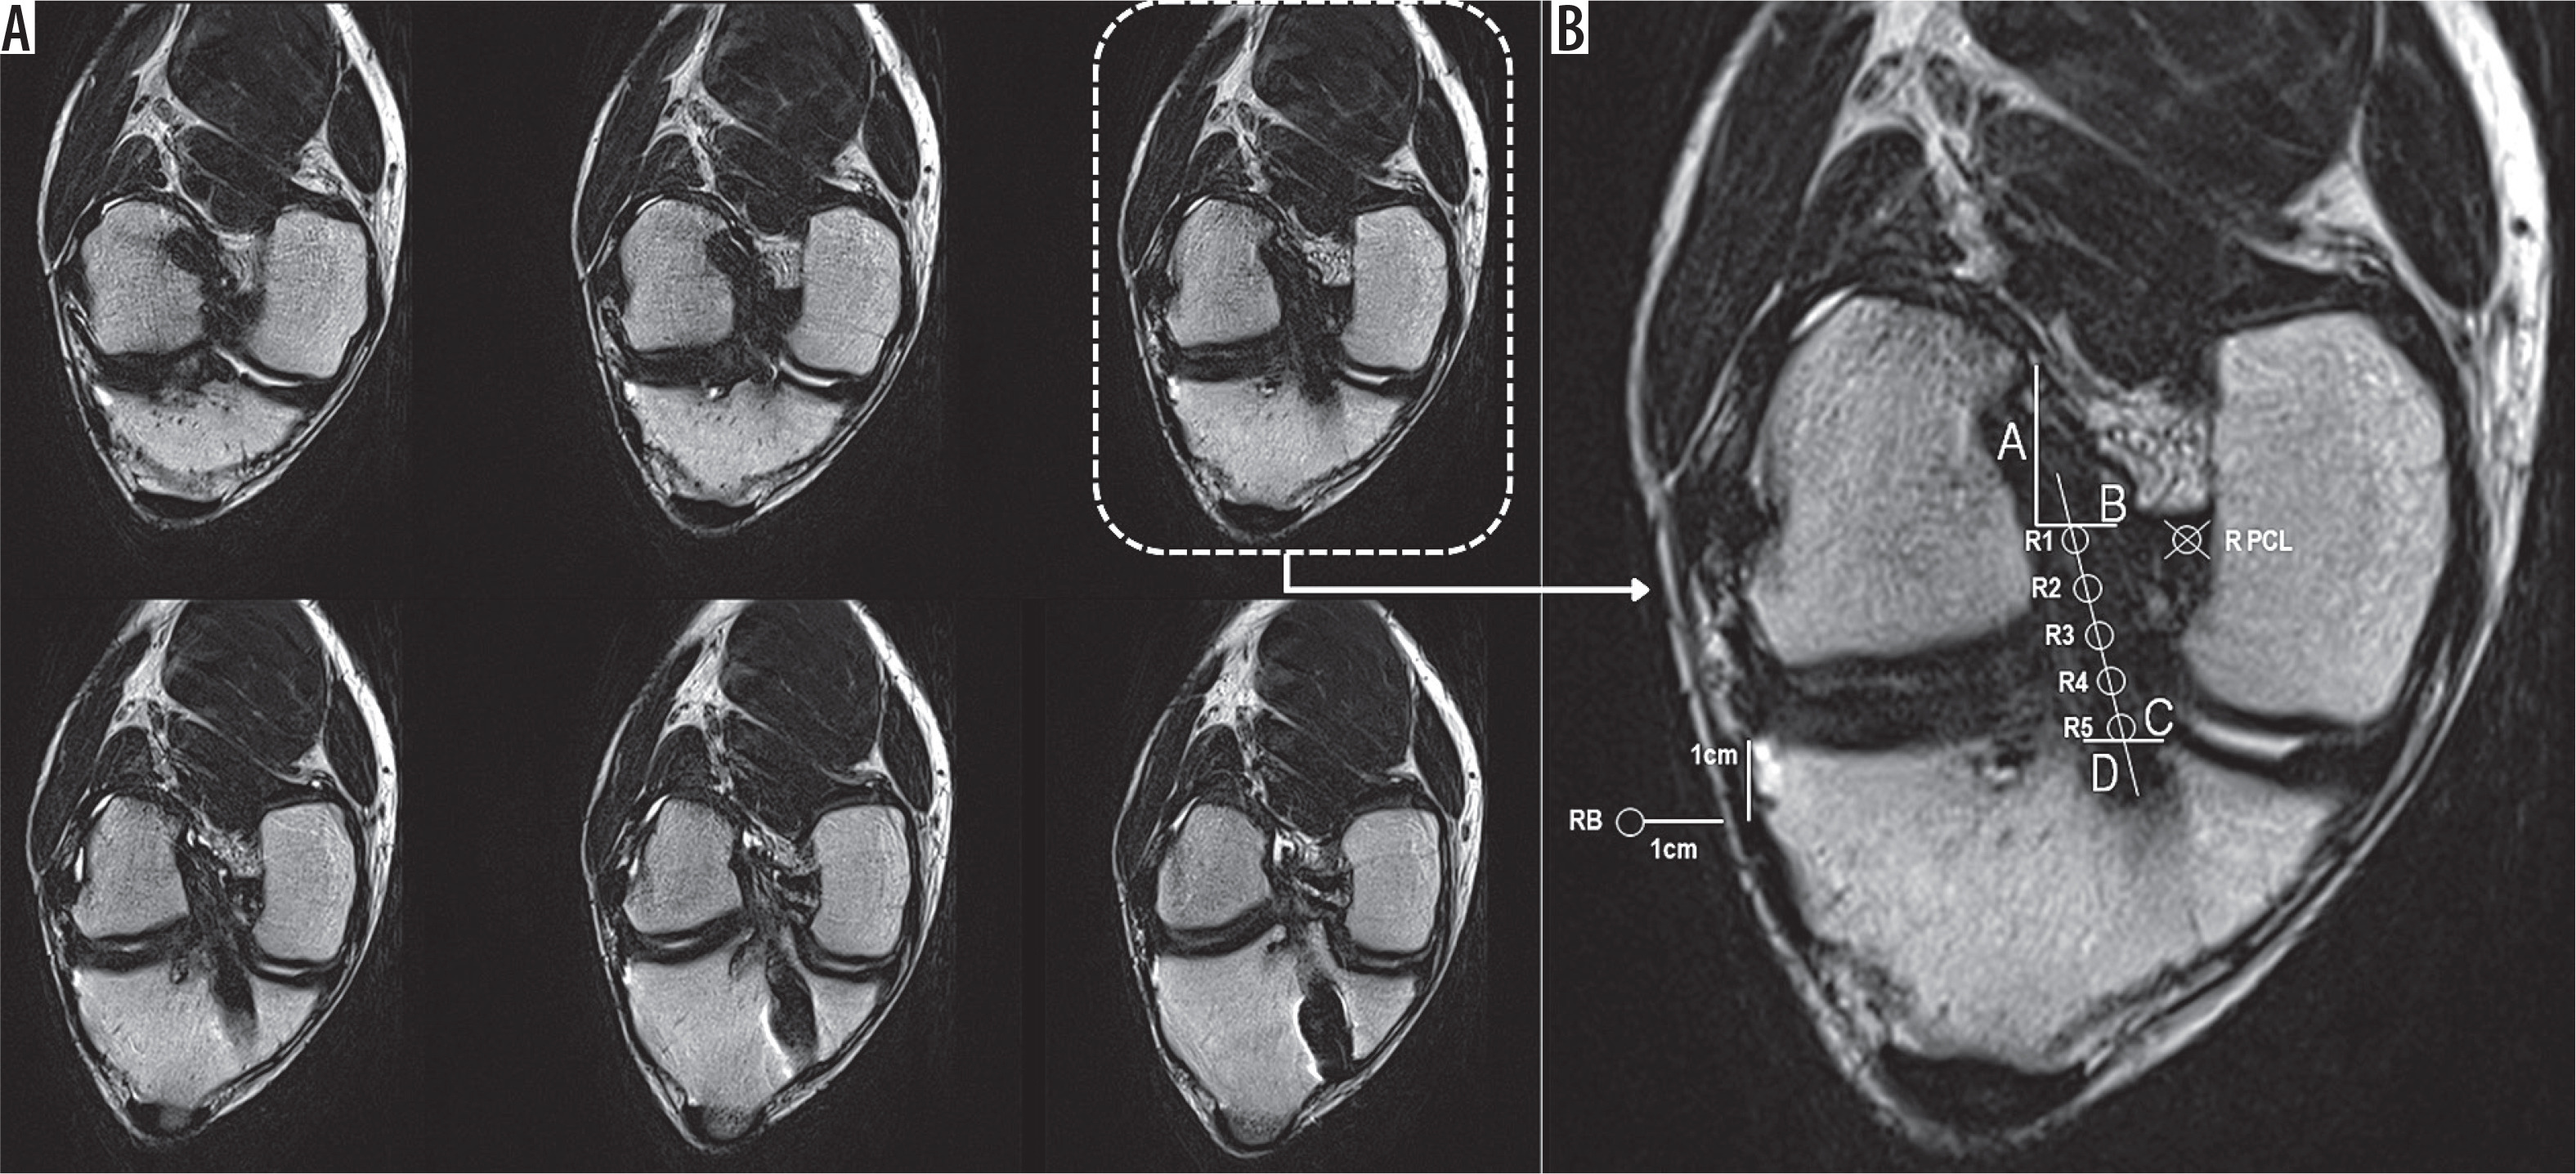
All MRI images were acquired using a 1.5-T scanner (GE Signa; GE Healthcare, USA) equipped with an eight-channel knee coil. A T2-weighted turbo spin echo sequence acquired without fat suppression was applied in the standard oblique-coronal plane, optimized for visualization of the ACL graft. Sequence parameters included a slice thickness of 2 mm, repetition time of 4000 ms, and echo time of 98 ms. These acquisition parameters were identical for all participants, and registered images were analyzed using Syngo.via software (Siemens Healthineers, Germany). SI of the graft was manually measured using the region-of-interest (ROI) tool. ROI placement was performed according to a predefined protocol to ensure precision. In the first step, the slice with the best visualization of the intra-articular portion of the ACL graft was selected (Figure 2A). Line A was drawn connecting the bony surfaces at the entry points of the femoral bone tunnel. Line B was then identified in the femoral region, perpendicular to Line A, and drawn from the lower edge of the femoral bone tunnel entry point to the medial edge of the graft. In the tibial region, Line C was drawn from the lateral to the medial edge of the bone tunnel entry point, parallel to Line B. The centers of Lines B and C were connected by Line D, indicating the longitudinal center of the ACL graft. In the second step, circular ROIs (3-mm diameter, area = 7.07 mm2) [24] were defined and positioned as follows: R1 and R5 were tangent to the lower edge of Line B and the upper edge of Line C, respectively, and centered on the ACL graft, with Line D dividing each ROI into two equal halves. R3 was positioned at the midpoint between Lines B and C, centered on the ACL graft. R2 and R4 were placed midway between adjacent ROIs (R1-R3 and R3-R5, respectively), also centered on the ACL graft and bisected by Line D. An ROI at the center of the PCL cross-sectional area (RPCL) was defined, and a background ROI (RB) was placed in the air background outside the body contour on the lateral side, using a standardized offset (Figure 1B). This configuration facilitated accurate assessment of the ACL graft area while minimizing measurement error. SI of the ACL graft was calculated using the SNQ (SNQ = [ACL graft signal − PCL signal]/RB) [25] for each ACL graft ROI (R1-R5) (Figure 2A, B).
Figure 2
A) First step of the measurement protocol, showing selection of the slice with the best visualization of the intra-articular portion of the anterior cruciate ligament (ACL) graft. (B) Measurement protocol for ACL graft signal intensity in the standard oblique-coronal plane. Line A connects the femoral bone tunnel entry points. Line B (femoral region) and Line C (tibial region) are drawn perpendicular and parallel, respectively, to Line A. Line D connects the centers of Lines B and C, indicating the longitudinal center of the graft. Circular region of interests (ROIs) (3-mm diameter) are positioned as follows: R1 and R5 are tangent to Lines B and C, respectively; R3 is located midway between them; and R2 and R4 are positioned midway between adjacent ROIs. All ROIs are centered on the ACL graft and bisected by Line D. The ROI is placed at the center of the posterior cruciate ligament, and the background region is positioned near the skin margin
Statistical analysis
Reliability of the SNQ was assessed for each individual ROI within the ACL graft, as well as for the average SNQ value across all graft ROIs. Reliability, expressed as intraclass correlation coefficient (ICC) values, was calculated using a mixed-model analysis of variance, with consecutive measurements as the repeated factor and participants as the independent factor. Intrarater reliability, incorporating error associated with repeated ROI placement within the ACL graft (R1-R5), RPCL, and RB by a single rater, was assessed using the ICC(3,k) model. Interrater reliability, incorporating error associated with ROI placement by two independent raters, was assessed using the ICC(2,k) model. All reliability analyses were performed with a 1-week interval between measurements. Reliability was classified as poor (< 0.50), moderate (0.50-0.75), good (0.75-0.90), or excellent (> 0.90) [26]. In addition, 95% confidence intervals (CIs), standard error of measurement (SEM = SD × (1 − ICC)½) and the smallest detectable difference (SDD = SEM × 1.96 × 2½) were calculated using Statistica Version 13 (TIBCO Software Inc., Palo Alto, CA, USA) and SPSS (IBM Corp., Armonk, NY, USA). The present analyses quantify analytical (rater-dependent) reproducibility on a fixed image dataset and do not include variability attributable to repeated MRI acquisitions (inter-scan/test–retest variability).
Results
Intrarater reliability for SNQ measurements of the ACL graft was evaluated using the ICC(3,k) model, which captures the consistency of ROI placement within the ACL graft by the same rater across repeated measurements. ICC values for individual ROIs ranged from 0.67 to 0.90, indicating moderate to excellent reliability. The highest intrarater reliability was observed for R2 (ICC = 0.90, 95% CI: 0.70-0.97), while the lowest was found for R5 (ICC = 0.67, 95% CI: 0.20-0.89). The SEM for individual ROIs ranged from 0.31 to 1.01, and SDD values ranged from 0.87 to 2.79. Intrarater reliability for SNQ calculated as the average across all ROIs (R1-R5) was classified as excellent, with an ICC of 0.90 (95% CI: 0.67-0.97), SEM of 0.28, and SDD of 0.76 (Table 2).
Table 2
Intrarater reliability of signal-to-noise quotient (SNQ) measurements of the anterior cruciate ligament graft
| SNQ | ICC | 95% CI | SEM | SDD |
|---|---|---|---|---|
| R1 | 0.83 | 0.52-0.94 | 0.38 | 1.05 |
| R2 | 0.90 | 0.70-0.97 | 0.44 | 1.21 |
| R3 | 0.80 | 0.45-0.93 | 0.72 | 1.98 |
| R4 | 0.86 | 0.58-0.95 | 0.31 | 0.87 |
| R5 | 0.67 | 0.20-0.89 | 1.01 | 2.79 |
| Mean (R1-R5) | 0.90 | 0.67-0.97 | 0.28 | 0.76 |
Interrater reliability for SNQ measurements of the ACL graft was evaluated using the ICC(2,k) model, which accounts for variability introduced by two raters independently defining ROIs within the ACL graft. Reliability between raters varied across individual ROIs, with ICC values ranging from 0.52 to 0.83. The highest interrater reliability was observed for R2 (ICC = 0.83, 95% CI: 0.65-0.92), corresponding to good reliability. The lowest interrater reliability was recorded for R5 (ICC = 0.52, 95% CI: 0.15-0.76), indicating moderate agreement between raters. The SEM for individual ROIs ranged from 0.51 to 1.23, while SDD values ranged from 1.43 to 3.43. Interrater reliability for SNQ calculated as the average across all ROIs (R1-R5) was classified as good, with an ICC of 0.85 (95% CI: 0.67-0.93), SEM of 0.34, and SDD of 0.96 (Table 3).
Discussion
The aim of this study was to evaluate the reliability of measuring ACL graft SI using a refined and standardized assessment protocol. To the authors’ knowledge, this is the first study to provide reliability data demonstrating that ACL graft SNQ measurements obtained on coronal-oblique MRI are reproducible over a 1-week interval. Intrarater reliability for individual ROIs ranged from ICC(3,k) = 0.67 to 0.90, with the highest agreement observed at R2 (ICC = 0.90, 95% CI: 0.70-0.97) and the lowest at R5 (ICC = 0.67, 95% CI: 0.20-0.89). Interrater reliability for individual ROIs ranged from ICC(2,k) = 0.52 to 0.83, peaking at R2 (ICC = 0.83, 95% CI: 0.65-0.92) and lowest at R5 (ICC = 0.52, 95% CI: 0.15-0.76). Precision metrics mirrored these patterns: intrarater SEM ranged from 0.31 to 1.01 with SDD from 0.87 to 2.79, whereas interrater SEM ranged from 0.51 to 1.23 with SDD from 1.43 to 3.43. Notably, averaging SNQ across all five graft ROIs (R1-R5) improved reproducibility to excellent intrarater agreement (ICC = 0.90; 95% CI: 0.67-0.97; SEM = 0.28; SDD = 0.76) and good interrater agreement (ICC = 0.85; 95% CI: 0.67-0.93; SEM = 0.34; SDD = 0.96). Taken together, these data indicate that the method is robust within raters and acceptably consistent between raters, particularly when the multi-ROI average is used. Importantly, the present analysis quantifies rater-dependent reliability of ROI placement and SNQ computation on a fixed set of postoperative MRI examinations. It does not capture test–retest variability attributable to repeated MRI acquisitions (inter-scan variability), scanner drift, or sequence-parameter changes. Accordingly, the reported ICC, SEM, and SDD values reflect analytical reproducibility rather than full clinical workflow repeatability.
Our findings are concordant with prior work reporting excellent intraobserver and good interobserver agreement for MRI-based ACL graft signal metrics obtained in the sagittal plane, including SNQ (intraobserver ICC = 0.83; interobserver ICC = 0.67), and align with systematic syntheses that judged interrater reliability to be generally good while emphasizing substantial methodological heterogeneity across studies [27-29]. Clinically, several studies have associated lower ACL graft signal (or lower SNQ) with more advanced graft maturation and elements of return-to-sport readiness. For example, Zhou et al. [30] observed lower mean, proximal, and middle SNQ values in athletes who returned to sport at 9 months following ACLR, while Kim et al. [31] associated lower SNQ with better synovialization on second-look knee arthroscopy. Conversely, other investigations have reported that MRI signal metrics do not consistently correlate with instrumented knee laxity or patient-reported outcomes, despite associations with return-to-sport rates. These discrepancies underscore that reliability and biological plausibility, while necessary, are not sufficient for establishing clinical validity [32]. Recent systematic reviews echo this uncertainty, calling for standardized imaging and analysis protocols and outcome-anchored validation before signal-based metrics are used to guide individual clearance decisions [19,33]. Methodologically, this study employed a standardized protocol applied to a routinely acquired coronal-oblique plane, enabling measurements to be performed directly in the plane of the ACL graft and thereby enhancing generalizability to everyday clinical workflows. The measurement procedure incorporates SNQ normalization and predefined ROI templates distributed along the graft, features intended to be sequence-agnostic and portable across scanner types. Averaging SNQ across multiple graft ROIs clearly enhanced reproducibility, plausibly by mitigating local signal heterogeneity; this aggregation step is straightforward to implement and does not require additional scan time or complex post-processing.
From a clinical perspective, SEM and SDD values provide actionable thresholds for interpreting longitudinal change. For the averaged SNQ, week-to-week changes of ≥ 0.76 (intrarater) or ≥ 0.96 (interrater) exceeded measurement error in the present setting and can therefore be considered detectable. These characteristics support the potential use of the SNQ for serial monitoring of postoperative ACL graft remodeling. Because the SNQ is intrinsically normalized and based on commonly acquired imaging planes, it may be applied consistently across patients and independently of concomitant procedures (e.g., anterolateral ligament reconstruction), facilitating comparisons between surgical strategies and rehabilitation protocols. Nevertheless, the SNQ should be interpreted alongside complementary imaging biomarkers and clinical assessments rather than as a standalone determinant of clinical decision-making, in line with conclusions from recent systematic reviews [33].
This study has several strengths, including the use of ICC models matched to the study design (ICC(3,k) for intrarater and ICC(2,k) for interrater reliability), explicit reporting of SEM and SDD to enable practical thresholds for change, and demonstration that multi-ROI averaging improves measurement stability. However, several limitations should be acknowledged. Concurrent clinical or arthroscopic reference standards were not available in this cohort, precluding assessment of criterion or predictive validity. In addition, the sample size was largely pragmatic, based on available imaging, rather than derived from an a priori, precision-based sample size calculation for reliability. The small cohort contributes to wider ICC CIs for some ROIs and warrants cautious interpretation, particularly for ROI-specific estimates. Moreover, the postoperative interval ranged widely (8-84 months), introducing biological heterogeneity that may influence ICC magnitude because ICC is a variance-ratio measure driven in part by between-subject variability. Importantly, repeated measurements were performed within a 1-week interval on the same MRI examinations; therefore, true biological changes in graft signal over the test–retest period are unlikely to account for within-subject differences, and the present results primarily reflect rater-dependent analytical reproducibility. Nevertheless, future studies should evaluate reliability within narrower postoperative windows and in larger samples to further confirm generalizability. We also did not assess test–retest repeatability across repeated MRI acquisitions; thus, inter-scan variability and scanner drift were not quantified. Future studies should therefore predefine reliability targets and perform formal sample size calculations accordingly, evaluate workflow-level repeatability across sessions (and ideally across scanners/protocols), and critically assess longitudinal SNQ trajectories against clinical outcomes such as return to sport, knee laxity, and patient-reported measures, as well as structural benchmarks from second-look arthroscopy. Further work should also explore semi-automated or fully automated ROI strategies to reduce rater dependence. Subgroup analyses (e.g., with and without anterolateral augmentation or across different graft types) may further clarify generalizability across surgical techniques and rehabilitation pathways [34].
Conclusions
A standardized, ROI-based SNQ method for MRI assessment of the ACL graft in the coronal-oblique plane demonstrates excellent intrarater and good interrater reliability over a 1-week interval, with multi-ROI averaging materially improving reproducibility. The derived SDD thresholds (0.76 intrarater and 0.96 interrater for averaged SNQ) provide pragmatic benchmarks for detecting ACL graft signal change over time. These properties support the use of the SNQ for serial postoperative monitoring, although confirmatory studies linking the SNQ to functional and structural outcomes and evaluating inter-scan repeatability are required to establish its prognostic utility.