Introduction
The Coronary Artery Calcium Score (CACS) serves as a critical quantitative tool for the assessment of coronary artery calcium (CAC), a well-established predictor of coronary heart disease (CHD) risk and prognosis [1,2]. In conventional CT protocols for CACS, the radiation dose to the examinee is relatively high, with significant variability depending on the scanner model and scanning protocol, resulting in an effective dose range of 0.8-10.5 mSv [3]. Therefore, it is clinically important to minimise the radiation dose associated with CACS. CACS quantification is influenced by several technical factors, including tube voltage [4,5], tube current [6], iterative reconstruction (IR) technique [7], image layer thickness and spacing [8], and the convolution kernel [9]. The radiation dose associated with CACS using low-dose techniques can be reduced to less than 1 mSv. However, the reduction in radiation dose often results in increased image noise, which potentially affects the quantitative assessment of CAC quantification accuracy and cardiovascular risk stratification. The implementation of various IR techniques has been shown to effectively diminish image noise while maintaining the diagnostic accuracy of CACS under low radiation dose conditions. Prior studies have employed different types of CT scanners in conjunction with IR techniques to investigate CACS, yielding varied conclusions [10–12]. Among these, there are relatively few studies investigating the advanced model-based iterative reconstruction (ADMIRE) algorithm in the context of CACS, and the sample sizes in these studies tend to be small [13,14]. Additionally, the convolution kernels employed (e.g. Qr36, Bv36, Br36) are sensitive to variations in tube voltage [9,13,14]. The kV-independent Sa36 convolution kernel is designed to preserve bone and calcium CT values across varying tube voltages, effectively producing equivalent results to those obtained at a conventional 120 kVp scanning setting [9]. Previous studies on CAC have employed manual quantification methods using a threshold semi-automatic technique [13,14]. However, manual outlining presents several limitations, including being time-consuming, labour-intensive, and heavily influenced by the operator’s experience. In contrast, emerging artificial intelligence (AI) offers significant advantages, including high reproducibility and consistent results. Consequently, AI is playing an increasingly vital role in the quantification of CAC and the post-processing reconstruction of coronary artery images.
This study aims to evaluate the effects of ADMIRE reconstruction levels (1-5) on AI-based CAC quantification (volume, mass, Agatston score) and risk stratification using Sa36 kernel images. By establishing FBP reconstructed images (120 kVp) as a baseline, we seek to determine how IR influences AI-driven CAC metrics and clinical risk stratification. The findings are aimed to guide the clinical implementation of Sa36 kernels and inform standardised protocols for AI-integrated CAC assessment.
Material and methods
Sample size estimation
The sample size required for the study was estimated using PASS 15.0.5 software (version 21.0.3). A one-way analysis of variance (ANOVA) with repeated measurements was selected for the analysis. The parameters set for the estimation included: significance level (α) = 0.05, power = 90%, and number of groups = 6. The standard deviation (σ) values were derived from the mean standard deviation of the ascending aortic FBP algorithm based on a pre-experimental cohort of 50 patients, which was 15.33 HU. The mean standard deviation values for the ADMIRE level 5 algorithm was 7.91 HU. The standard deviation values for the ascending aorta across FBP and ADMIRE levels 1 to 5 were as follows: 15.33, 13.86, 12.21, 10.76, 9.30, and 7.91. The minimum sample sizes calculated were 51 and 15, respectively. Considering the minimum sample size suggested by the PASS and that from previous literature, it was determined that the required sample size for this study should be over 102 patients.
Study population
This study was a single-arm investigation approved by the Ethics Committee of our hospital. Consecutive patients who underwent coronary computed tomography angiography (CTA) at our hospital from 1 August to 28 September 2024 were included. The inclusion criteria were as follows: patients with suspected coronary artery disease and clear image quality. The exclusion criteria included the following: prior coronary artery bypass grafting, previous stenting, allergy to iodine contrast, history of heart valve surgery, presence of metal implants within the scanning area, and multiple calcifications of the aortic valve or pericardium. All patients provided written informed consent prior to the examination.
CT scan protocol and image reconstruction parameters
All patients underwent examination on a third-generation, dual-source CT scanner (SOMATOM Force, Siemens, Germany). Prior to the CAC CT scan, patients received breathing training to enhance their compliance with breath-holding instructions. They were positioned supine with arms elevated, and scanning was performed at the end of deep inspiration. CACS was executed in a prospective electrocardiographically gated-triggered sequential mode, utilising axial scanning. The scanning range extended from the tracheal eminence to the level of the diaphragm, with the scanning direction oriented from head to foot. Scanning parameters included a tube voltage of 120 kV, a reference tube current of 80 mAs (using CARE Dose4D), a collimation of 38 × 1.2 mm, and a rotation time of 0.25 s/r.
The raw data from all patients were reconstructed using both FBP and various levels of the ADMIRE reconstruction algorithm (1-5). The layer thickness and spacing for image reconstruction were set at 3.0 mm and 1.5 mm, respectively, as recommended by the manufacturer. The convolution kernel used was Sa36, with a matrix size of 512 × 512 and a display field of view (FOV) of 20.0 cm. The longitudinal window settings were configured with a window width of 350 HU and a window level of 50 HU. In total, 6 groups of images were generated, labelled as FBP group, ADMIRE 1 group, ADMIRE 2 group, ADMIRE 3 group, ADMIRE 4 group, and ADMIRE 5 group.
All images were transferred to a Siemens post-processing workstation (syngo.via, version: VB20A_HF91) for analysis, and quantitative parameter measurements were conducted using uAI Intelligent Coronary Assisted Diagnosis software (uAI Discover CCTA; version: R001, Shanghai United Intelligent Medical Technology Co., Ltd.).
Objective evaluation and quantitative CACS analysis
Objective evaluation
Two CT imaging radiologists, each with over 10 years of experience, utilised the ellipse measurement tool on the Siemens workstation (syngo.via) to delineate the region of interests (ROIs). The ROI was defined at the centre of the lumen of the ascending aorta (adjacent to the left coronary artery) in the images from the FBP group, with a designated area of 50-100 mm2. This ROI was subsequently copied and applied to the corresponding images in the other 5 groups. For each group, the mean CT valuesof the ROIs and its standard deviation (SD) were recorded. The average SD value was calculated and used to represent the background noise (BN) of the images.
Additionally, calcified plaques with a coronary artery area exceeding 3 mm2 were identified in the FBP group images. The ROI for each plaque was outlined following magnification, ensuring that it was centred within the calcified plaque. Subsequently, this ROI was copied to the images of the ADMIRE 1-5 groups. The mean CT value, maximum CT value, and minimum CT value for each plaque were documented. Each measurement for the image groups was conducted 3 times, and the average of these measurements was recorded. During the measurement process, the radiologist was allowed to adjust the window width and window level as necessary.
Automatic detection of CAC
Two radiologists, both with extensive experience in cardiovascular diagnostics, reviewed the segmented areas of calcification that were automatically identified by the AI software. Any discrepancies in the findings were resolved through consensus. Inaccuracies detected by the AI software were manually corrected and subsequently recalculated by the software.
For each group of images, the total volume (mm3), total equivalent mass (mg CaHA), and Agatston’s total calcification score of the coronary artery calcified plaques, as automatically calculated by the AI software, were recorded. The CT value threshold for identifying coronary calcified plaques was set at 130 HU, with a correction factor of 0.743 applied. Patients were stratified according to Agatston score [15], with the following specific criteria: Agatston score = 0 (grade 0, very low); 0 < Agatston score ≤ 100 (grade I, low); 100 < Agatston score ≤ 400 (grade II, medium); and Agatston score > 400 (grade III, high).
Radiation dose
The CT dose index of volume (CTDIvol) and the dose length product (DLP) were automatically generated by the machine at the conclusion of each scan and recorded. The effective dose (ED) was calculated using the formula:
The conversion factor k was referenced from the European Commission guidelines for CT quality standards [16], with the chest k value set at 0.014 mSv · mGy−1 · cm−1.
Statistical analysis
Statistical analyses were conducted using SPSS 22.0 software. Measurement data were assessed for normal distribution using the Kolmogorov-Smirnov test. Data that met the criteria for normality were expressed as mean ± standard deviation (x ± s) along with a 95% confidence interval (CI). For normally distributed measurement data, the c2 test was applied to determine the adequacy of chi-squaredness, followed by post-hoc comparisons using the least significant difference (LSD) method in one-way analysis of variance (ANOVA) to compare CT values, BN, and CAC across groups. Tamhane’s T2 post-hoc test was utilised for between-group comparisons in one-way ANOVA when the assumption of normality was not met. Additionally, post-hoc multiple comparisons were employed to analyse CT values, SD values, BN, and quantitative indicators of CAC among the different groups, with a significance level set at p < 0.05. For measures that did not conform to a normal distribution, data were expressed as median and interquartile range (P25, P75) along with a 95% CI, and the Friedman nonparametric test was applied to evaluate differences between groups, with significance determined at p < 0.05. The agreement between objective measures collected by 2 radiologists was assessed using the intra-class correlation coefficient (ICC) with a 95%CI, employing a two-way mixed model to establish absolute agreement.
Results
Patients’ characteristics
In this study, 261 patients were consecutively included. Among these, 3 patients were found to have undergone coronary stent placement, 1 patient had an infusion port placed, 2 patients exhibited heart rate irregularities and artifacts in their images, and 1 patient had artifacts from thoracic spinal metal nails. These 7 cases were excluded, resulting in a total of 254 patients. Of the included patients, 127 were male and 127 were female, with a mean age of 60.38 ± 12.36 years (range: 21-88 years).
Objective evaluation of ascending aorta and calcified plaque
The mean CT values of the ascending aorta in the FBP group was 48.95 ± 4.45 HU, based on data from 254 patients. There was no statistically significant difference in the mean CT value of the ascending aorta between the FBP group and the ADMIRE levels 1 to 5 groups (p > 0.05)(Table 1). Measurements of the CT values of the ascending aorta recorded by the 2 radiologists displayed good agreement in both the FBP and ADMIRE 1-5 groups, with intra-class ICC at the 95% CI as follows: FBP: 0.843 (0.799, 0.877); ADMIRE 1: 0.760 (0.693, 0.813); ADMIRE 2: 0.838 (0.792, 0.873); ADMIRE 3: 0.693 (0.607, 0.760); ADMIRE 4: 0.709 (0.628, 0.773); ADMIRE 5: 0.809 (0.756, 0.851).
Table 1
Objective measurement results and artificial intelligence quantitative results of the Coronary Artery Calcium Score (CACS)
| FBP | ADMIRE 1 | ADMIRE 2 | ADMIRE 3 | ADMIRE 4 | ADMIRE 5 | F/χ2 | p | |
|---|---|---|---|---|---|---|---|---|
| CT value of ascending aorta1# | ||||||||
| Mean vlues (HU) (n = 254) | 48.95 ± 4.45 [48.40, 49.50] | 49.01 ± 4.63 [48.44, 49.58] | 48.93 ± 4.39 [48.38, 49.47] | 49.23 ± 4.95 [48.62, 49.84] | 49.13 ± 4.65 [48.56, 49.71] | 48.96 ± 4.50 [48.41, 49.52] | 0.171* | 0.973 |
| BN (HU) (n = 254) | 14.95 ± 2.26 [14.67, 15.22] | 13.56 ± 2.07 [13.30, 13.81] | 12.09 ± 1.84 [11.86, 12.32] | 10.71 ± 1.68 [10.51, 10.92] | 9.20 ± 1.46 [9.02, 9.38] | 7.55 ± 1.40 [7.38, 7.73] | 455.105* | < 0.001 |
| CT values of calcified plaques2# | ||||||||
| Mean vlues (HU) (n = 161) | 386.91 (273.71, 530.08) [386.81, 440.71] | 388.99 (267.54, 522.65) [378.47, 482.61] | 383.80 (263.50, 523.12) [379.27, 433.81] | 378.44 (259.31, 519.05) [375.75, 430.17] | 373.35 (252.53, 512.35) [369.17, 425.13] | 367.25 (244.77, 505.98) [361.76, 417.12] | 687.904# | < 0.001 |
| Maximum values (HU) (n = 161) | 458.50 (306.00, 645.00) [459.14, 530.66] | 456.00 (301.25, 642.50) [455.97, 527.63] | 454.00 (296.25, 639.00) [450.52, 522.84] | 449.50 (292.00, 635.25) [446.70, 518.62] | 444.50 (298.25, 632.00) [444.76, 517.94] | 432.50 (281.75, 620.75) [433.60, 506.26] | 740.516# | < 0.001 |
| Minimum values (HU) (n = 161) | 303.00 (222.00, 402.00) [294.06, 334.28] | 300.50 (220.25, 395.75) [289.93, 330.21] | 297.00 (214.25, 390.25) [284.58, 325.46] | 290.00 (210.75, 384.75) [281.28, 322.15] | 281.50 (200.00, 379.50) [275.72, 332.78] | 270.00 (193.75, 365.00) [265.53, 306.78] | 701.477# | < 0.001 |
| Quantitative results of coronary CACS2# | ||||||||
| CAC volume (mm3) (n = 161) | 90.16 (27.31, 354.68) [221.67, 365.01] | 84.83 (22.09, 340.28) [215.39, 356.84] | 81.15 (20.83, 333.44) [209.60, 348.93] | 79.81 (19.72, 327.67) [204.32, 341.50] | 76.98 (18.37, 317.79) [197.93, 332.80] | 72.12 (16.87, 304.22) [189.21, 320.99] | 690.858# | < 0.001 |
| CAC mass (mg) (n = 161) | 17.60 (3.99, 82.58) [48.81, 84.10] | 16.92 (3.70, 80.29) [47.73, 82.60] | 16.58 (3.42, 78.04) [46.77, 81.24] | 15.69 (3.29, 75.99) [45.74, 79.71] | 14.76 (2.94, 72.88) [44.71, 78.42] | 12.69 (2.66, 68.14) [42.89, 75.80] | 679.387# | < 0.001 |
| Agatston (n = 161) | 103.96 (21.47, 424.47) [255.74, 433.41] | 99.83 (20.46, 415.97) [249.10, 424.50] | 95.82 (20.26, 410.98) [243.38, 416.18] | 87.85 (18.90, 401.79) [237.58, 407.71] | 83.84 (16.71, 388.45) [231.24, 398.53] | 78.48 (14.92, 370.17) [221.46, 384.95] | 679.224# | < 0.001 |
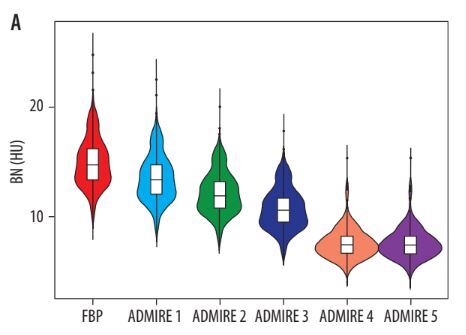
The FBP group exhibited the highest mean BN at 14.95 ± 2.26 HU, which gradually decreased with increasing ADMIRE levels, culminating in the lowest BN of 7.61 ± 1.76 HU observed in the ADMIRE 5 group (Table 1 and Figure 1A). Compared to the FBP group, the absolute values of BN (HU) decreased in the ADMIRE 1-5 groups by 1.39 ± 1.01, 2.74 ± 1.95, 4.23 ± 0.77, 5.75 ± 0.92, and 7.38 ± 1.56, respectively (F = 820.391, p < 0.001). The percentage reductions were 9.70 ± 2.49, 19.11 ± 1.28, 28.42 ± 2.11, 38.48 ± 2.59, and 49.76 ± 4.45, respectively (F = 1007.574, p < 0.001).
Figure 1
Changes in objective variables and coronary artery calcium (CAC) quantifications with increasing advanced model-based iterative reconstruction (ADMIRE) levels
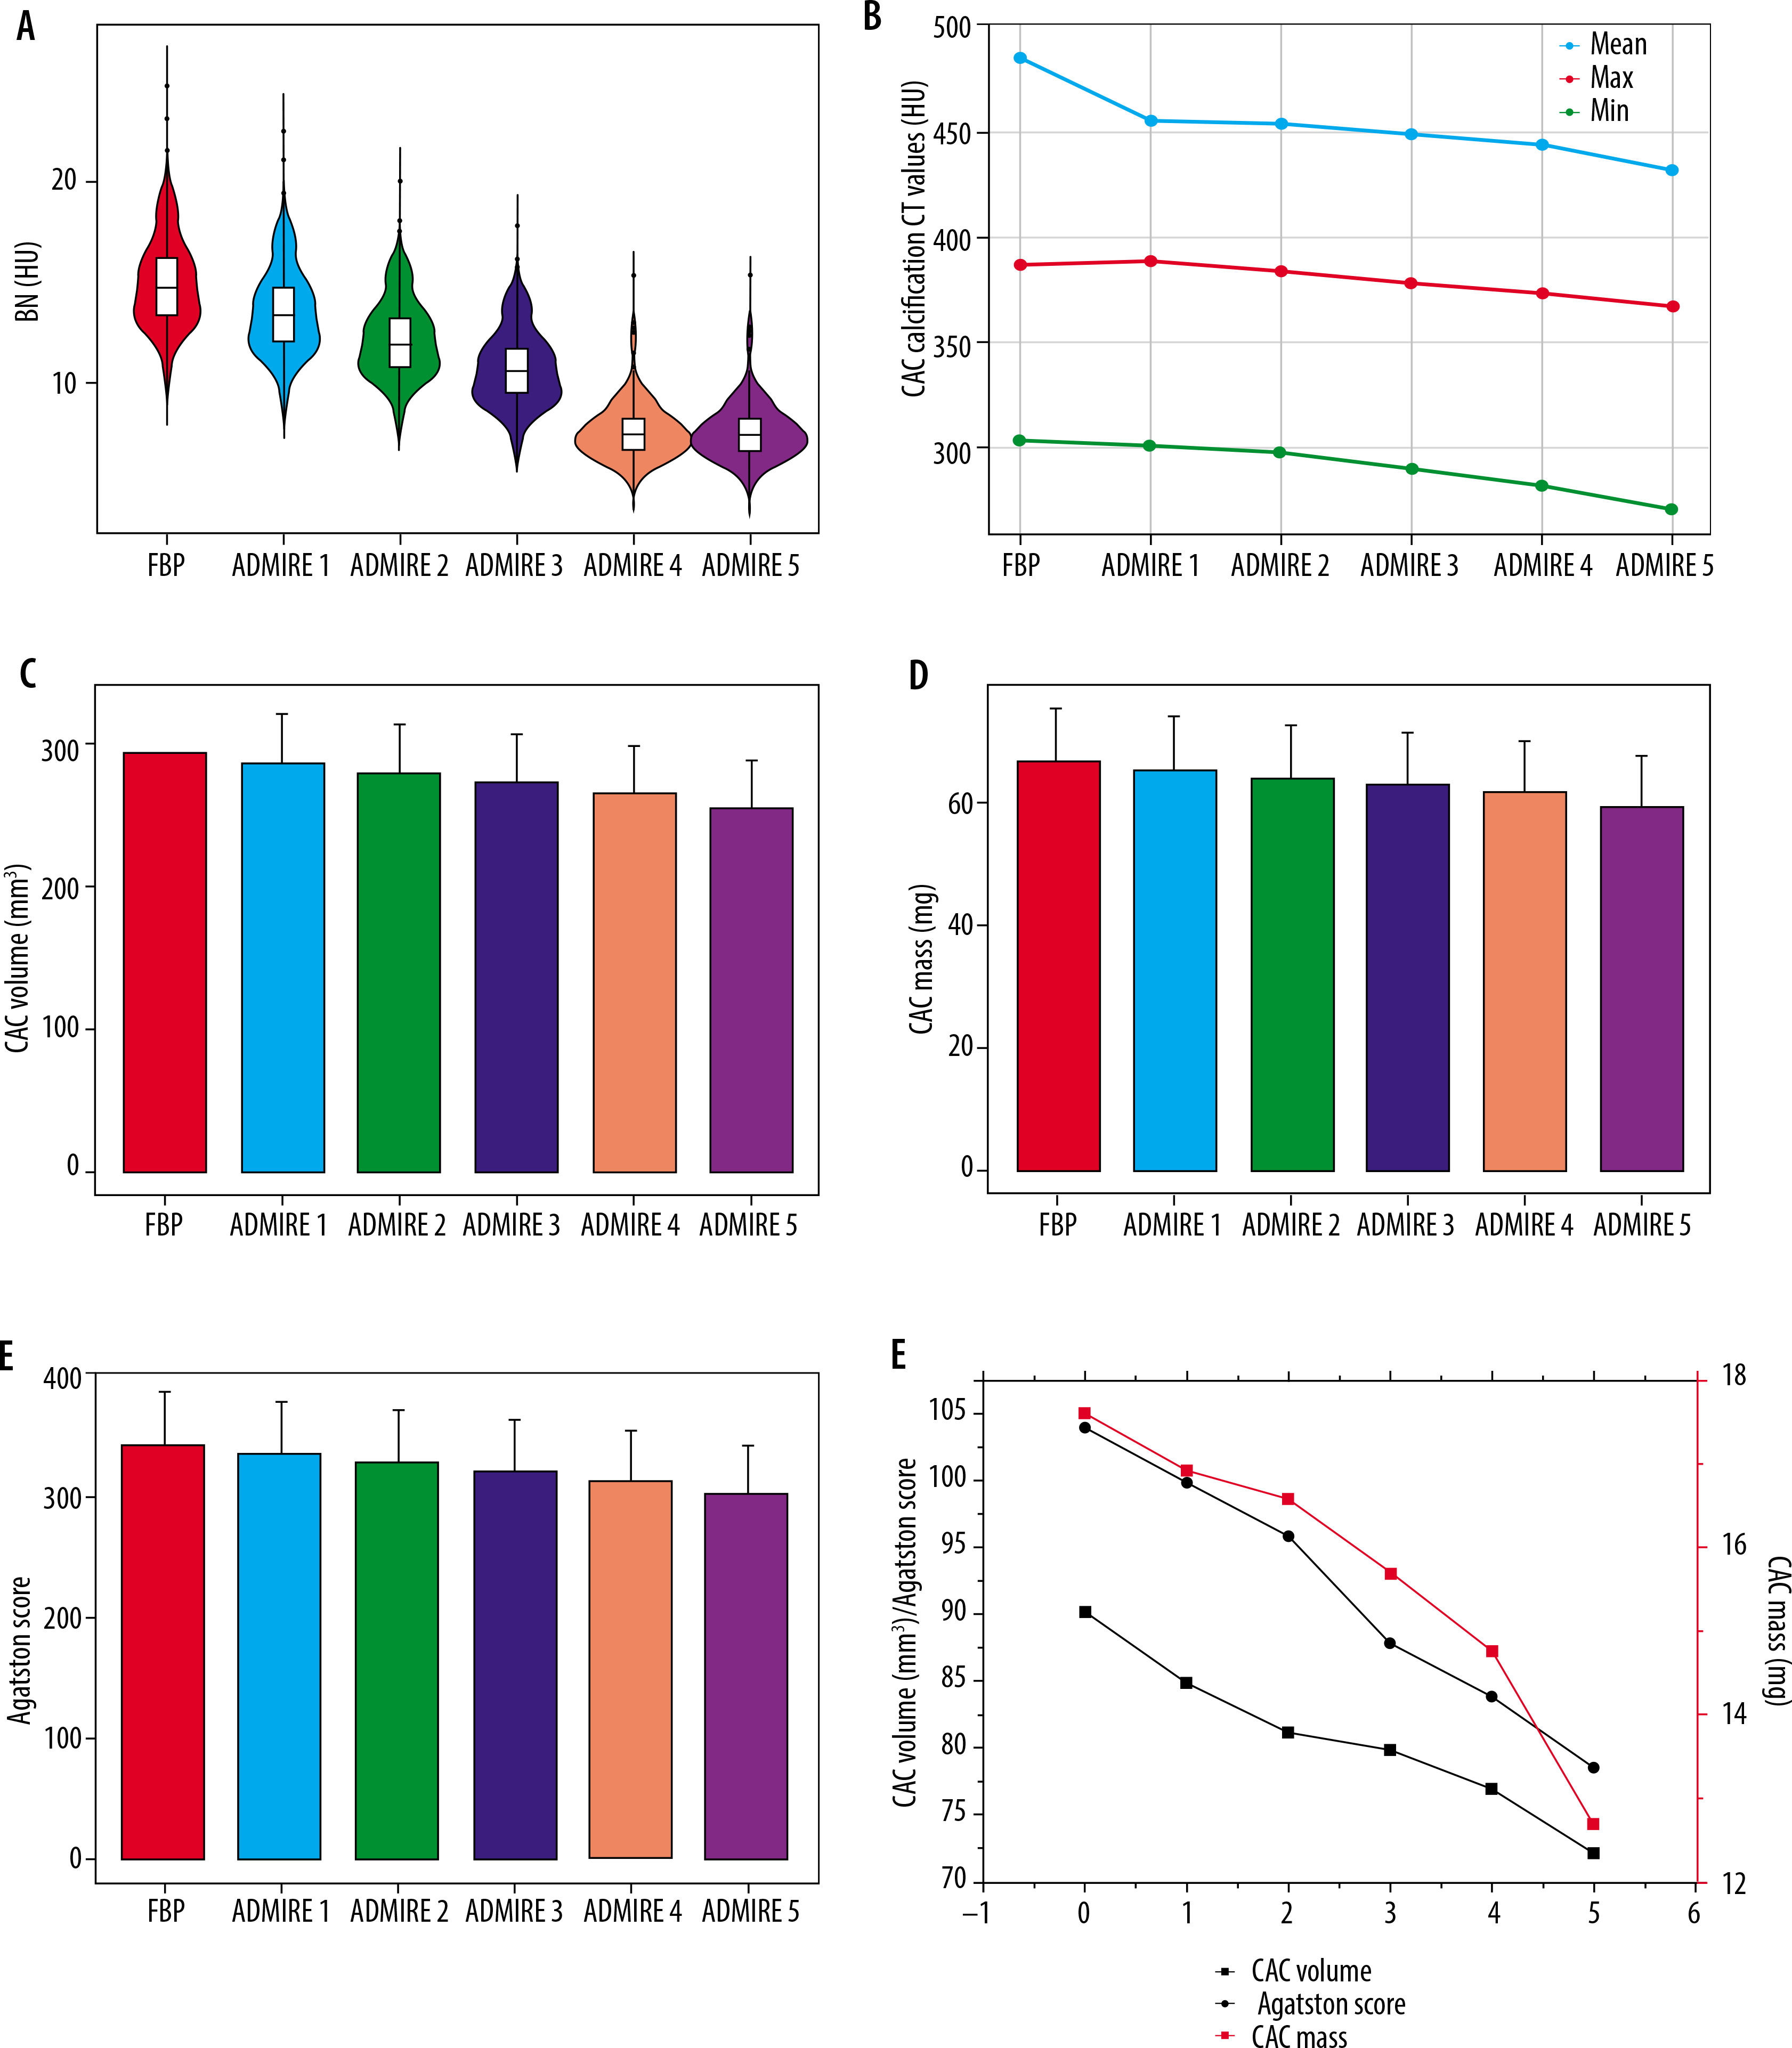
In terms of coronary artery calcified plaque CT values, a total of 161 patients had the highest mean CT value of calcification, as well as maximum and minimum CT values documented in the FBP group. The mean CT value of calcified plaque, along with its maximum and minimum values, gradually decreased with increasing ADMIRE levels. Statistically significant differences were observed between the FBP group and the ADMIRE 1-5 groups for all comparisons (p < 0.001 for all) (Table 1 and Figure 1B).
AI CACS quantitative results
The Agatston score was 0 in 93 out of 254 patients (36.61%) in the FBP group, and the Agatston score was 0 in all patients within the ADMIRE levels 1 to 5. A total of 161 patients exhibited a total calcified volume of 90.16 (27.31, 354.68) mm3 and a total mass of calcification measured at 17.60 (3.99, 82.58) mg in the FBP group, with the highest Agatston score recorded at 103.96 (21.47, 424.47). The total volume of calcification, mass, and Agatston score gradually decreased with increasing ADMIRE level, reaching their lowest values in the ADMIRE 5 group (Figure 1C-F). Compared to the FBP group, the total calcified volume, mass, and Agatston score were lower in the ADMIRE 5 group, both in absolute terms [(45.13 ± 4.46) mm3, (9.26 ± 1.14) mg, and (50.48 ± 5.59)] and as percentages [(32.55 ± 1.97)%, (32.57 ± 2.00)%, and (33.13 ± 2.03)%] (Table 2).
Table 2
Increase in CAC over FBP algorithm for diff erent ADMIRE levels
| ADMIRE 1 | ADMIRE 2 | ADMIRE 3 | ADMIRE 4 | ADMIRE 5 | F * | p# | |
|---|---|---|---|---|---|---|---|
| Absolute | |||||||
| CAC volume (mm3) (n = 161) | 8.56 ± 0.85 [6.87, 10.25] | 15.82 ± 1.59 [12.67, 18.97] | 23.58 ± 2.30 [19.04, 28.13] | 34.92 ± 3.71 [27.60, 42.24] | 45.13 ± 4.46 [36.33, 53.94] | 25.438 | < 0.001 |
| CAC mass (mg) (n = 161) | 1.80 ± 0.22 [1.36, 2.23] | 3.16 ± 0.36 [2.45, 3.87] | 4.57 ± 0.50 [3.58, 5.57] | 7.12 ± 1.01 [5.12, 9.12] | 9.26 ± 1.14 [7.00, 11.51] | 16.4111 | < 0.001 |
| Agatston (n = 161) | 9.77 ± 1.08 [7.65, 11.9] | 17.32 ± 1.95 [13.47, 21.16] | 26.39 ± 2.85 [20.76, 32.03] | 38.92 ± 4.68 [29.68, 48.17] | 50.48 ± 5.59 [39.45, 61.51] | 20.240 | < 0.001 |
| Percentage (%) | |||||||
| CAC volume (mm3) (n = 161) | 8.56 ± 0.85 [6.08, 10.81] | 14.74 ± 1.53 [11.73, 17.76] | 19.80 ± 1.66 [16.53, 23.07] | 25.56 ± 1.77 [22.06, 29.06] | 32.55 ± 1.97 [28.67, 36.44] | 32.310 | < 0.001 |
| CAC mass (mg) (n = 161) | 8.73 ± 1.23 [6.30, 11.17] | 15.18 ± 1.63 [11.95, 18.41] | 19.70 ± 1.69 [16.37, 23.03] | 25.52 ± 1.82 [21.93, 29.11] | 32.57 ± 2.00 [28.62, 36.52] | 29.477 | < 0.001 |
| Agatston (n = 161) | 8.77 ± 1.24 [6.33, 11.21] | 14.99 ± 1.56 [11.90, 18.07] | 20.19 ± 1.72 [16.79, 23.59] | 26.29 ± 1.86 [22.61, 29.97] | 33.13 ± 2.03 [29.13, 37.13] | 31.104 | < 0.001 |
Risk stratification
The distribution of risk stratification for the 254 patients in the FBP group and ADMIRE levels 1 to 5 is illustrated in Table 3. Twenty-four out of 161 patients with coronary artery calcification had their risk stratification affected by ADMIRE levels. Specifically, 11 patients were reduced from grade I to 0, 10 patients were downgraded from grade II to I, and 3 patients had their classification reduced from grade III to II (Table 4 and Figures 2 and 3).
Table 3
Risk stratification distribution of 254 patients in different reconstruction algorithms (N)
| FBP | ADMIRE 1 | ADMIRE 2 | ADMIRE 3 | ADMIRE 4 | ADMIRE 5 | |
|---|---|---|---|---|---|---|
| 0 | 93 | 96 | 98 | 99 | 101 | 104 |
| I | 79 | 78 | 79 | 81 | 79 | 76 |
| II | 41 | 39 | 36 | 34 | 36 | 36 |
| III | 41 | 41 | 41 | 40 | 38 | 38 |
Table 4
Risk stratification reclassification for different reconstruction algorithms in 24 patients (N)
| Level | ADMIRE 1 – FBP1* | ADMIRE 2 – ADMIRE 12* | ADMIRE 3 – ADMIRE 23* | ADMIRE 4 – ADMIRE 34* | ADMIRE 5 – ADMIRE 45* |
|---|---|---|---|---|---|
| I – 01# | 3 | 2 | 1 | 2 | 3 |
| II – I2# | 2 | 3 | 3 | 0 | 2 |
| III – II3# | 0 | 0 | 1 | 2 | 0 |
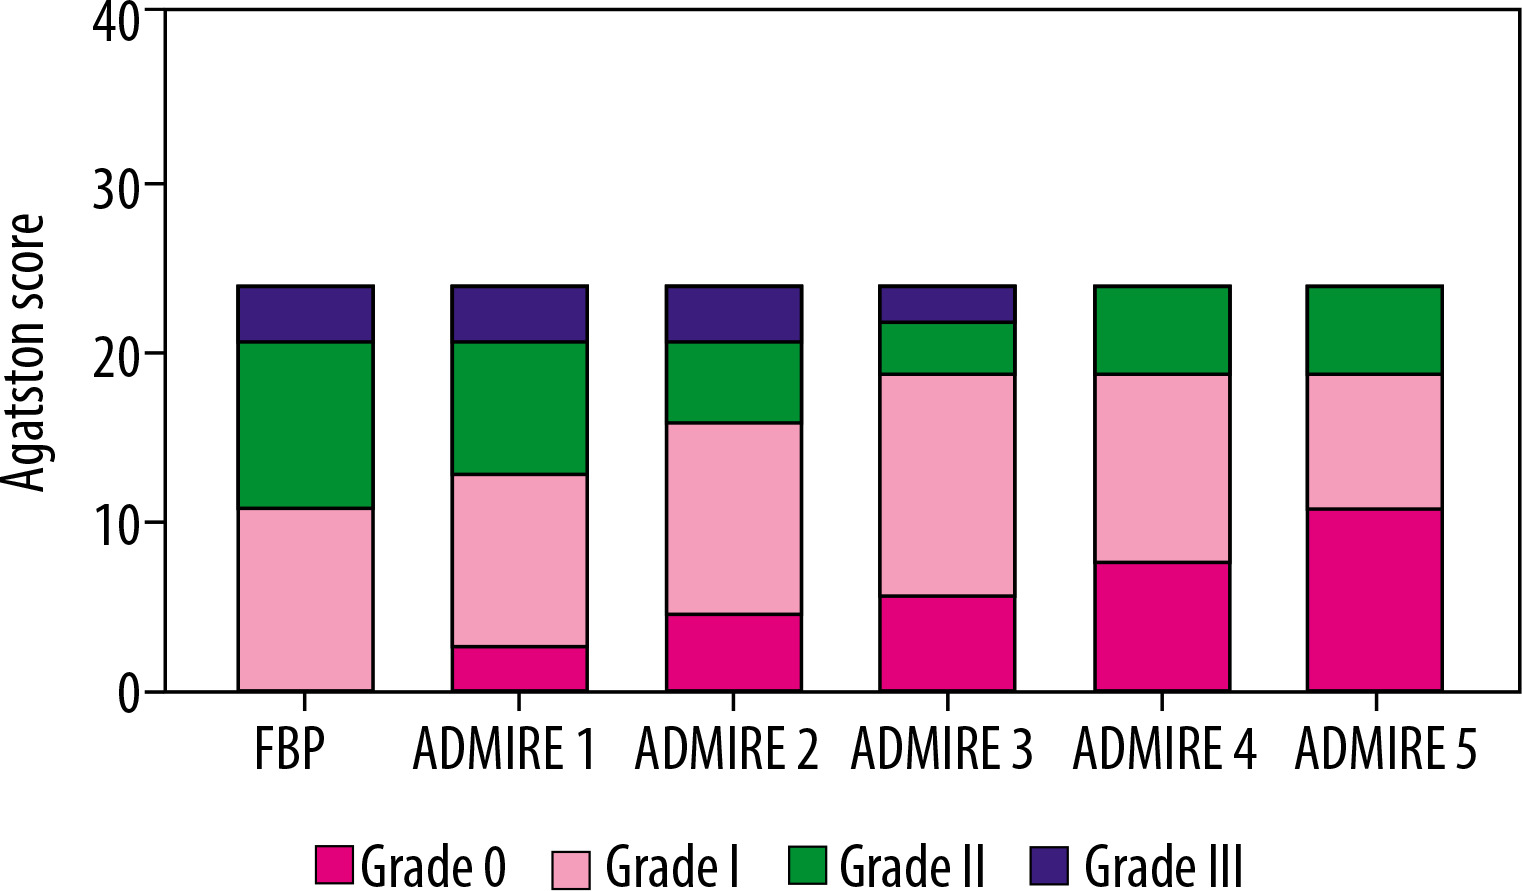
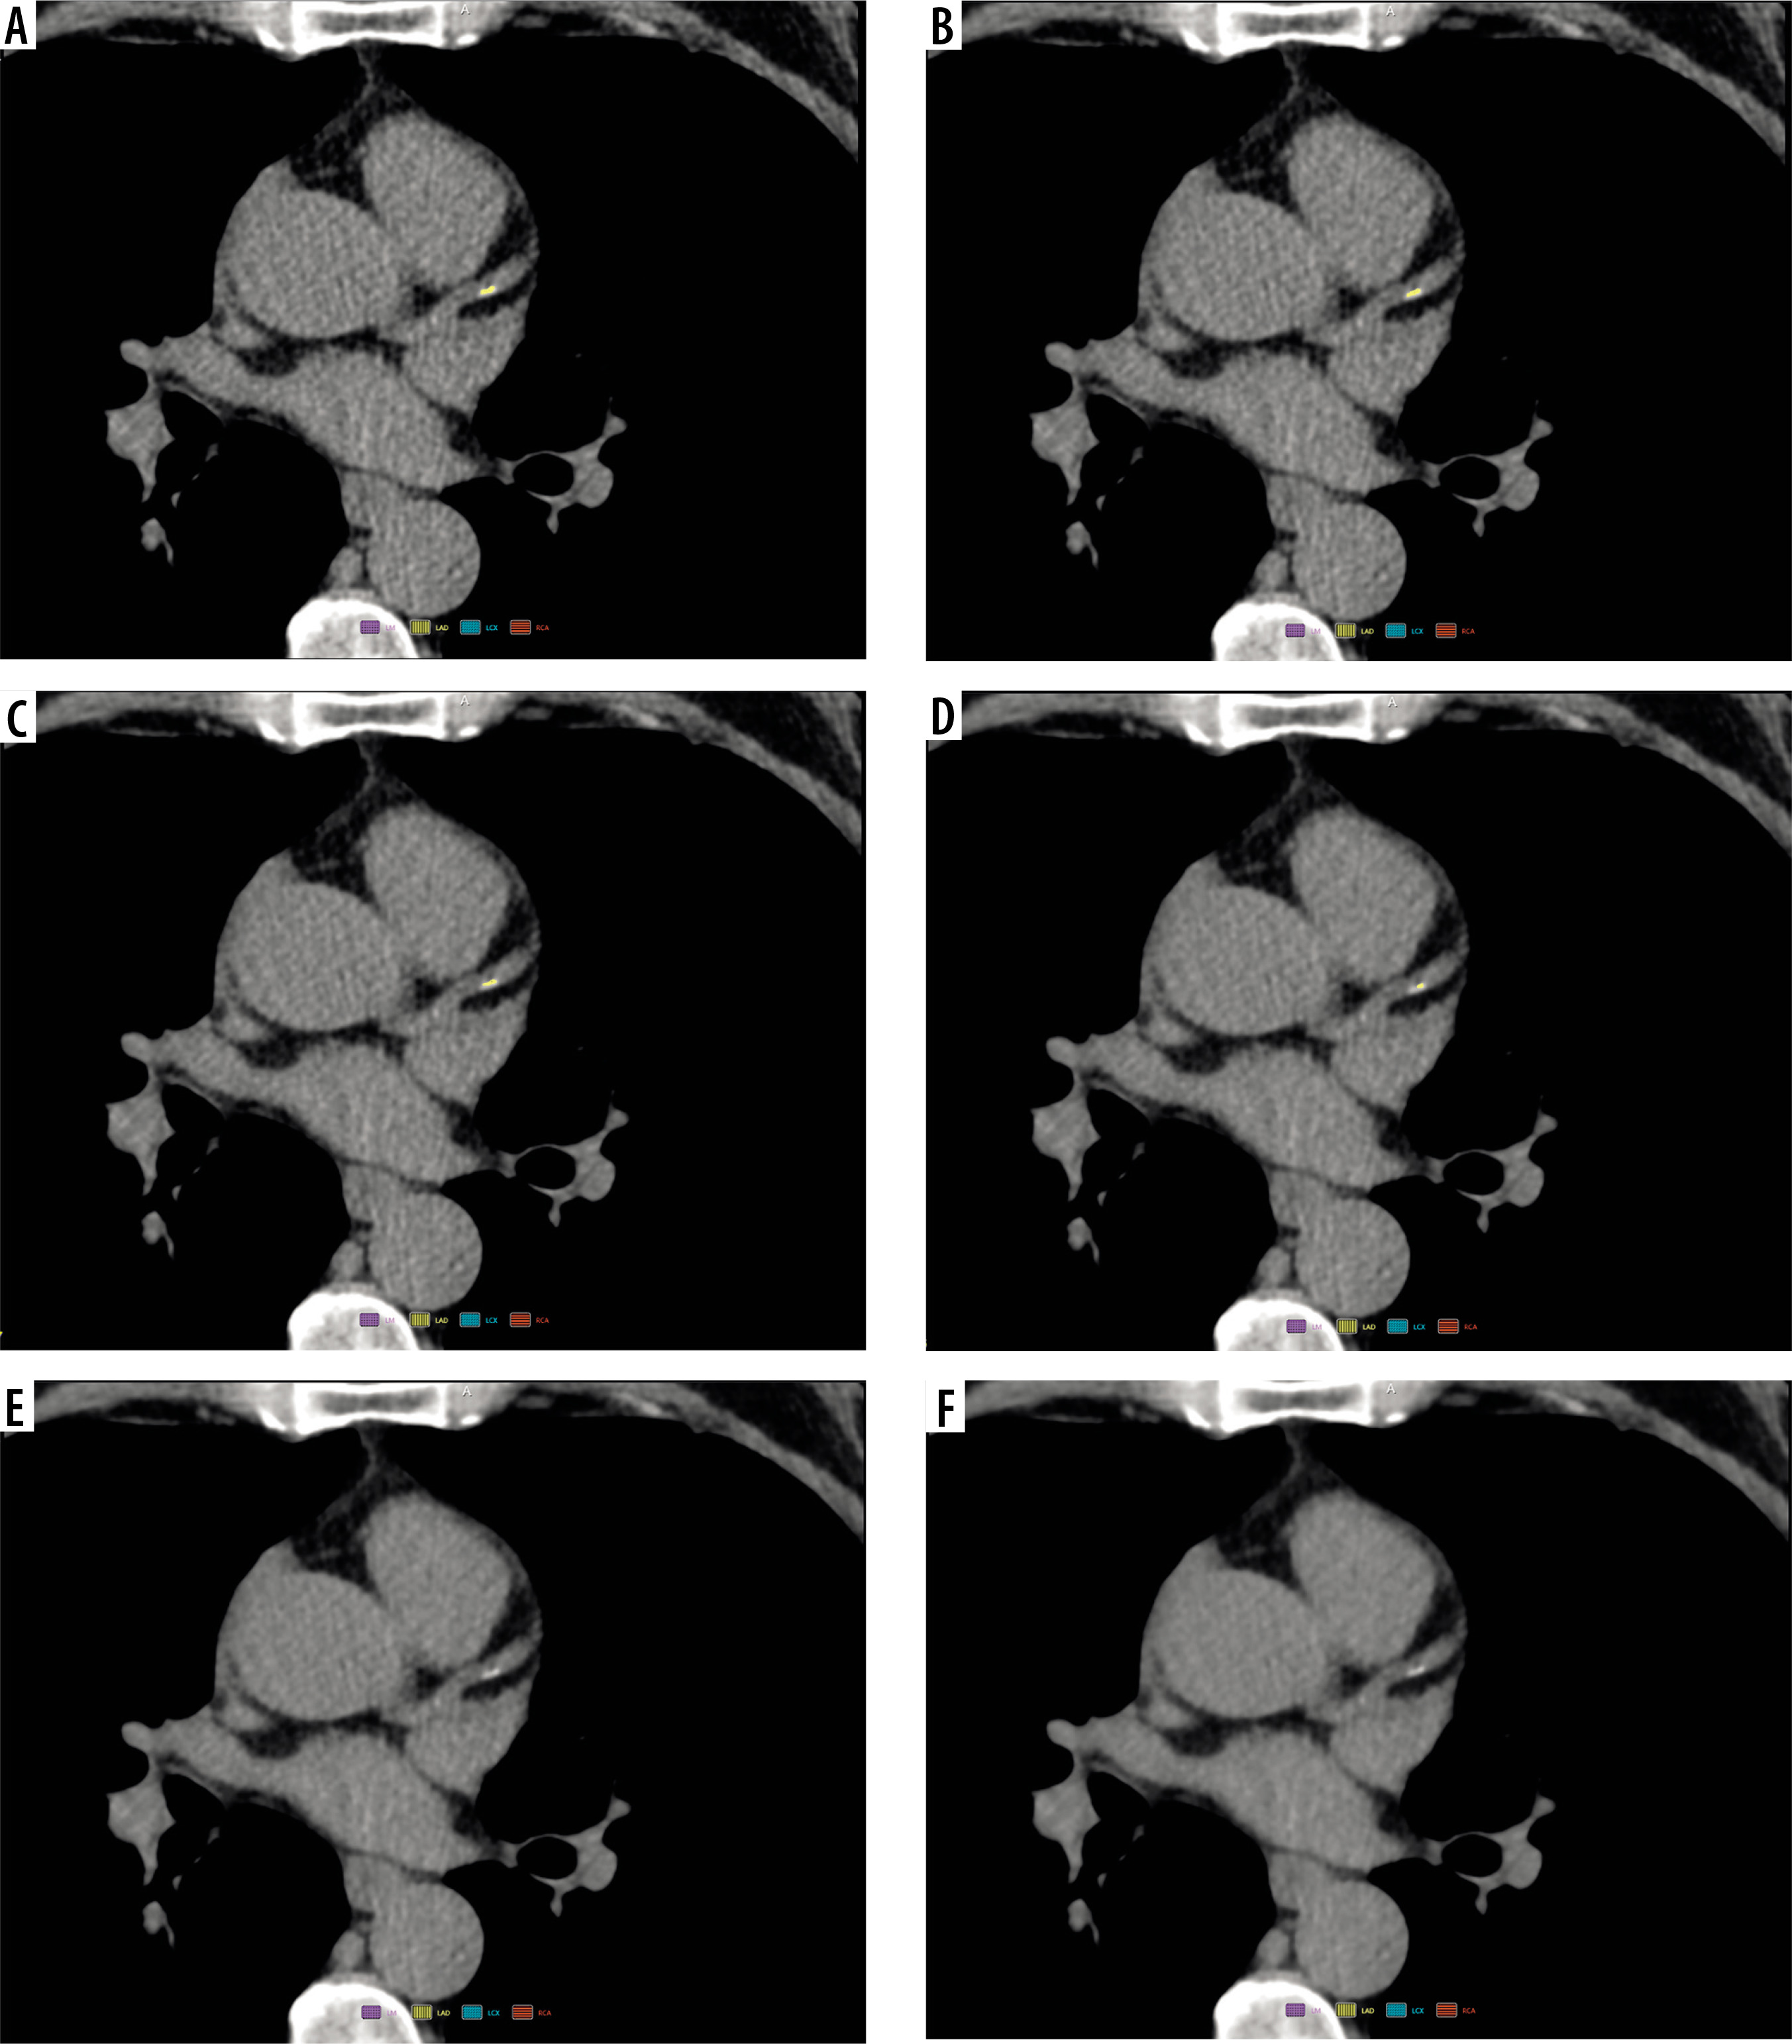
Figure 3
Change in coronary artery calcium (CAC) quantification with the advanced model-based iterative reconstruction (ADMIRE) level. A 59-year-old male patient presented with chest tightness and underwent coronary computed tomography angiography. Figures 3A-F display the filtered back projection (FBP) and ADMIRE level 1-5 reconstruction algorithm scanning images, respectively. The image noise levels for FBP (3A) and ADMIRE level 1-5 (3B-F) were 13.74 HU, 12.58 HU, 11.32 HU, 10.03 HU, 8.85 HU, and 7.34 HU, respectively. The AI automatically recognised and labelled the calcification (highlighted in yellow). The anterior descending branch calcification AI quantification results (volume, mass, Agatston) were as follows: [FBP: 9.02 mm3, 0.99 mg, 3.01; ADMIRE 1: 7.40 mm3, 0.80 mg, 2.47; ADMIRE 2: 5.55 mm3, 0.59 mg, 1.85; ADMIRE 3: 3.47 mm3, 0.37 mg, 1.16; ADMIRE 4: 0 mm3, 0 mg, 0; ADMIRE 5: 0 mm3, 0 mg, 0]. Hazard stratification: grade I for both FBP and ADMIRE grades 1-3, decreasing to grade 0 for ADMIRE grades 4-5. This patient had a CTDIvol of 2.67 mGy, DLP of 44.8 mGy · cm, and an effective dose (ED) of 0.63 mSv
Discussion
In this study, AI was employed to examine the effects of the Sa36 convolution kernel in combination with various levels of ADMIRE iterations on the quantitative measurement of coronary artery calcification. The findings demonstrated a significant reduction in image noise with increasing ADMIRE levels, while the CT values of the ascending aorta remained unchanged. Moreover, the quantitative results generated by the AI software for coronary artery calcification scoring (total calcification volume, mass, and Agatston score) diminished with higher ADMIRE levels, resulting in an underestimation of risk stratification in certain patients. Therefore, the potential implications of the ADMIRE iterative reconstruction technique on the quantification of coronary artery calcification and risk stratification must be acknowledged in clinical practice.
Quantification of CAC using electrocardiographically gated coronary CT images has become a vital tool for assessing cardiovascular risk and predicting future cardiac events [17]. Moreover, CAC screening has been incorporated into routine physical examinations in many cities [12]. However, the ionising radiation associated with CT scanning can cause varying degrees of anxiety in patients, thereby limiting its widespread adoption. Consequently, minimising radiation exposure during CAC scans has emerged as a key focus in imaging technology research. The implementation of different IR in clinical practice can significantly reduce image noise, thus enabling the possibility of lowering patient radiation doses. Low-dose scanning protocols combined with multiple IR techniques are the most commonly utilised in clinical settings. Relevant studies [11,18] have demonstrated that various IR techniques can effectively reduce noise; however, they may also impact CT values of coronary artery calcified plaques and influence CAC quantitative results. Since CAC quantitative results are closely tied to subsequent treatment and intervention strategies, their reproducibility and comparability during follow-up assessments are of paramount importance.
The ADMIRE algorithm effectively maintains tissue CT values while significantly reducing image noise. The results of this study demonstrated that the CT values of the ascending aorta were not significantly different between the FBP and the ADMIRE 1-5 groups. In contrast, image noise decreased gradually with increasing iteration levels. This finding suggests that the ADMIRE reconstruction algorithm preserves tissue CT values while reducing noise, thereby ensuring the stability of these values. The ADMIRE algorithm integrates a systematic model, an anatomical structure-aware model, a raw data and statistical model, and a noise model, which together significantly decrease image noise while preserving the integrity of the information [13,19]. Furthermore, it has been shown that changes in the maximum, mean, and minimum values of coronary calcification are not attributable to the ADMIRE algorithm itself [13,19].
Different IR techniques yield varying effects on the quantitative assessment of CAC. In a study by Gebhard et al. [11], the use of Adaptive Statistical Iterative Reconstruction (ASIR) for CAC evaluation revealed that, as the ASIR percentage increased from 20% to 100%, the Agatston score decreased by 6.0% to 22.4%, and the CAC volume decreased by 3.7% to 18.6%, in comparison to the FBP algorithm. However, CAC mass exhibited no significant change as the ASIR percentage varied. This can be attributed to the fact that CAC mass is determined by the product of calcium density and volume. As the ASIR percentage increased, the edges of calcified plaques became smoother, leading to a reduction in volume. Conversely, the central portion of the calcification became denser, enhancing calcium density; thus, the overall quality of the CAC remained unchanged. In contrast to the findings related to ASIR, this study observed that calcified volume, mass, and the Agatston score decreased with increasing ADMIRE level, with percentage reductions being similar across these metrics. Specifically, in the ADMIRE 5 group, calcified volume, mass, and the Agatston score decreased by 32.55%, 32.57%, and 33.13%, respectively. Consistent with the SAFIRE CAC study, CAC volume, mass, and the Agatston score similarly decreased with an increasing SAFIRE level, with percentage declines also showing comparable trends. Across SAFIRE levels 1 to 5, all relevant parameters progressively decreased with increasing iteration levels [7,15].
The IR technique directly or indirectly influences the maximum CT value and the area of calcification, resulting in a reduction in CAC volume, mass, and Agatston score. As ADMIRE levels increase, the borders of intracoronary calcified plaques sharpen, and the inherent peripheral “halo artifacts” [20,21] are diminished. This reduction means that the number of pixels with elevated CT values due to peri-calcific artifacts decreases, leading to a reduced total area across different layers, and consequently a decrease in CAC volume. Furthermore, the ADMIRE algorithm decreases the maximum CT value of the calcification, which impacts CAC quantification. Since CAC mass is calculated as the product of calcification density and volume, a reduction in the maximum CT value leads to a corresponding decrease in calcification density, thereby indirectly affecting the CAC mass [1]. Conversely, the Agatston score represents a holistic assessment of calcification area, density coefficients, and layer thickness. Any factors that contribute to reduced CT values of calcification or volume changes will ultimately alter the Agatston score. In conclusion, the variations in the quantitative results of CAC are a combined effect of the ADMIRE algorithm, which is based on the overall reduction of image noise.
CACS quantification under conventional and low tube voltage (both gated and ungated) scanning conditions can be influenced by convolution kernels, thereby impacting the validity of cardiovascular risk assessments in patients [9,12]. The Sa36 convolution kernel is specifically designed for CACS quantification, employing iterative hardening correction techniques to ensure that human endoskeletal structures and calcified materials exhibit similar decay characteristics to those seen at 120 kVp across various tube voltages [9]. Essentially, the Sa36 kernel operates independently of tube voltage, enabling the creation of images equivalent to 120 kVp scans at tube voltages ranging from 70 to 110 kVp, as well as under energy spectrum purification protocols such as Sn100 and Sn150 [9,14,22]. Both modelling simulations and clinical studies have validated the accuracy of the Sa36 kernel for CACS CT at low tube voltages while simultaneously reducing radiation exposure to subjects [9,22]. Therefore, the Sa36 convolution kernel demonstrates significant potential for low-dose CACS CT applications.
CACS, based on CT images, is a significant predictor of adverse cardiovascular events and serves as a crucial indicator for the early diagnosis of CHD. Accurate measurement of CAC is clinically important for predicting the incidence of adverse cardiovascular events and guiding subsequent treatment decisions in cardiovascular disease [17,23]. However, in clinical practice, many hospitals rely on manufacturer-provided post-processing workstations that conduct manual quantification using semi-automatic thresholding technology. This process can be time-consuming for operators, generally has poor reproducibility, and may yield inconsistent results among different radiologists.
The introduction of AI can effectively address these deficiencies by improving measurement efficiency, minimising radiologist discrepancies related to varying experience levels, and stabilising results across multiple measurements. Additionally, AI can reduce the likelihood of medical disputes and provide more accurate data for clinical decision-making. It is important to note, however, that the accuracy of CAC AI is not flawless; it may mistakenly identify calcified lymph nodes and aortic calcifications adjacent to coronary arteries as coronary calcifications, leading to an overestimation of CAC. Furthermore, it may overlook some calcifications associated with polypoidal or microcalcifications in the distal segments of coronary arteries, resulting in an underestimation of CAC. Therefore, when utilising AI, verifying the accuracy of identified calcifications and manually correcting misidentified instances is crucial to ensure reliable results. With ongoing updates and advancements in AI technology, it is anticipated that the accuracy of identifying coronary calcifications will continue to improve.
In this study, the mean ED for the 254 patients was 0.61 mSv at 120 kVp, which is lower than the mean ED (120 kVp) reported for a gated 256-slice Philips spiral CT (1.5 mSv) [12], a GE Revolution CT scanner (1.80 mSv) [24], and a second-generation dual-source CT scanner (0.81 mSv) [11]. Furthermore, it is noteworthy that in the National Lung Cancer Screening Trial (NLST), the total effective dose for whole chest CTs with a BMI ≤ 30 kg/m2 was approximately 3.0 mSv, representing about one-fifth of the total effective dose associated with conventional low-dose CT (LDCT), which ranges from 0.6 to 1.5 mSv [25]. While in third-generation dual-source CT scanners, equipped with a low tube voltage of 70 kVp [26] and energy spectrum purification technology [14,19], the radiation dose associated with CACS remains higher than desired. The IR algorithm can reduce image noise; however, excessively low radiation doses may lead to increased image noise with the FBP algorithm. This noise may be misidentified by manual semiquantitative approaches or AI as calcification speckles, potentially resulting in false positives during CAC quantification [27,28]. Consequently, CACS CT guidelines recommend reconstructing images with a layer thickness of 3.0 mm and with image noise constrained to less than 20 HU [29,30]. Some studies, such as those conducted by Christian Tesche et al. [14], did not account for the effects of image noise on CAC. In their study, the FBP image noise for a 3.0 layer thickness exceeded 20 HU. Similarly, Tang YC et al. [31] and Georg Apfaltrer et al. [32] reported that the noise of FBP images at a layer thickness of 3.0 mm and 120 kVp was over 20 HU. The methodologies in these studies may lack rigor, leading to potentially inaccurate CAC results. In this study, we employed a conventional tube voltage of 120 kVp and automatic mAs exposure technology, activating the CARE Dose4D function during scanning. This system adjusted the tube current at various scanning levels based on localised images, thereby preventing “photon starvation” caused by insufficient tube current. As a result, diagnostic images fulfilling the quantitative requirements of CACS were obtained while ensuring appropriate radiation doses for each patient. Additionally, the third-generation dual-source CT scanner is equipped with 3D camera intelligent positioning technology, enabling more accurate determination of the horizontal centreline and further optimisation of scanning doses [33,34].
This study had several limitations: (1) a fixed tube voltage scanning protocol was employed without individualised settings; (2) manual measurements were not conducted using post-processing software, requiring further investigation into the consistency between manual semi-quantitative assessments and AI measurements; (3) only one type of convolutional kernel (Sa36) was utilised, with no exploration of additional convolutional kernels (e.g. Qr36, Br36, etc.); and (4) this study only assessed total coronary artery calcium volume, mass, and Agatston score, lacking a detailed evaluation of the number of CAC blocks and each branch of the coronary arteries (specifically, the left main stem, left anterior descending branch, left circumflex branch, and right coronary artery). In future, we aim to expand the sample size, utilise various convolutional kernels, conduct manual semiquantification, and analyse the branches of the coronary arteries in detail to further investigate the impact of different reconstruction parameters on CACS quantification.
Conclusions
The ADMIRE algorithm significantly reduces image noise, thereby leading to decreases in both the maximum and average CT values of calcified plaques, which results in a substantial reduction in the volume, mass, and Agatston score of coronary artery calcification. The high-level ADMIRE algorithm decreases the assessment of coronary risk. For follow-up evaluations of patients with coronary artery calcification, it is recommended that the same level of reconstruction algorithm be utilised.