Introduction
Iron is an essential component of numerous proteins involved in vital metabolic processes, such as hemoglobin and cytochromes [1]. However, when present in excess, iron can be highly toxic and lead to dangerous multi-organ complications. Since the body lacks natural mechanisms to excrete iron, any excess is first stored in the liver, which serves as the primary organ for iron storage. When iron accumulation becomes severe, the consequences appear in other organs, including the spleen, pancreas, bone marrow, heart, and endocrine glands.
Detecting iron overload in pediatric oncology poses a diagnostic challenge for clinicians due to the asymptomatic onset of hemochromatosis. Secondary hemochromatosis represents a significant clinical problem in hemato-oncologic patients, and requires close collaboration between oncologists and radiologists. Due to the dynamic development of radiology over the last two decades, numerous non-invasive methods for assessing iron overload have been introduced and examined.
Magnetic resonance imaging (MRI) is a universally accepted and favored method of evaluating liver iron overload. Despite various publications on MRI techniques, there is still a lack of standardized quantification of liver iron concentration (LIC) using MRI in the pediatric population.
Magnetic resonance techniques for assessing tissue iron content can be categorized into two groups: signal intensity ratio (SIR) and relaxometry. Within these categories, several techniques have been identified, including methods that assess SIR based on T2-weighted (spin-echo) or T2*-weighted (gradient-echo) sequences, relaxometry methods that measure absolute T2, relaxometry methods that measure absolute T2*, and quantitative susceptibility mapping (QSM) [2-5]. Most of these techniques have been discussed before in relation to adult patients. In this article, we present a brief description of those methods, followed by a more detailed insight into the advantages and limitations of the presented techniques. Our goal is to explore the application of these techniques in a pediatric oncology setting while considering the limitations associated with imaging children. In this patient population, the duration of procedures and the use of anesthesia are critical factors. The most extensively studied group of patients with hemochromatosis consists of adolescents diagnosed with beta-thalassemia major. Evaluating pediatric oncology patients may require a different approach due to factors such as their higher water content compared to adult tissues. Further research in the population of pediatric oncology is much needed.
Relaxation theory
The assessment of iron accumulation in tissue relies on T2-relaxation shortening. Ferritin-bound iron affects MRI signal through the spin-spin relaxation mechanism, which impacts how signals are emitted from tissue during the examination. Hemosiderin iron creates magnetic field inhomogeneities that lead to spin dephasing. These properties are used to estimate tissue iron levels. Interactions between these proteins and water molecules cause increased T2 relaxation [4]. The difference in solubility and intracellular distribution between ferritin iron (soluble, evenly spread out) and hemosiderin iron (insoluble, grouped in irregular micron-sized clusters with separations of 10-30 μm) [6] leads to diverse effects on MRI signal deterioration. Ferritin iron primarily influences MRI signal decay through molecular spin–spin relaxation mechanisms, whereas hemosiderin clusters predominantly create magnetic field inconsistencies that result in spin dephasing [7,8]. Current MRI techniques used to estimate tissue iron levels aim to measure the total iron deposition (ferritin + hemosiderin) by analyzing SIRs or relaxation rates [9,10] via equations such as R2 = 1⁄T2 and T2* = 1⁄T2*.
SIR
The SIR method is based on the comparison of the signal from the paraspinal muscle and liver obtained from multiple gradient-echo sequences (GREs). Both SIR methods – one proposed by Gandon, and the other by Alústiza – have been verified at 1.5 T.
In 2004, subsequent adjustments to the technique were introduced by Gandon et al. [4], who proposed dividing the signal intensity of the specific organ by the signal intensity of a reference tissue (fat or muscle) or noise. Signal-intensity assessments are conducted in five separate breath-hold GREs; this approach allows for constant TR (repetition time) but operates on various angles from 20° to 90° to adjust T1 and T2 weighting with echo times ranging from 4 to 21 ms.
Castiella et al. [11] proposed a method that employs only two echo times (4 and 14 ms) and a different mathematical formula to estimate the LIC. Studies show that the model of the Spanish Society of Abdominal Imaging produces results that are more closely associated with R2* and LIC values obtained from liver biopsies [12].
The suggested procedure for SIR analysis involves placing three regions of interest (ROIs), including one in the right lobe of the liver and two in the left and right paraspinal muscles. This can result in divergent liver/muscle SIRs among all five sequences [13].
For SIR calculation, different reference tissues have been considered; however, the paraspinal muscles have emerged as the preferred option due to their optimal balance of sensitivity and minimal intersite variability [4,12,14]. However, in patients with sarcopenia or myosteatosis, muscle tissue may be a source of additional unpredictability.
In the case of larger organs such as the liver, spleen, and pancreas, multiple ROIs are used and placed in regions lacking vascular structures and motion artifacts [4,5,15,16].
The SIR method relies on detecting a decrease in signal intensity due to T2* shortening in iron overload-affected organs compared to a reference tissue that is assumed to be free of iron accumulation. In this comparison, the signal intensity of healthy tissue (without iron overload) should consistently surpass that of the paraspinal muscles [13].
The biggest drawback of this method is the lack of reliability with iron level > 19.5 mg/g dry weight. Due to the chemical shift caused by iron-bound proteins, the signal from the liver in cases of heavy iron overload may be completely lost [17].
Gandon et al. [4] did not find any significant relationship between liver steatosis and the reliability of LIC measurements. They highlighted that fatty liver primarily affects signals from T1-weighted images. Despite these findings, the effect of steatosis and fat saturation on the assessment of iron overload still requires further research [18]. Standardization of parameters during the procedure could improve the validity of the results.
T2 relaxometry method
Evaluating the T2 relaxation time (transverse relaxation) reveals the loss of coherence between individual protons following a radiofrequency pulse. The paramagnetic characteristics of iron reduce the T2 relaxation time, allowing for an evaluation of hepatic iron overload [19]. This technique typically requires five echo times (6, 9, 12, 15, and 18 ms) and a repetition time of 2500 ms [20].
The “speed-up” of T2 relaxation is proportional to the degree of iron burden in the examined tissue, resulting in a decay of signal intensity in the liver [21]. The transverse magnetization decay curve illustrates the relationship between the transverse magnetization over time following deactivation of the radiofrequency pulse. Relaxometry is assessed using the voxel technique, which allows for reliable tissue evaluation and reduces the risk of operator-dependent error. During the calculation of T2 relaxation time, a single voxel is meticulously positioned within the liver, clear of significant vessels, large bile ducts, and lesions. It is typically placed in the posterolateral portion of the right lobe; however, the final position depends on the protocol and the presence of artifacts. The signal intensity from the single voxel is then plotted against the echo times. The following exponential decay function is then fitted to these data points:
The signal intensity (S) at each echo time (TE) follows the free induction decay (FID) curve, which is influenced by T2*. Here, S0 represents the initial height of the FID curve. T2* is a combined relaxation time that incorporates T2, the effects of main field inhomogeneities, tissue susceptibility, and proton diffusion [22].
The transverse relaxation process within an iron-overloaded liver is considered at least biexponential by nature. Exponential R2 image analysis involves estimating the initial signal from protons within a specific ROI. This estimation takes into account the strength of the radiofrequency field. Creating a map of how dense the proton spins are requires considering a material that surrounds the analyzed area with a high density of spins and a long relaxation time (T2) [22,23]. Based on this, the map of T2 relaxation for the liver can be generated.
An analytical model was developed to create the standardization curve linking liver R2 values with LIC values obtained from biopsy [24]. This involved fitting curves to the data using non-linear regression algorithms. This calibration curve was obtained from phantoms or known standards. The calibration relationship derives the LIC from the T2 values. Lower T2 values indicate higher iron concentrations.
T2* relaxometry method
Unevenly distributed iron deposits behave like tiny bar magnets, creating small-scale magnetic field inhomogeneities. These irregularities cause protons within a voxel to spin at varying frequencies, leading to T2* relaxation, which is influenced by these variations in the main magnetic field.
This method is used to assess T2* or by employing multiple gradient-echo sequences with different TE values [10]. The aim is to speed up data acquisition to improve sensitivity and eliminate artifacts from respiration or cardiac motion. In calculating R2* values, the signal decay curve is commonly modeled using an exponential function, as follows:
where S is the signal intensity, TE is the echo time, and S0 represents a constant signal intensity [10]. Breath-hold sequences eliminate interslice variability caused by differences resulting from patient movements [25]. This technique has been mainly used to assess myocardial overload with cardiac gating [26-28]. The technique is not free of limitations, which include measurement variability caused by factors such as noise disruption, associated liver fat, or magnetic field dissimilarities.
QSM
QSM is a robust, non-invasive MRI method that measures magnetic susceptibility [29]. This approach may be a new technique for examining iron overload, as it demonstrates a good correlation with LIC. The major advantage of QSM is that it allows for the assessment of hepatic iron without interference from conditions such as fibrosis and fat. QSM quantifies the spatial distribution of magnetic susceptibility (χ) generated by the magnetic properties within the tissues [29]. The magnetic susceptibility distribution consists of local and background susceptibility. Local susceptibility represents the susceptibility disruption within the tissue of interest, usually originating from ferritin or hemosiderin. Two or more echoes can assess the local magnetic field. Later, this information can be used to calculate the magnetic field distribution relative to the underlying susceptibility distribution [29]. All images are captured within a single breath-hold. This requirement makes applying QSM challenging in a pediatric oncology setting, especially for young children. The image process uses short echo times and minimal echo spacing to capture the rapidly weakening signal, especially in cases of significant hemosiderosis [29].
The magnetic susceptibility disruption (χ) can be separated into two components: local (χL) – within spatial ROIs (e.g. tissue); and background (χB) – outside of the ROI. As a result, each spatial point within the susceptibility distribution corresponds to either χL or χB, but not to both simultaneously. There is a mathematical correlation between the susceptibility distribution and the shift in resonance frequency induced by inhomogeneities in the B0 field [30]. The estimation of the B0 field map is achieved through chemical shift-encoded reconstruction, which incorporates models of water and different fat peaks in the spectrum. During the reconstruction process, spectral modeling corrects the B0 field map for the presence of fat [29]. There is a linear relationship between liver iron concentration and magnetic susceptibility, which facilitates reliable quantification of liver iron using QSM. After creating the quantitative susceptibility map, a local relative susceptibility value (ΔB0), in parts per million (ppm), can be derived from a specific ROI. This value can then be compared with the amount of hepatic iron [29].
The prospect of using QSM for examining the pancreas seems very promising. Kemp et al. [31] emphasize its potential to be a new, highly sensitive tool for diagnosing and monitoring pancreas-related diseases, such as metabolic syndrome and endocrine dysfunction.
Comparison of MRI methodologies
The SIR method is generally considered the easiest method to apply across various vendors and platforms. According to guidelines from the European Society of Gastrointestinal and Abdominal Radiology (ESGAR) and the Society of Abdominal Radiology, SIR is considered a practical alternative when high-quality phased-array coils or relaxometry techniques are unavailable. This approach, however, has certain limitations. It shows reduced sensitivity in detecting severe siderosis in tissues where transverse relaxation occurs much faster than the TE [14]. Different investigators have proposed modifications to this method to improve its accuracy in the evaluation of severe siderosis [19]. Still, the SIR method is not suited to measure LIC values above 350 μmol Fe/g; in these instances, it simply categorizes the iron overload as “very high.” Although patients with such high iron levels clearly require treatment, the method’s inability to distinguish the full range of clinically significant LIC values is a drawback.
The SIR method also relies on the assumption that muscle is free of pathology. This assumption may be false in pediatric oncology patients, who are at high risk of sarcopenia or myosteatosis [31,32]. Relying on a reference tissue (muscle) adds extra variability, especially at low-to-moderate LIC levels and in patients with reduced muscle mass.
Another limitation of the SIR method pertains to the recommendation to use only the body coil and avoid surface coils, particularly those integrated into the patient’s bed. This precaution prevents signal gradients between the surface and depth. Failure to follow this guideline can result in a decrease in signal-to-noise efficiency. Even though the method involves “in-phase” echoes, it is essential to note that it does not address fat content, which may introduce notable bias [33]. When fat and water are present within the same pixel, opposed-phase GRE images present a relative loss in signal intensity [4].
Numerous studies have demonstrated a strong correlation between both T2 and T2* values and LIC as measured in liver biopsy for evaluating liver iron overload. However, these techniques come with certain challenges; their measurements are influenced by the MRI sequence parameters and the image-analysis method, and there is no universal agreement on which index (R2 or R2*) is optimal for measuring LIC. T2* calculations are sensitive to low iron content, but tend to be less accurate in cases of high iron overload. Another limitation is the requirement for a large number of echoes to sample the entire exponential decay of the transverse magnetization and minimize the uncertainty in the measured T2 result [34]. Another challenge is the selection of the calibration curve and its impact on the transferability of R2* measurements, regardless of the scanner type. To our knowledge, several studies have investigated calibration curves for MRI-based liver iron quantification. Henninger et al. [35] found a good correlation between the curves designed by his team and those of three other researchers – Wood [36], Hankins [37], and Garbowski [24,38]. A more standardized approach to MRI-based iron overload assessment is urgently needed [39].
The R2 method described by St. Pierre et al. requires an average data-acquisition time of 20 min, in contrast with the few minutes needed for implementing single breath-hold techniques [40]. However, examination times vary between different institutions and countries. Twenty minutes is a relatively short procedure. The time a patient spends inside the scanner is important, especially considering the unique needs of pediatric patients and procedural costs.
QSM has been a useful tool for the evaluation of brain iron levels. It has promising clinical applications, as it provides an opportunity to directly measure liver iron concentration based on MR susceptibility. However, the application of QSM in the abdomen faces additional challenges such as respiratory motion artifacts, the presence of fat, and rapid signal decay in cases of heavy iron overload. When LIC values are high, both the R2* estimates and the B0 field map are unreliable, which subsequently reduces the reliability of susceptibility map estimation. Background field removal and dipole inversion impose further difficulties [29]. Studies examining the accuracy of QSM have shown significant discrepancies, the causes of which remain unclear. Sharma et al. [30] attributed these discrepancies to the large spatial resolution, including slice thickness above 8 mm. In their study, large slices were necessary to obtain complete 3D coverage of the liver in a single breath-hold. This example highlights the need for standardized protocols and extensive research in this area.
QSM still has the potential to become an imaging biomarker of liver iron burden. The major advantage of quantifying susceptibility lies in using fundamental material properties (including iron and liver tissue), in contrast with experimental relaxation parameters (e.g., R2 and R2*), which may be disrupted by other factors [30].
All of the presented methods face certain challenges and significant limitations. Continued research is necessary to identify optimal imaging biomarkers that allow for quick, reliable, and cost-effective evaluations of iron overload in the pediatric oncology setting.
Table 1 presents a brief comparison of previously discussed methods of evaluating iron overload. No ideal technique for assessing hemochromatosis has been created; different methods are accurate for different organs.
Table 1
Comparison of methods of evaluating iron overload.
Summary
Iron overload is a serious condition that can lead to multi-organ complications in the pediatric oncology population. MRI offers highly effective tools for the non-invasive assessment of iron overload, allowing for early detection and monitoring. However, various confounding factors, such as image noise and intrahepatic fat, must be considered in MRI-based LIC assessment. Three primary MRI techniques – SIR, R2, and R2*– have been developed and validated. Based on the available literature, confounder-corrected R2*-based LIC appears to be the most practical method, offering the strongest evidence for accurate and reproducible quantification. These methods are commercially available for both 1.5-T and 3-T MRI scanners and are recommended as first-line approaches for iron quantification when available. SIR and R2-based LIC quantification are also reliable alternatives, with moderate-to-high levels of evidence supporting their use [41].
The ability to accurately estimate iron overload is crucial for treatment monitoring, including avoiding over- and undertreatment, maintaining safe levels of iron, and reducing the risk of dangerous long-term complications. It is necessary to standardize non-invasive measurements of LIC so that clear inferences can be drawn about body iron levels associated with hepatic and extra-hepatic complications of iron overload. Examples of proposed references are presented in Table 2 [4,12,18,28,42].
Table 2
MRI-based reference and threshold values for iron quantification across organs
In the adult population, both T2*-weighted imaging and the SIR method are commonly used; however, only T2* is considered the method of choice for assessing cardiac iron overload due to its functional mobility. QSM is increasingly used for the assessment of iron overload in the pancreas and spleen. In the pediatric population, the most common and well-characterized cause of secondary iron overload is frequent blood transfusions. So far, there is a lack of literature comparing iron overload resulting from chemotherapy to that caused by blood transfusions. For the pediatric population, the T2* technique remains the gold standard for evaluating hepatic and cardiac iron overload, while SIR is considered insufficiently accurate [38].
The lack of reference value ranges significantly limits the use of MRI in the pediatric population, regardless of the method used to assess iron overload. We conducted a thorough search and analyzed nine studies, focusing on accepted reference values across various centers. To date, only two studies – one by Wood and the other by Berdoukas – have examined pediatric and adolescent populations. Wood et al. [27] focused solely on transfusion-dependent iron overload, measuring T2 and studying correlations with clinical findings such as tachycardia and depressed ejection fraction. Secondary iron overload is usually detected in adulthood during the diagnostic process for chronic diseases such as heart failure; however, the age at which it first occurs remains unknown. Berdoukas et al. [43] attempted to establish the dynamics of iron overload in the pancreas, liver, and heart in different diseases (sickle cell anemia, beta-thalassemia major, Diamond-Blackfan anemia). They also reported having similar data for patients receiving chemotherapy. However, to date, there are no similar publications regarding pediatric oncology patients receiving chemotherapy. This highlights the need for careful tissue iron monitoring to establish iron loading patterns and to develop optimized methods for pediatric oncology patients.
Improving the accessibility of MRI methods and validating their efficacy in pediatric oncology settings is crucial. Long-term follow-up of pediatric oncology patients using MRI techniques will significantly improve their quality of life and reduce the risk of premature mortality.
Based on the available literature, confounder-corrected R2*-based LIC appears to be the most practical method, offering the strongest evidence for accurate and reproducible quantification. Figures 1-3 present the use of R2 analysis for automatic liver iron quantification.
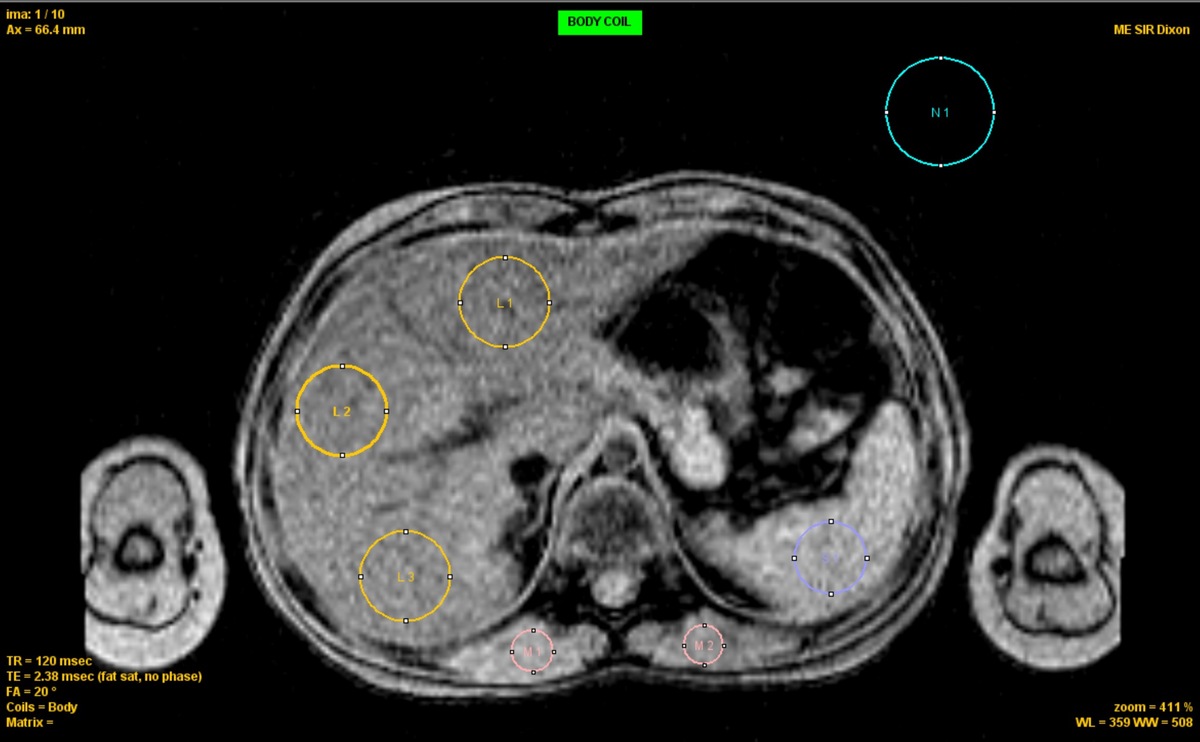
Figure 1
ROI placement for R2* analysis Axial ME-GRE image showing ROIs for liver (L1-L3, yellow), spleen (S1, blue), muscle (M1-M2, red), and background noise (N1, cyan). ROIs were selected to avoid vessels and organ boundaries. Acquisition: TR = 120 ms, TE = 2.38 ms, FA = 20°
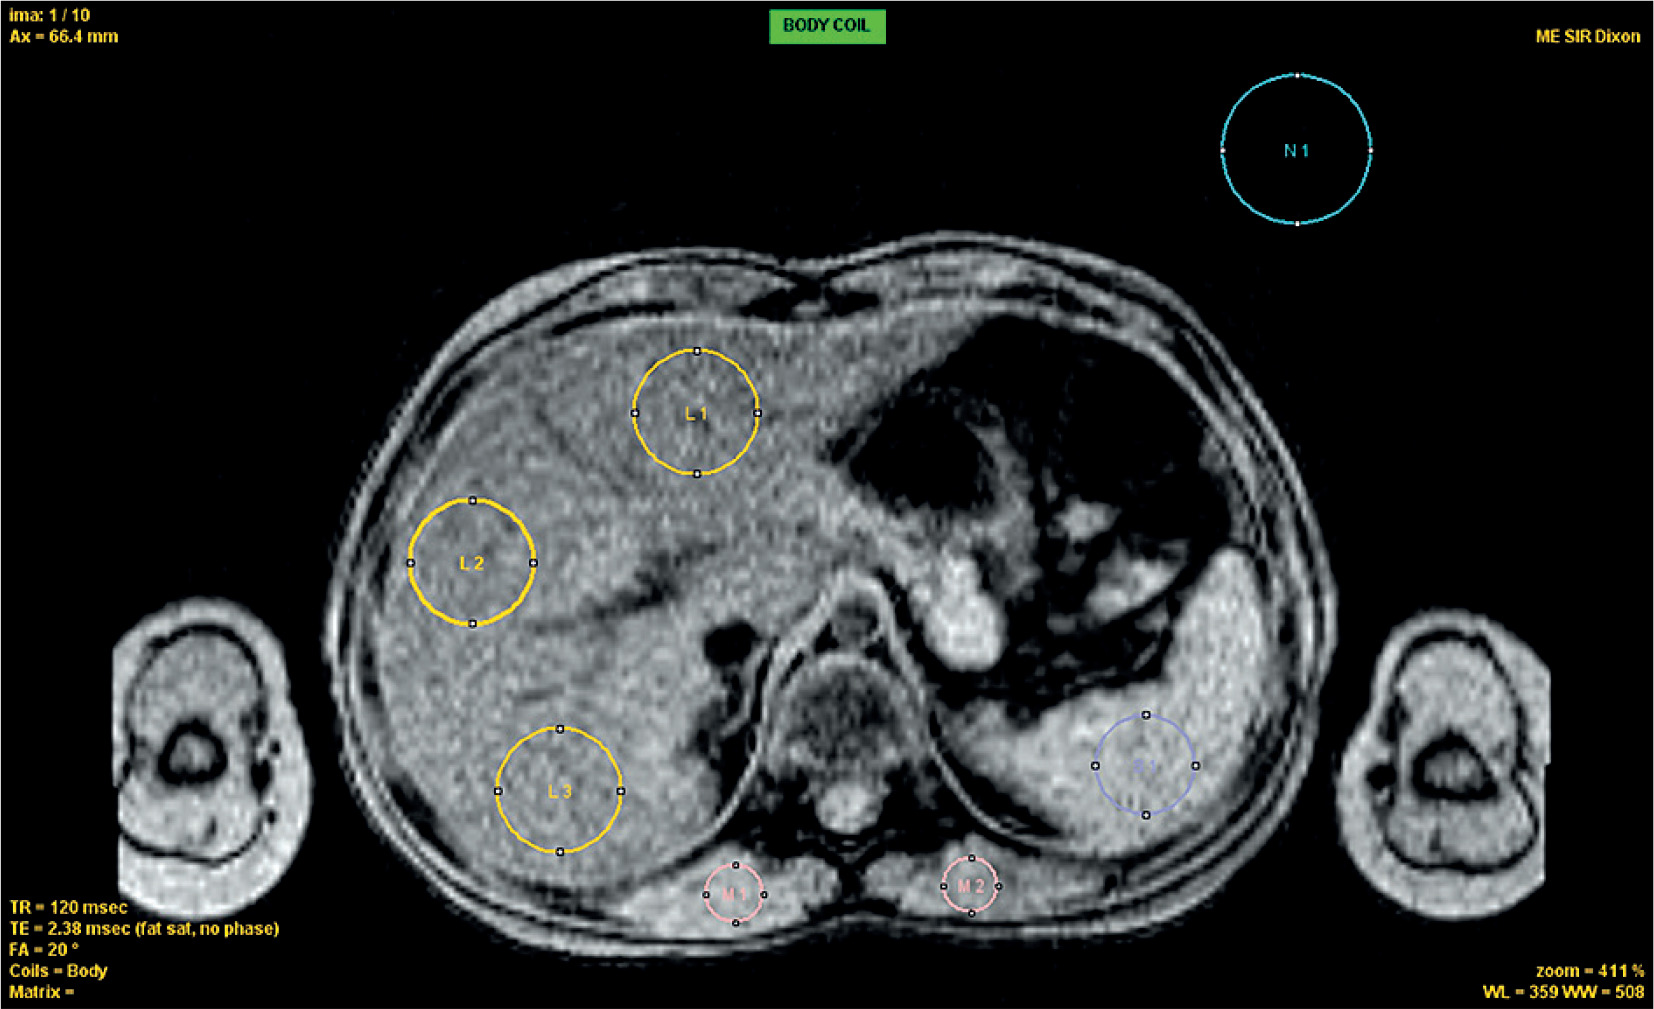
Figure 2
Signal decay curves and R2* fitting. Signal intensity decay as a function of echo time (TE) for liver (red), spleen (blue), and muscle (pink). Liver shows rapid signal loss, indicating elevated R2* (112 s–1). Spleen and muscle show slower decay (53 and 31 s–1, respectively). Noise level is indicated by the horizontal line (62.6). Curves are fitted using exponential models
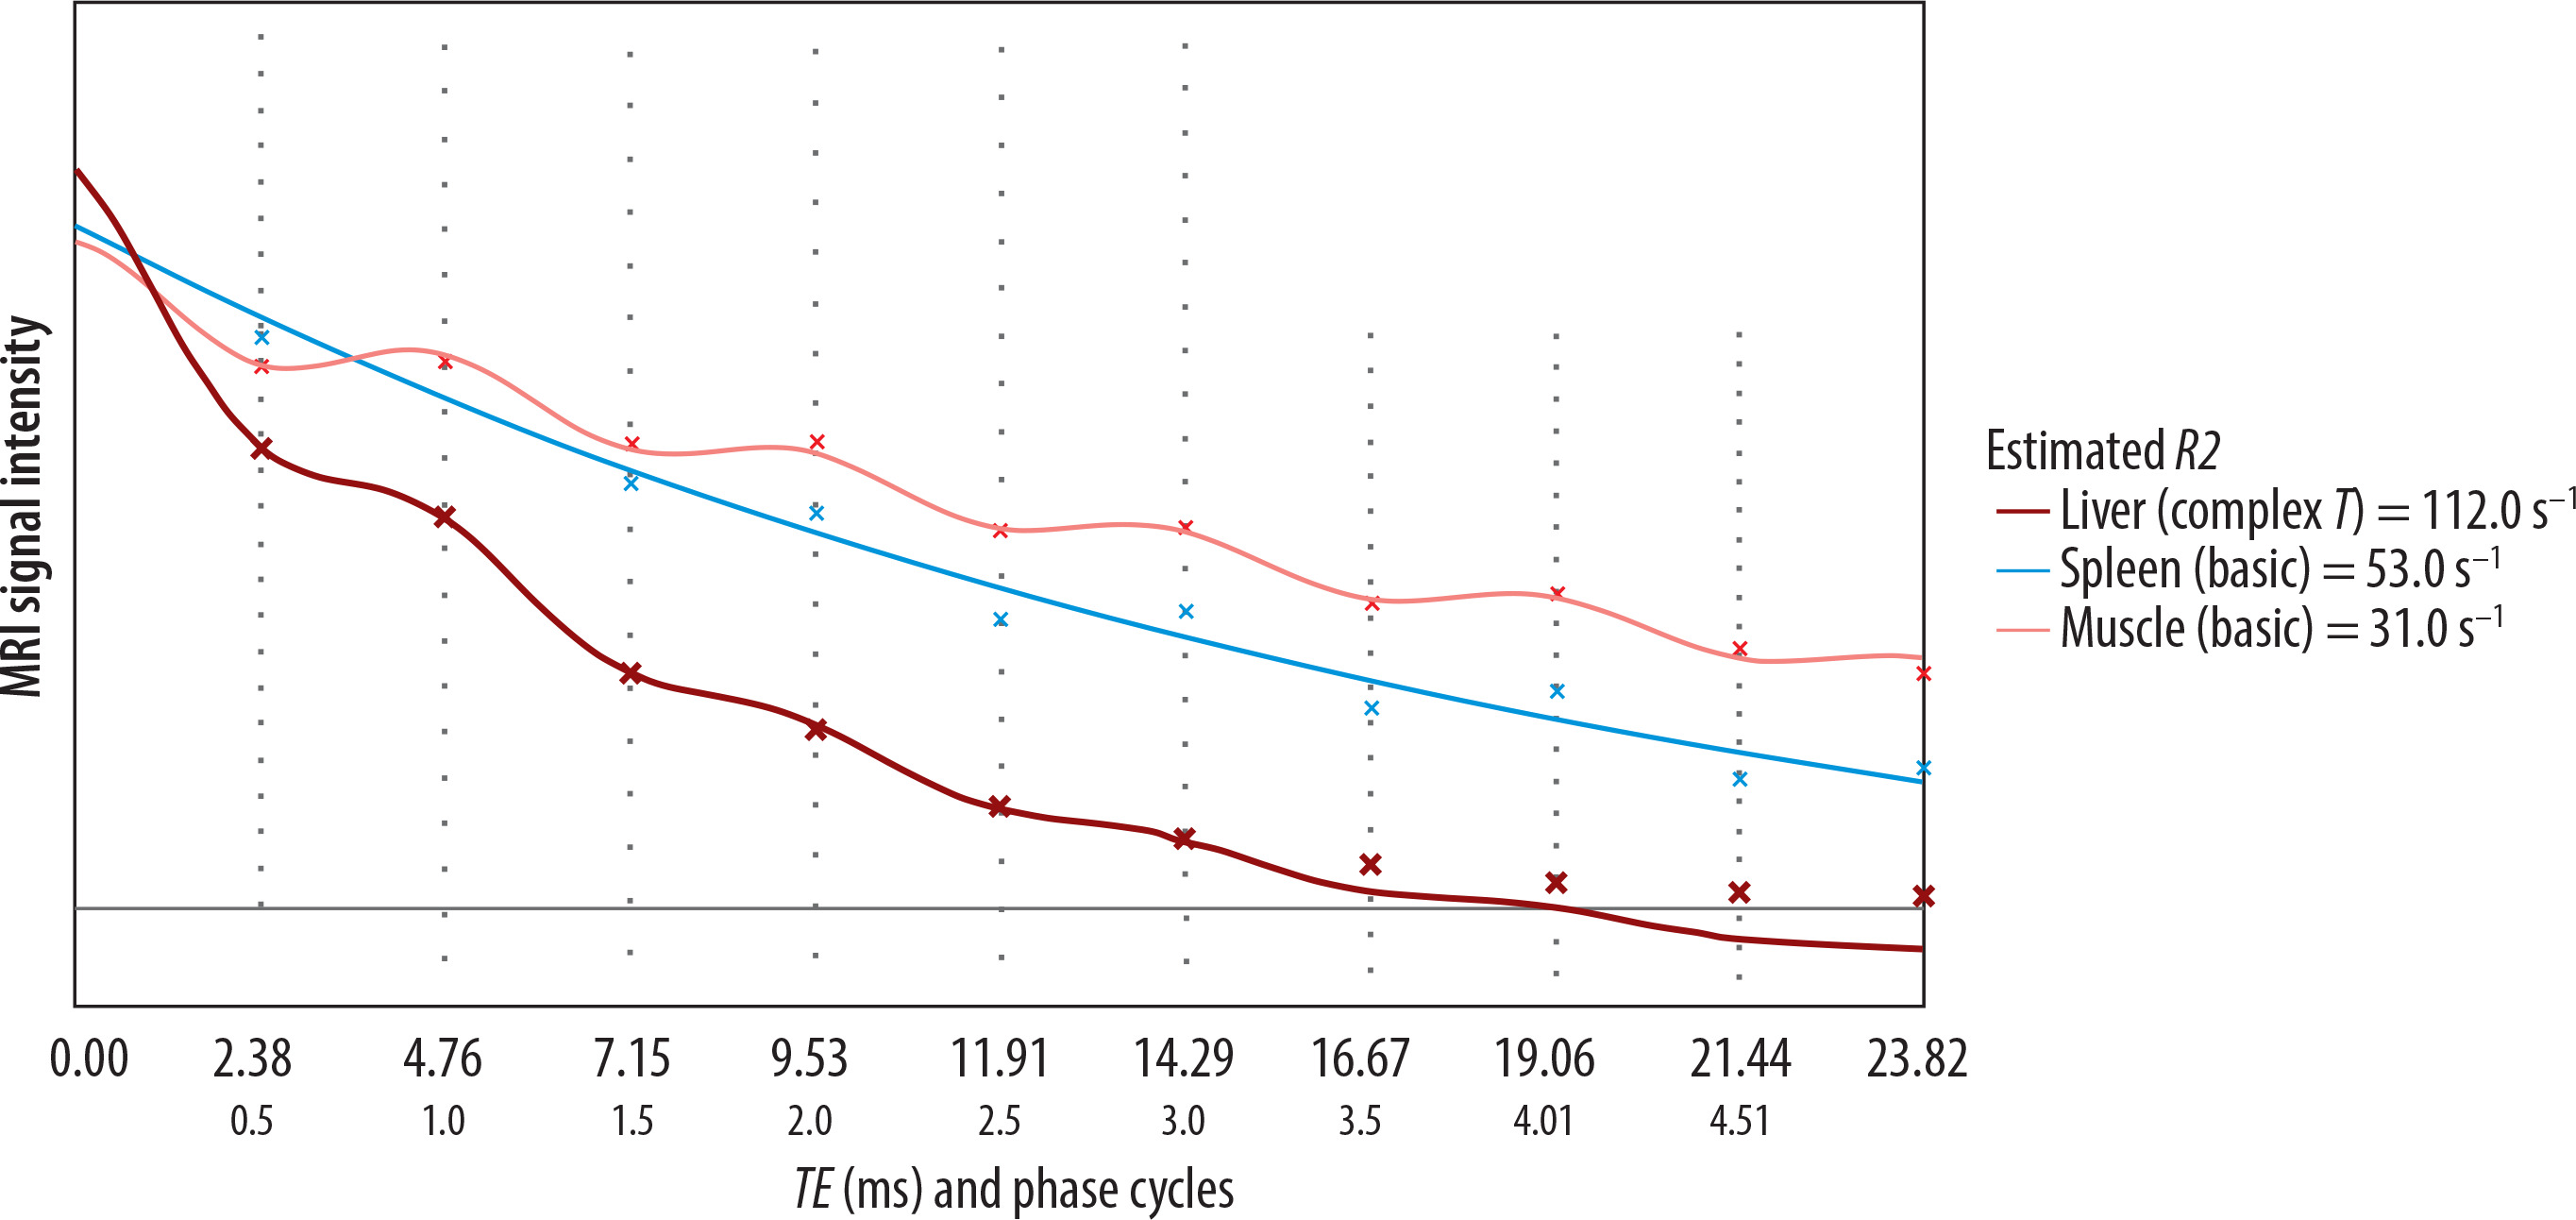
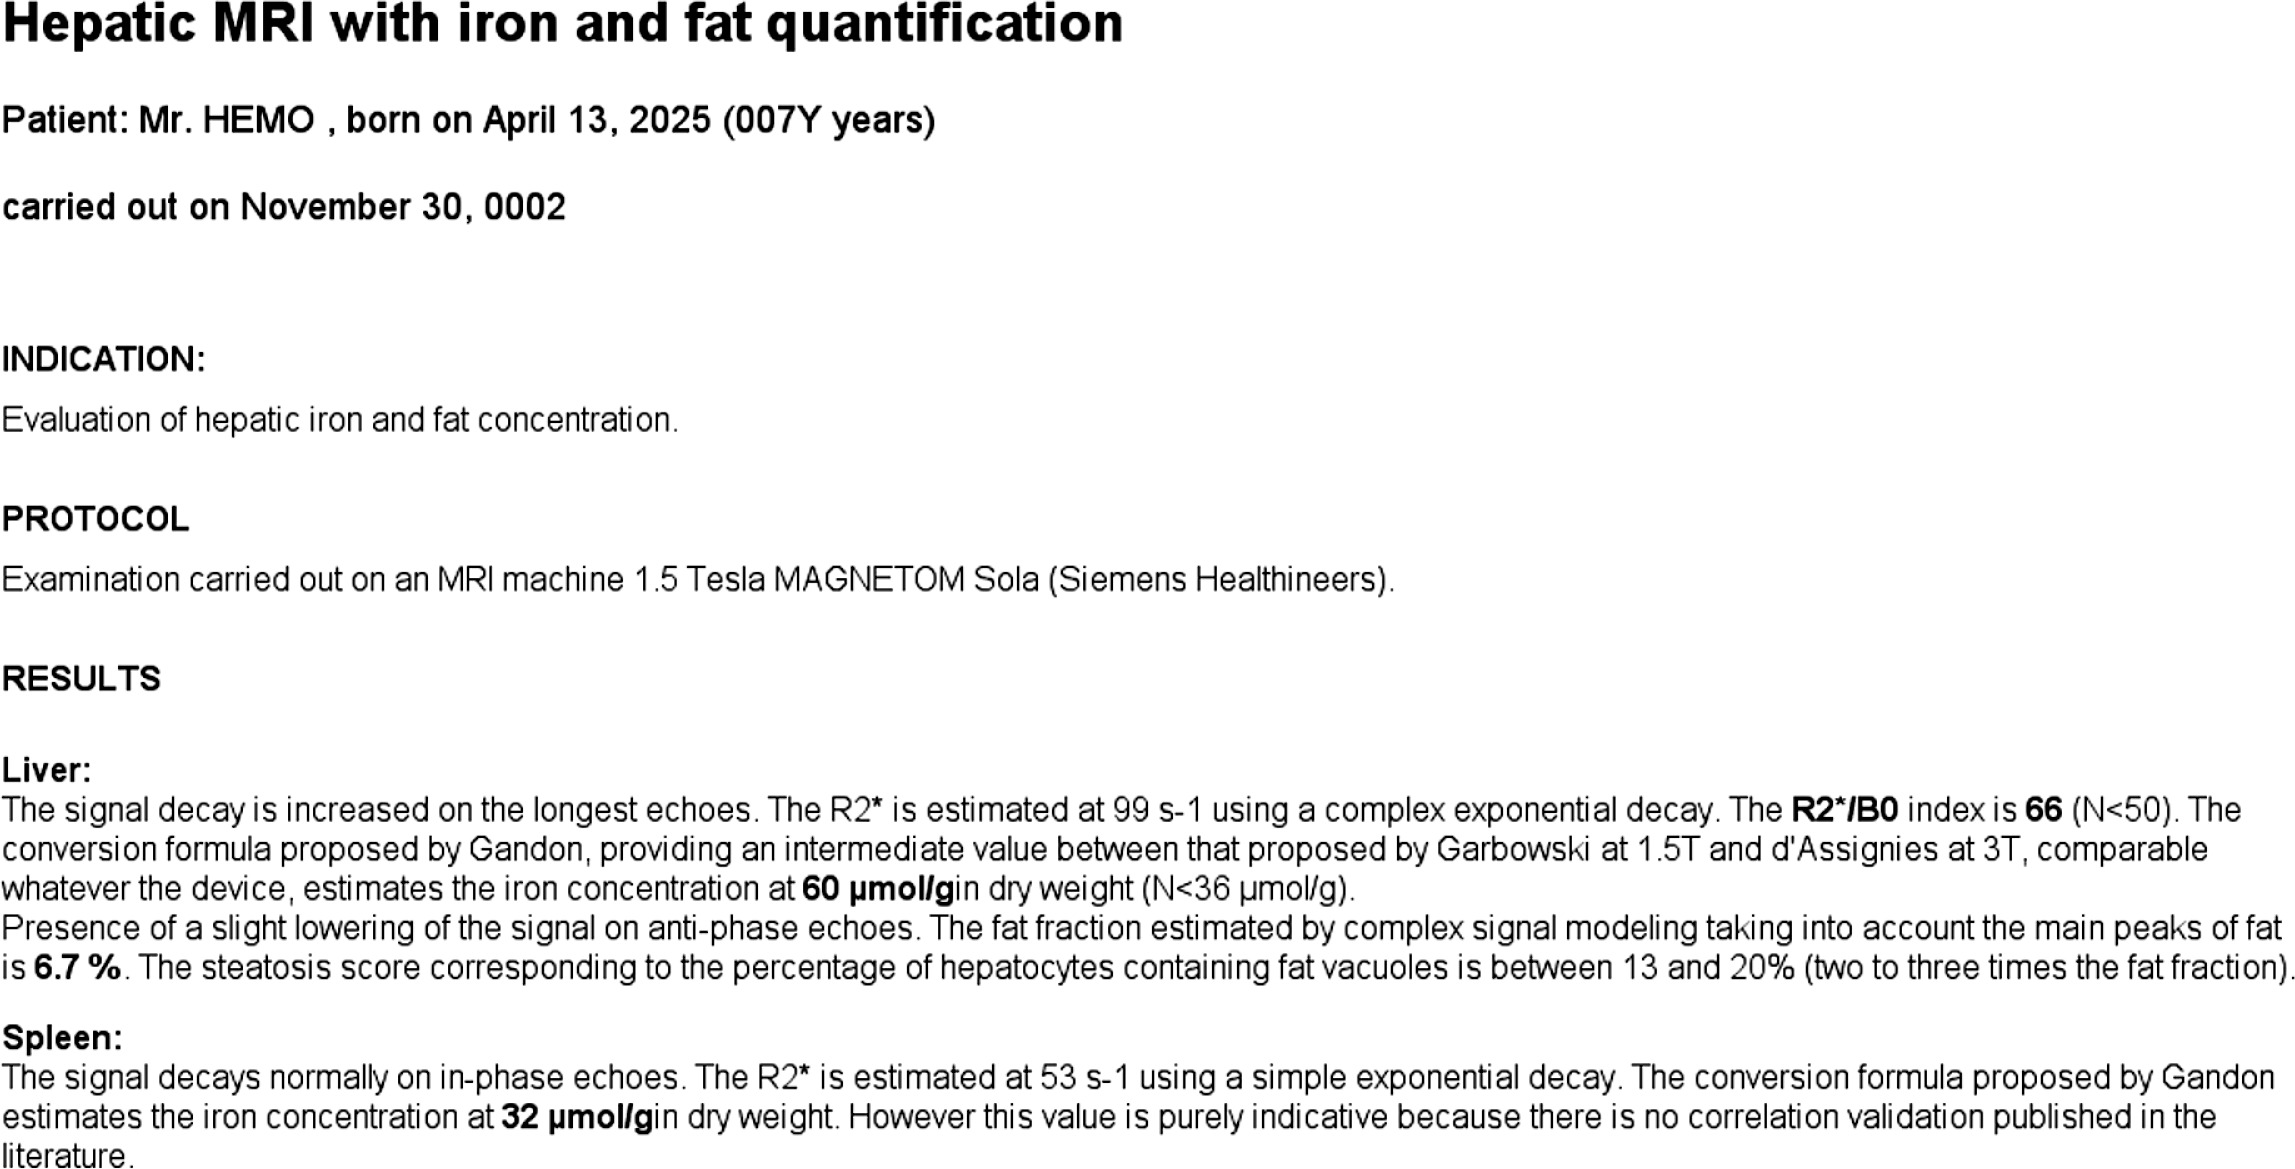
Figure 3
Automated liver iron and fat quantification report. R2* in the liver is 99 s–1, corresponding to an iron concentration of 60 μmol/g dry weight. Fat fraction is estimated at 6.7%, consistent with mild steatosis (13-20% of hepatocytes affected). Spleen R2* is 53 s–1 with an indicative iron level of 32 μmol/g