Introduction
Laryngeal squamous cell carcinoma (LSCC) is a significant global health concern, with approximately 184,615 new cases and 99,840 deaths reported in 2020 (age-standardised rate [ASR]: 2.0 and 1.0 per 100,000, respectively) [1]. Incidence and mortality rates vary geographically, being highest in the Caribbean (ASR = 4.0) and Eastern Europe (ASR = 3.6), with men having a sevenfold higher risk than women [1]. Over the past 3 decades, the incidence of LSCC has risen, while mortality has declined slightly, probably due to reduced tobacco and alcohol use and advancements in diagnostic and treatment strategies.
In LSCC, in addition to well-established prognostic factors such as clinical (TNM classification, age, smoking), molecular (HPV association, TP53 mutations), and treatment-related factors (organ preservation vs. surgery, surgical margins, response to treatment), pathological features – including lymph node metastasis (LNM), extranodal extension (ENE), lymphovascular invasion (LVI), and thyroid cartilage invasion (TCI) – also play a crucial role [2–6]. Accurate preoperative assessment of these characteristics is essential for determining optimal surgical and therapeutic strategies. Conventional imaging modalities such as computed tomography (CT) are fundamental for cancer staging but may be limited in detecting subtle microstructural changes indicative of aggressive histopathological behaviour.
CT-based texture analysis enables preoperative prediction of histopathological features, optimising surgical planning and treatment strategies [7–9]. This approach provides non-invasive predictive insights, facilitating the determination of surgical extent, guiding the need for adjuvant therapy, and improving prognostic assessment while reducing unnecessary interventions.
Over the past decade, advanced analytical techniques, including texture analysis and radiomics, have gained increasing attention in radiology research [10]. Texture analysis, a radiomics-based approach, quantifies tumour heterogeneity by evaluating pixel intensity distributions within imaging data. This method has shown promise in improving diagnostic accuracy, prognostic assessment, and treatment response evaluation across various malignancies [11–13]. However, studies investigating texture-based models for predicting key histopathological features in LSCC remain limited.
Recent studies suggest that CT-derived radiomic features may aid in predicting the histopathological characteristics of LSCC. Guo et al. [14] analysed contrast-enhanced CT images from 265 LSCC patients and demonstrated the potential of machine learning-assisted radiomic models for detecting thyroid cartilage invasion, achieving superior diagnostic accuracy compared to radiologists. These findings support the growing role of radiomics as a non-invasive tool in oncologic imaging.
Radiomics has also been explored for survival prediction in LSCC. Rajgor et al. [15] identified specific radiomic features, such as shape compactness and grey-level zone length matrix non-uniformity, as independent prognostic biomarkers in advanced LSCC. Elevated values of these features correlated with poorer 5-year disease-specific survival, suggesting their potential role in refining treatment strategies. These findings underscore the clinical utility of advanced imaging analyses in improving the diagnostic and prognostic evaluation of LSCC.
This study aims to evaluate the predictive value of CT-based texture analysis for identifying key histopathological features in LSCC, including LNM, ENE, perineural invasion (PNI), LVI, and TCI. By analysing radiomic features extracted from contrast-enhanced CT images, we seek to develop a non-invasive preoperative assessment tool that may enhance clinical decision-making and improve patient stratification for treatment planning.
Material and methods
Patient selection
This study was initiated after obtaining approval from the institutional Ethics Committee (Ethics Committee approval: decision No. 2024/247, date 08.01.2025).
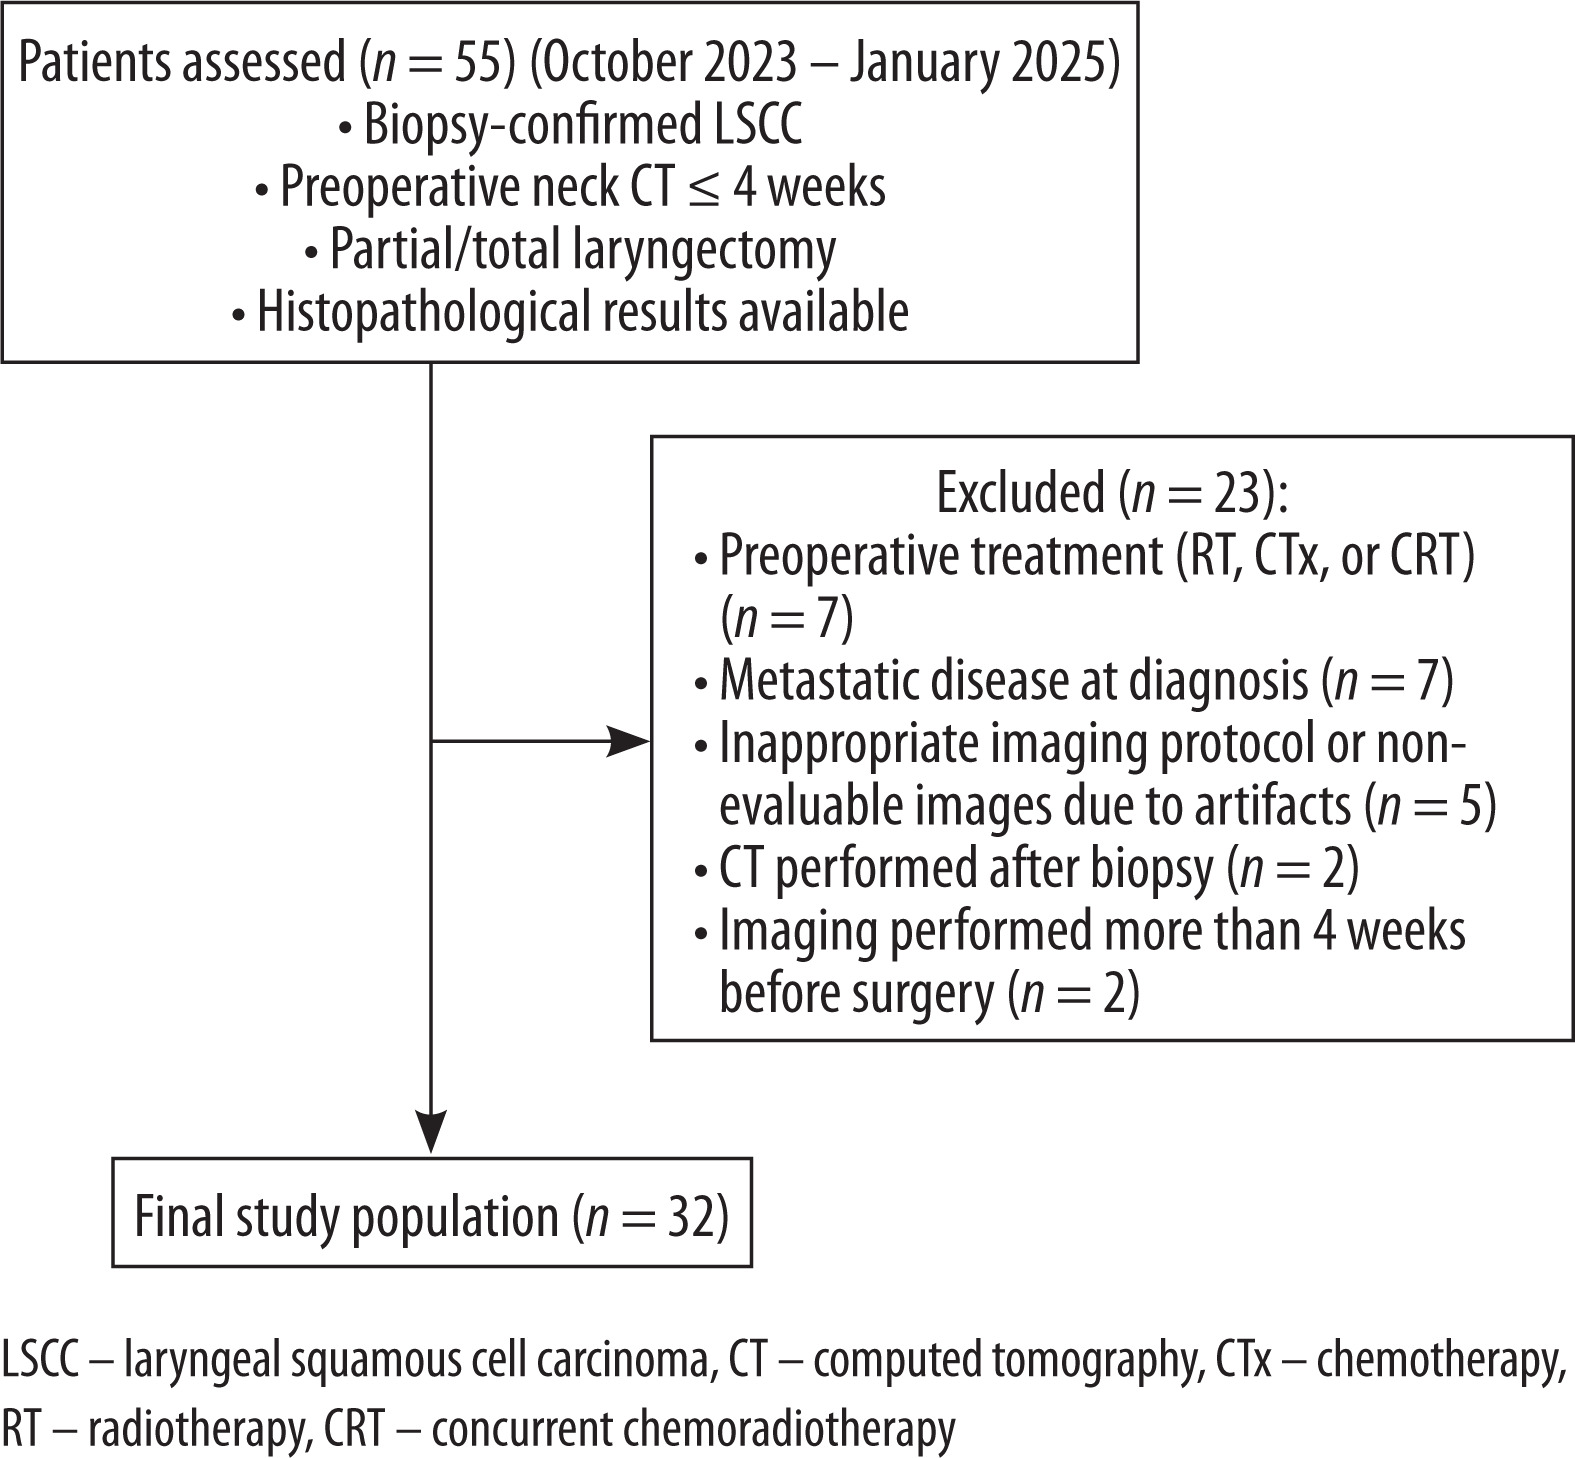
Between October 2023 and January 2025, patients diagnosed with LSCC via biopsy, who underwent preoperative neck CT within 4 weeks before surgery, underwent partial or total laryngectomy, and had available histopathological results, were included.
Exclusion criteria included:
patients who received preoperative treatment (radiotherapy [RT], chemotherapy [CTx], or concurrent chemoradiotherapy [CRT]) (n = 7),
patients with metastatic disease at diagnosis (n = 7),
patients with imaging performed with an inappropriate protocol or images non-evaluable due to artifacts (n = 5),
patients who underwent CT after biopsy (n = 2),
patients with imaging performed more than 4 weeks before surgery (n = 2).
A total of 32 patients were included in the study (Figure 1).
CT imaging protocol
All CT scans were performed using a 256-detector CT scanner (GE Revolution EVO, GE Healthcare, Milwaukee, WI, USA). The scanning area covered the neck from the skull base to the thoracic inlet.
The scanning parameters were as follows: 120 kV, pitch 0.98, detector collimation 40 × 0.625 mm, rotation time 0.8 s, matrix 512 × 512, section thickness 0.625 mm, field of view, 220-250 mm, and automatic tube current modulation (8-320 mAs).
A non-ionic contrast agent (Ultravist 370 mg iodine/ml, Berlin, Germany) was administered using an automatic injector at 2-3 ml/s, followed by a 30-50 ml saline flush. Imaging was performed 40-50 s post-contrast in the venous phase.
CT-based texture analysis methodology
Texture analysis was performed using the freely available software LIFEx (Version 5.1, www.lifexsoft.org). Axial CT images were imported in Digital Imaging and Communications in Medicine (DICOM) format for radiomic feature extraction. The LIFEx software enabled synchronised visualisation of axial, coronal, and sagittal slices to facilitate precise tumour delineation [16]. All patient data were fully anonymised before image export and analysis to ensure confidentiality.
Two radiologists (with 17 and 8 years of experience in head and neck radiology) jointly performed the manual segmentation on axial contrast-enhanced CT images, blinded to histopathological outcomes. To minimise partial volume effects, regions of interest (ROIs) were manually delineated slightly within the tumour borders on each slice, with no ROI drawn on the first or last slices where the lesion was visible. Cystic areas were excluded from the delineation process.
For thyroid cartilage involvement, the ROI was drawn around the tumour region involving the thyroid cartilage. If the tumour extended across the cartilage to form an extralaryngeal mass, the extralaryngeal region was also included, while normal-appearing cartilage on the CT images was avoided (Figure 2).
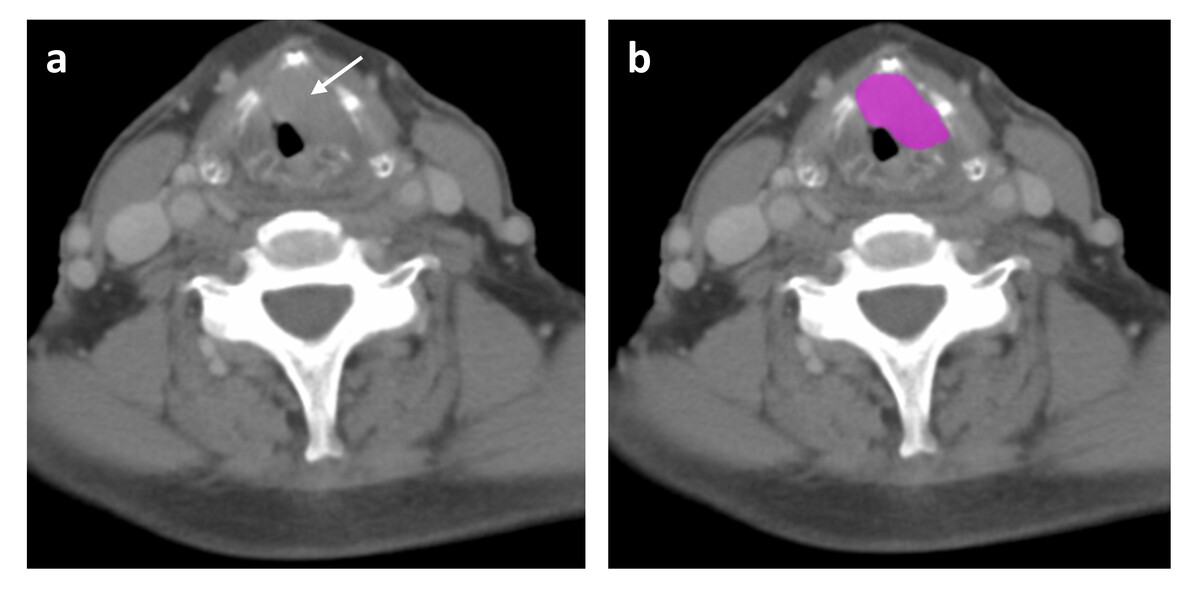
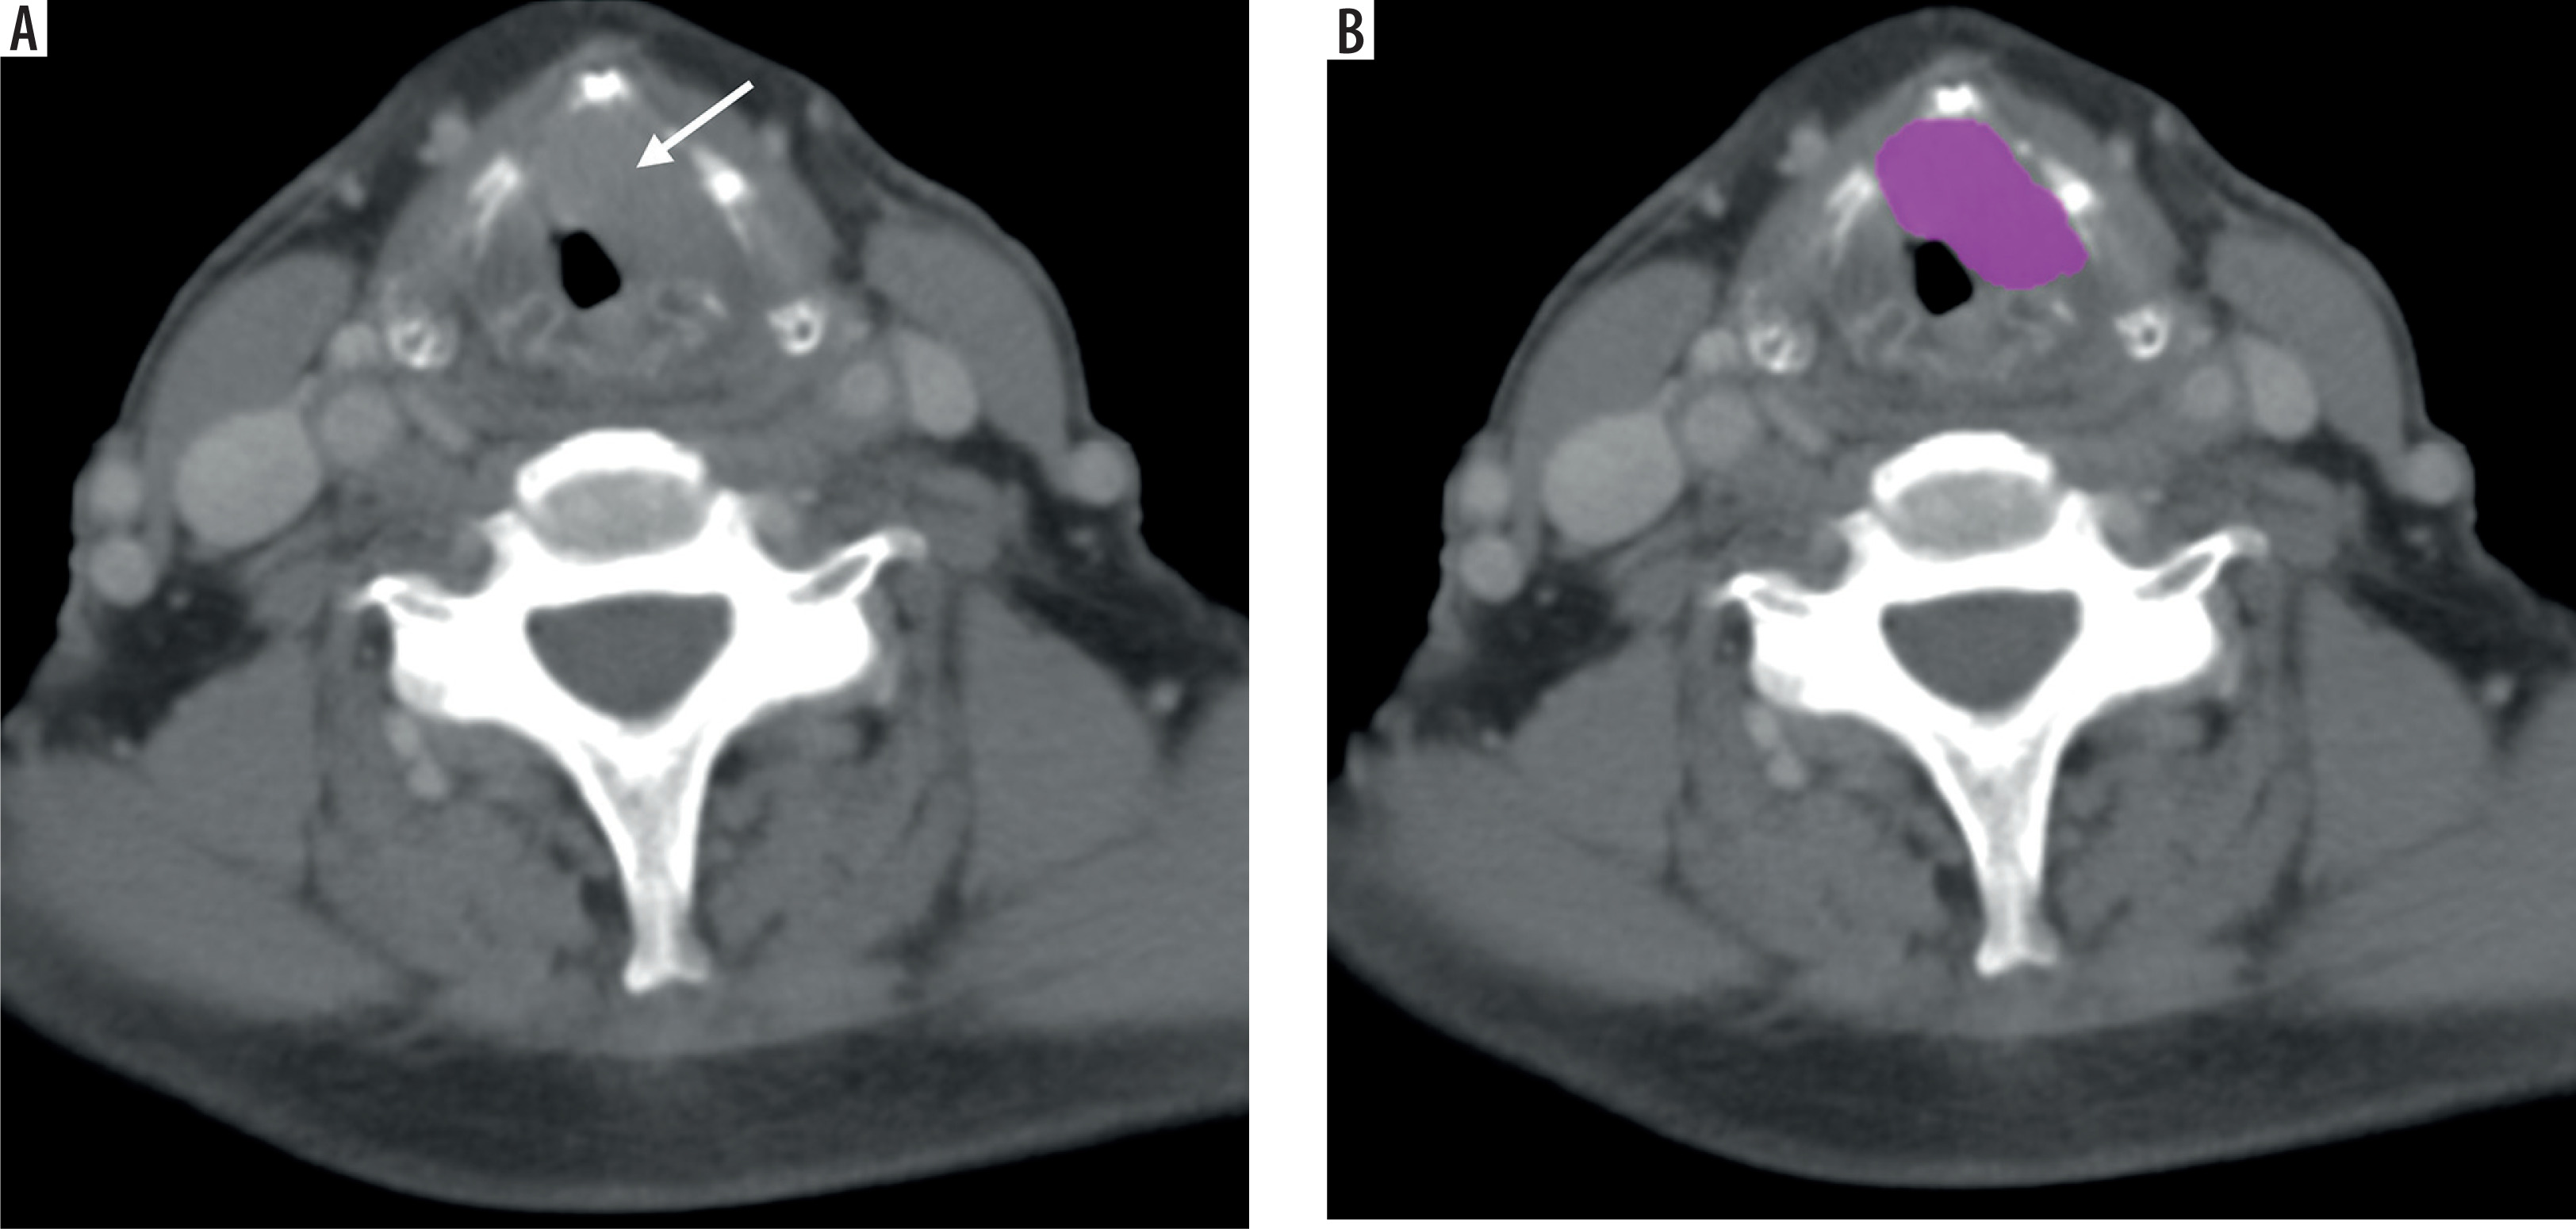
Figure 2
Tumor segmentation on axial computed tomography (CT). A) Axial contrast-enhanced CT image showing a mass invading the anterior commissure and the left vocal cord, extending into the paraglottic space (arrow). B) The region of interest (ROI) is delineated for texture analysis
The lesion extent was carefully determined by adjusting the window width and level and utilising multiplanar reconstruction to ensure accurate tumour measurement and consistency across different planes. For uniformity, the grey-level resolution was standardised to 128 levels (corresponding to a 7-bit depth). Intensity values were automatically rescaled based on the range defined by the mean ± 3 standard deviations (SD) of the ROI. Specifically, the lower and upper intensity limits were set to the mean minus 3 SD and the mean plus 3 SD, respectively, with any pixel values outside these bounds initially clipped to these thresholds. Moreover, to standardise voxel dimensions across the X, Y, and Z axes, the voxel sizes were adjusted to 0.5 mm in both the X and Y directions and 2.5 mm in the Z direction after computing the mean ± 3 SDs [17].
A total of 38 radiomic texture features were extracted. Specifically, 6 first-order histogram features (including parameters such as mean, standard deviation, skewness, and kurtosis, among others) were computed. In addition, second-order features were derived from multiple matrices: 7 features from the grey-level co-occurrence matrix (GLCM), 11 features from the gray-level run-length matrix (GLRLM), 3 features from the neighbourhood grey-level difference matrix (NGLDM), and 11 features from the grey-level zone-length matrix (GLZLM). Further details on texture analysis parameters can be found in Supplementary Table 1.
Statistical analyses were performed to evaluate the relationship between the extracted texture parameters and histopathological outcomes, including LNM, ENE, and TCI. Receiver operating characteristic (ROC) curve analysis was conducted to assess the diagnostic performance of significant texture features.
Histopathological analysis
All tumour specimens were fixed in 10% buffered formalin and embedded in paraffin according to standard procedures. Serial 5-µm thick sections were placed on positively charged slides and stained with haematoxylin and eosin (H&E) using a standardised protocol. Histopathological evaluation was performed by a pathologist with 18 years of experience, assessing LNM, ENE, LVI, perineural PNI, and TCI. Grading and staging were assigned according to the AJCC 8th edition criteria.
Statistical analysis
All statistical analyses were performed using SPSS version 26 (IBM Corp., Armonk, NY, USA). Continuous variables are presented as mean ± standard deviation, while categorical variables are expressed as frequencies and percentages. Normality was assessed using the Kolmogorov-Smirnov and Shapiro-Wilk tests. Group differences were evaluated with the Mann-Whitney U test. ROC curve analysis was conducted to determine the diagnostic performance of significant texture features. A p-value < 0.05 was considered statistically significant.
Results
The final study cohort comprised 32 patients, including 30 (93.75%) males and 2 (6.25%) females. The mean age was 62 ± 9.8 years. Demographic and clinicopathological characteristics of the study cohort are summarised in Table 1.
Table 1
Demographic and clinicopathological characteristics of the cohort
The distribution of all analysed texture parameters according to histopathological outcomes is presented in Supplementary Table 2.
Statistically significant texture feature distributions and their associated p-values are presented in Table 2. Among patients with LNM, 8 texture parameters reached statistical significance (p < 0.05). For ENE, 16 significant texture features were identified, and similarly, 16 texture parameters were significant for TCI. Notably, no significant texture parameters were found to differentiate LVI or PNI.
Table 2
Statistically significant texture feature values by histopathological outcomes in laryngeal cancer (p < 0.05)
| Histopathological outcome | Texture feature | Feature class | n | Present (mean ± SD) | n | Absent (mean ± SD) | p-value* |
|---|---|---|---|---|---|---|---|
| LNM | Contrast | GLCM | 14 | 376.14 ± 171.04 | 18 | 509.94 ± 143.12 | 0.045 |
| LNM | Correlation | GLCM | 14 | 0.57 ± 0.19 | 18 | 0.43 ± 0.15 | 0.041 |
| LNM | Dissimilarity | GLCM | 14 | 14.78 ± 3.79 | 18 | 17.58 ± 2.82 | 0.037 |
| LNM | SRE | GLRLM | 14 | 0.98 ± 0.01 | 18 | 0.99 ± 0.00 | 0.045 |
| LNM | HGRE | GLRLM | 14 | 4606.43 ± 12.16 | 18 | 4616.67 ± 4.85 | 0.008 |
| LNM | LRHGE | GLRLM | 14 | 4964.29 ± 139.32 | 18 | 4874.44 ± 62.33 | 0.049 |
| LNM | HGZE | GLZLM | 14 | 4617.14 ± 24.00 | 18 | 4645.00 ± 25.50 | 0.000 |
| LNM | LZHGE | GLZLM | 14 | 14718.57 ± 8837.49 | 18 | 10002.78 ± 1918.30 | 0.049 |
| ENE | Energy | GLCM | 7 | 0.00 ± 0.00 | 25 | 0.00 ± 0.00 | 0.026 |
| ENE | Contrast | GLCM | 7 | 279.71 ± 146.00 | 25 | 499.48 ± 141.05 | 0.003 |
| ENE | Correlation | GLCM | 7 | 0.68 ± 0.16 | 25 | 0.44 ± 0.15 | 0.002 |
| ENE | Entropy-log10 | GLCM | 7 | 3.46 ± 0.17 | 25 | 3.59 ± 0.18 | 0.043 |
| ENE | Entropy-log2 | GLCM | 7 | 11.49 ± 0.56 | 25 | 11.92 ± 0.60 | 0.034 |
| ENE | Dissimilarity | GLCM | 7 | 12.68 ± 3.53 | 25 | 17.38 ± 2.80 | 0.003 |
| ENE | SRE | GLRLM | 7 | 0.98 ± 0.01 | 25 | 0.99 ± 0.00 | 0.015 |
| ENE | LRE | GLRLM | 7 | 1.09 ± 0.03 | 25 | 1.06 ± 0.02 | 0.018 |
| ENE | HGRE | GLRLM | 7 | 4604.29 ± 11.34 | 25 | 4614.40 ± 8.70 | 0.026 |
| ENE | LRHGE | GLRLM | 7 | 5014.29 ± 144.90 | 25 | 4885.60 ± 83.02 | 0.010 |
| ENE | RP | GLRLM | 7 | 0.97 ± 0.01 | 25 | 0.98 ± 0.01 | 0.013 |
| ENE | SZE | GLZLM | 7 | 0.79 ± 0.06 | 25 | 0.85 ± 0.03 | 0.020 |
| ENE | LZE | GLZLM | 7 | 3.30 ± 1.34 | 25 | 2.31 ± 0.76 | 0.015 |
| ENE | HGZE | GLZLM | 7 | 4602.86 ± 24.30 | 25 | 4641.20 ± 23.33 | 0.001 |
| ENE | LZHGE | GLZLM | 7 | 15820.00 ± 7367.73 | 25 | 11014.80 ± 5777.21 | 0.011 |
| ENE | ZP | GLZLM | 7 | 0.70 ± 0.08 | 25 | 0.78 ± 0.05 | 0.010 |
| TCI | Energy | GLCM | 18 | 0.00 ± 0.00 | 14 | 0.00 ± 0.00 | 0.030 |
| TCI | Contrast | GLCM | 18 | 532.44 ± 125.21 | 14 | 347.21 ± 159.99 | 0.001 |
| TCI | Correlation | GLCM | 18 | 0.40 ± 0.12 | 14 | 0.60 ± 0.17 | 0.001 |
| TCI | Entropy-log10 | GLCM | 18 | 3.62 ± 0.12 | 14 | 3.47 ± 0.22 | 0.030 |
| TCI | Dissimilarity | GLCM | 18 | 18.05 ± 2.40 | 14 | 14.17 ± 3.59 | 0.001 |
| TCI | SRE | GLRLM | 18 | 0.98 ± 0.00 | 14 | 0.98 ± 0.01 | 0.011 |
| TCI | LRE | GLRLM | 18 | 1.05 ± 0.01 | 14 | 1.07 ± 0.02 | 0.034 |
| TCI | LRHGE | GLRLM | 18 | 4875.56 ± 73.98 | 14 | 4962.85 ± 132.68 | 0.018 |
| TCI | RP | GLRLM | 18 | 0.98 ± 0.00 | 14 | 0.97 ± 0.00 | 0.016 |
| TCI | Contrast | NGLDM | 18 | 0.72 ± 0.10 | 14 | 0.59 ± 0.20 | 0.009 |
| TCI | SZE | GLZLM | 18 | 0.85 ± 0.03 | 14 | 0.81 ± 0.05 | 0.011 |
| TCI | LZE | GLZLM | 18 | 2.20 ± 0.56 | 14 | 2.93 ± 1.25 | 0.020 |
| TCI | LGZE | GLZLM | 18 | 0.00 ± 0.00 | 14 | 0.00 ± 0.00 | 0.000 |
| TCI | SZLGE | GLZLM | 18 | 0.00 ± 0.00 | 14 | 0.00 ± 0.00 | 0.000 |
| TCI | LZHGE | GLZLM | 18 | 10112.22 ± 2625.37 | 14 | 14577.85 ± 8677.05 | 0.025 |
| TCI | ZP | GLZLM | 18 | 0.78 ± 0.04 | 14 | 0.73 ± 0.07 | 0.016 |
LNM – lymph node metastasis, ENE – extranodal extension, TCI – thyroid cartilage invasion, GLCM – grey-level co-occurrence matrix, GLRLM – gray-level run length matrix, GLZLM – gray-level zone length matrix, NGLDM – neighbourhood grey-level difference matrix, SRE – short run emphasis, LRE – long run emphasis, HGRE – high grey-level run emphasis, LRHGE – long run high grey-level emphasis, SZE – short zone emphasis, LZE – long zone emphasis, HGZE – high grey-level zone emphasis, LZHGE – long zone high grey-level emphasis, LGZE – low grey-level zone emphasis, SZLGE – short zone low grey-level emphasis, RP – run percentage, ZP – zone percentage
ROC curve analysis was performed on the texture features that significantly differentiated the histopathological outcomes, particularly for parameters with p-values ≤ 0.001. These features, which were significant in distinguishing LNM, ENE, and TCI, were further evaluated to determine the corresponding cut-off values, area under the curve (AUC), sensitivity, and specificity. These results are summarised in Table 3.
Table 3
Cut-off values and diagnostic accuracy of texture features for predicting histopathological outcomes in laryngeal cancer
[i] LNM – lymph node metastasis, ENE – extranodal extension, TCI – thyroid cartilage invasion, GLZLM – grey level zone length matrix, GLCM – grey level co-occurrence matrix, HGZE – high grey level zone emphasis, LGZE – low grey level zone emphasis, SZLGE – small zone low grey level emphasis, p – probability value
For LNM, the texture feature GLZLM_High Gray-Level Zone Emphasis (HGZE) was significant; a cut-off value of ≤ 4635 yielded an AUC of 0.847 (95% CI, 0.708-0.986), with a sensitivity of 71% and a specificity of 84% (p = 0.001).
For ENE, GLZLM_HGZE was also significant, with a cut-off value of ≤ 4625 resulting in a sensitivity of 85% and a specificity of 84% (p = 0.002).
For TCI, among the significant texture features, both GLZLM_Low Gray-Level Zone Emphasis (LGZE) and GLZLM_Short Zone Low Gray-Level Emphasis (SZLGE) demonstrated robust performance. Specifically, GLZLM_LGZE showed a cut-off value of ≥ 0.0015 with a sensitivity of 88% and a specificity of 79% (p < 0.001), while GLZLM_SZLGE exhibited a cut-off value of ≥ 0.00118, yielding an AUC of 0.964 (95% CI, 0.909-1.000), a sensitivity of 88%, and a specificity of 93% (p < 0.001).
Discussion
This study investigated the potential of CT-based radiomic analysis for predicting adverse histopathological outcomes in laryngeal cancer, focusing on LNM, ENE, and TCI. Significant differences in texture features – including GLZLM _HGZE for LNM and ENE, and GLZLM_LGZE and GLZLM _SZLGE for TCI – highlight the diagnostic value of radiomics as a non-invasive tool. Our findings demonstrated robust AUC values and favourable sensitivity/specificity, supporting the role of radiomics as a potential biomarker.
Preoperative identification of LNM and ENE is essential in HNSCC, as both are poor prognostic factors that often require treatment escalation, including the addition of chemotherapy to adjuvant radiotherapy. Early detection can enhance risk stratification and treatment planning, potentially reducing the need for extensive surgery or overtreatment [18,19]. In our study, GLZLM_HGZE was significantly associated with both ENE (AUC: 0.891; sensitivity: 85%, specificity: 84%) and LNM (AUC: 0.847; sensitivity: 71%, specificity: 84%), underscoring its value as a non-invasive imaging biomarker for assessing nodal and perinodal tumour spread. As a texture metric emphasising high-intensity homogeneous regions, GLZLM_HGZE probably reflects areas of dense tumour cellularity or desmoplastic stromal response – histopathological characteristics frequently linked to aggressive metastatic behaviour in head and neck cancers [8,20]. These biological correlates may explain the observed predictive capacity of this feature in evaluating metastatic potential.
Although studies on texture-based ENE and LNM prediction are limited in LSCC, radiomic models have shown high diagnostic accuracy in the broader HNSCC group [21–23]. For instance, machine learning-assisted texture analysis using dual-energy CT (DECT) successfully differentiated metastatic lymph nodes from benign conditions with 80-95% accuracy [24]. Another study extracted 99 radiomic features from 630 lymph nodes and applied random forest and deep neural networks, achieving an AUC of 0.91 for ENE and LNM detection [25]. These results support the role of radiomic analysis in improving nodal staging, emphasising the need for further multi-centre validation to enhance its clinical applicability.
A multi-institutional study by Kann et al. [26] validated a deep learning model for ENE detection in patients with HNSCC, achieving AUCs of 0.84-0.90, outperforming expert radiologists. Their findings highlight the clinical potential of AI-driven radiomics, underscoring the need for large-scale, multi-centre studies to further establish radiomic and AI-based models in ENE prediction and treatment planning.
In our study, no significant texture features were identified for predicting LVI and PNI, suggesting limited radiomic detectability. One possible reason is the exclusion of peritumoral texture features, which have shown promise in LVI prediction. Xu et al. [27] developed a CT-based radiomics model for LVI prediction in hypopharyngeal squamous cell carcinoma (HSCC), incorporating intratumoral and peritumoral features from 166 patients. Their model achieved high predictive performance (AUC 0.94-0.96), with peritumoral features (1 mm beyond tumour margins) showing the strongest association with LVI. These findings highlight the importance of peritumoral texture analysis, which was not included in our study and may explain the lack of significant predictive features.
Similarly, Mukherjee et al. [28] investigated CT-based radiomics for LVI and PNI prediction in HNSCC, reporting moderate performance (AUCs: 0.69/0.64 for LVI/PNI in the training cohort; 0.65/0.70 in the test cohort). This suggests that radiomic analysis reflects tumour heterogeneity, although with limited predictive accuracy.
Further supporting radiomics in PNI prediction, Li et al. [29] developed a CT-based delta radiomics nomogram for PNI assessment in HSCC, combining tumour thickness and radiomic features. Their model outperformed clinical models (AUCs: 0.79/0.78 in training/test cohorts), demonstrating radiomics’ potential for non-invasive PNI detection, although further validation is needed.
Accurate preoperative identification of cartilage invasion in LSCC is crucial for staging and treatment planning, particularly in distinguishing total laryngectomy cases from organ-preserving candidates. Studies comparing CT, MRI, and DECT have shown significant differences in diagnostic performance. A meta-analysis reported that MRI had higher sensitivity (90% vs. 66%) but lower specificity (81% vs. 88%) than CT, suggesting more false positives due to inflammatory changes [30]. Similarly, DECT demonstrated superior specificity (100% vs. 64%) for thyroid cartilage invasion, with comparable sensitivity (89% vs. 100%) [31]. Given these variations, integrating radiomics and AI-based analysis may further improve diagnostic accuracy and clinical decision-making.
Guo et al. [14] demonstrated that CT-based radiomics models (LR and LR-SVMSMOTE) significantly outperformed radiologists in TCI prediction (AUCs: 0.876 and 0.905 vs. 0.721), highlighting the value of machine learning-driven feature selection. In line with these findings, our study identified GLCM_Contrast, GLCM_Dissimilarity, GLZLM_LGZE, GLZLM_SZLGE, and GLCM_ Correlation as significant predictors of TCI, with robust AUC values and well-defined cut-off thresholds. These second-order GLCM-derived features quantify local intensity variation and grey-level spatial relationships, with higher values generally reflecting disrupted tissue architecture, increased intratumoural heterogeneity, and transition zones between malignant and reactive components – hallmarks of invasive tumour growth into adjacent structures such as cartilage.
GLZLM_LGZE and GLZLM_SZLGE, both strongly associated with thyroid cartilage invasion, emphasise low-intensity zones of varying sizes. While LGZE captures broader hypodense areas potentially indicative of stromal degradation or acellular necrosis (AUC: 0.903), SZLGE highlights smaller homogeneous regions that may reflect focal necrosis, disorganised stroma, or poorly differentiated tumour nests (AUC: 0.964). Together, these features characterise distinct aspects of aggressive tumour biology and may serve as reliable imaging biomarkers for local invasive behaviour [7,32].
While mechanistic validation remains limited, these findings reinforce the potential of CT-based texture analysis as a non-invasive tool for assessing tumour aggressiveness and microstructural complexity in head and neck squamous cell carcinoma, particularly in predicting TCI [9,33]. Further validation using multimodal imaging and AI-driven approaches is warranted to enhance clinical applicability.
This study has several limitations. First, the relatively small sample size limited the ability to develop a machine learning-based predictive model. Instead, we focused on evaluating the diagnostic performance of selected radiomic parameters through ROC analysis, assessing their clinical applicability in predicting LNM, ENE, and TCI. Second, the study was conducted retrospectively at a single institution, which may limit the generalisability of the findings. A larger, multi-centre dataset would improve model robustness and external validation. Third, interobserver agreement for manual ROI segmentation was not quantitatively assessed (e.g., using ICC or Dice coefficient), which may introduce variability in feature extraction; however, segmentation was performed by experienced radiologists following standardised criteria. Fourth, peritumoral texture features were not included, which have shown predictive value in previous studies. Future research incorporating both intratumoral and peritumoral radiomic features may enhance diagnostic accuracy. Lastly, we used CT-derived radiomics, while MRI-based radiomics may provide complementary insights due to its superior soft-tissue contrast. Further studies comparing CT- and MRI-based radiomic models could refine imaging-based prediction strategies for laryngeal cancer management. Future research should focus on developing machine learning-based models with larger, balanced datasets to improve predictive accuracy. Despite these limitations, our study demonstrated that the identified radiomic parameters, with well-defined cut-off values, hold clinical relevance as non-invasive biomarkers for LNM, ENE, and TCI assessment.
Conclusions
CT-based texture analysis demonstrates potential as a non-invasive tool for predicting key histopathological features in LSCC, particularly LNM, ENE, and TCI. Significant radiomic parameters showed high diagnostic accuracy, supporting their role in preoperative risk stratification. Further validation in larger, multi-centre studies is necessary to enhance clinical applicability and integration into routine oncologic imaging.