Introduction
Glioma is one of the most prevalent and lethal brain cancers, accounting for approximately 30% of all primary central nervous system (CNS) malignancies [1]. Due to its aggressive nature and poor prognosis, accurate prediction of overall survival (OS) is crucial for guiding early treatment strategies, including surgery, radiotherapy, chemotherapy, and supportive care planning [2].
OS, defined as the time from diagnosis to death or last follow-up, is influenced by various clinical and pathological factors, including tumour grade, location, molecular profile, and treatment response [3,4]. Gliomas are classified by the World Health Organisation (WHO) into low-grade (grades I-II) and high-grade (grades III-IV) tumours, with 5-year survival rates ranging from approximately 80% for low-grade gliomas to less than 5% for high-grade cases [4,5].
Numerous prognostic indicators, such as tumour grade, anatomical location, and intratumoural heterogeneity, can be extracted from imaging data, positioning medical imaging as a critical tool in predicting OS in glioma patients [6]. In particular, advances in magnetic resonance imaging (MRI) have markedly improved the visualisation, segmentation, and quantitative analysis of brain tumours. These developments enable the generation of high-dimensional imaging features that are instrumental in constructing robust prognostic models. Nevertheless, OS prediction frequently depends on manual interpretation by clinicians, which introduces considerable interobserver variability and may compromise predictive accuracy [7,8].
To address the limitations of manual image interpretation, recent research has increasingly turned to machine learning (ML) techniques for extracting quantitative imaging biomarkers and identifying complex patterns associated with glioma progression and OS [9,10]. ML-based image analysis, encompassing radiomics and deep learning, has shown significant potential in improving prediction performance [11]. Key approaches to medical image analysis include geometry-based feature extraction, intensity-based analysis, and machine learning algorithms [12,13]. Among these, ML-based image analysis has garnered substantial attention in recent years, leveraging advanced algorithms to uncover hidden patterns and complex relationships within medical imaging data [12,14].
Despite increasing interest in this field, there is a lack of systematic reviews that comprehensively evaluate the impact of various imaging modalities, tumour segmentation approaches, feature extraction methods, and ML architectures on predictive performance across studies [8].
This scoping review seeks to address this gap by critically evaluating existing image-based glioma OS prediction models. It examines how performance metrics vary across WHO tumour grades, imaging modalities, segmentation strategies, and modelling approaches, providing a structured synthesis of the current landscape and identifying directions for future research.
Material and methods
This scoping review was conducted in accordance with the Joanna Briggs Institute (JBI) guidelines for scoping reviews [15], following five key steps: (1) identifying the research question; (2) searching for relevant literature; (3) selecting studies; (4) charting the data; and (5) collating, summarising, and reporting the results.
Research questions
Which countries have implemented medical image analysis for glioma overall survival prediction?
To what extent does sample size influence the predictive performance of image-based models for glioma overall survival prediction?
How do predictive performance metrics of image-based glioma overall survival models vary across different WHO tumour grades?
How do predictive performance metrics of image-based glioma overall survival models vary across different imaging modalities?
How do the predictive performance metrics of image-based glioma overall survival models vary across different tumour segmentation approaches?
How do predictive performance metrics of image-based glioma overall survival models vary across different feature extraction methods?
How do the predictive performance metrics of image-based glioma overall survival models differ among various machine learning architectures?
Toward relevant studies
The study began with an extensive search across the PubMed, Scopus, and Web of Science databases. The search strategy, tailored for each database, used keywords related to glioma, image analysis, and overall survival, as detailed in Supplement 1.
In addition to the systematic database search, the reference lists of relevant articles were manually reviewed, and the ‘Related Articles’ and ‘Similar Research’ features on Google Scholar and ResearchGate were used to identify additional studies. All retrieved records were imported into EndNote, where duplicate entries were removed as an initial step. The search period included all available publications up to 12 December 2024, with no restriction on the start date.
Study selection process
In the next phase, 2 reviewers independently screened the remaining articles by assessing their titles and abstracts. Disagreements were resolved by consulting a third reviewer to reach a final decision. Studies not focused on developing or applying image-based glioma OS prediction models were excluded at this stage. The full texts of the remaining articles were thoroughly evaluated, and studies were excluded if they did not meet the predefined inclusion criteria, which required the following: original research articles published in English with full-text availability, involvement of human subjects, and a specific focus on image-based methods for predicting OS in glioma patients, such as developing or validating predictive models using radiological imaging data. Only studies involving human subjects were included; those based on animal models were excluded during screening.
Charting, summarising, and reporting
Data extraction was performed by 4 researchers using a form designed in Microsoft Word. The form included fields for the first author and co-authors, year of publication, country of the first author’s institution, study type, sample size, imaging modality, image quality, WHO tumour classification, treatment stage, image segmentation method, image data extraction method, feature selection or reduction method, machine learning architectures, features used, performance evaluation metrics, and corresponding results. The first author developed the form, and its content and the data extraction process were explained to the researchers during a meeting to ensure consistency in data collection. Any uncertainties or disagreements were resolved with input from the first and corresponding authors.
Results
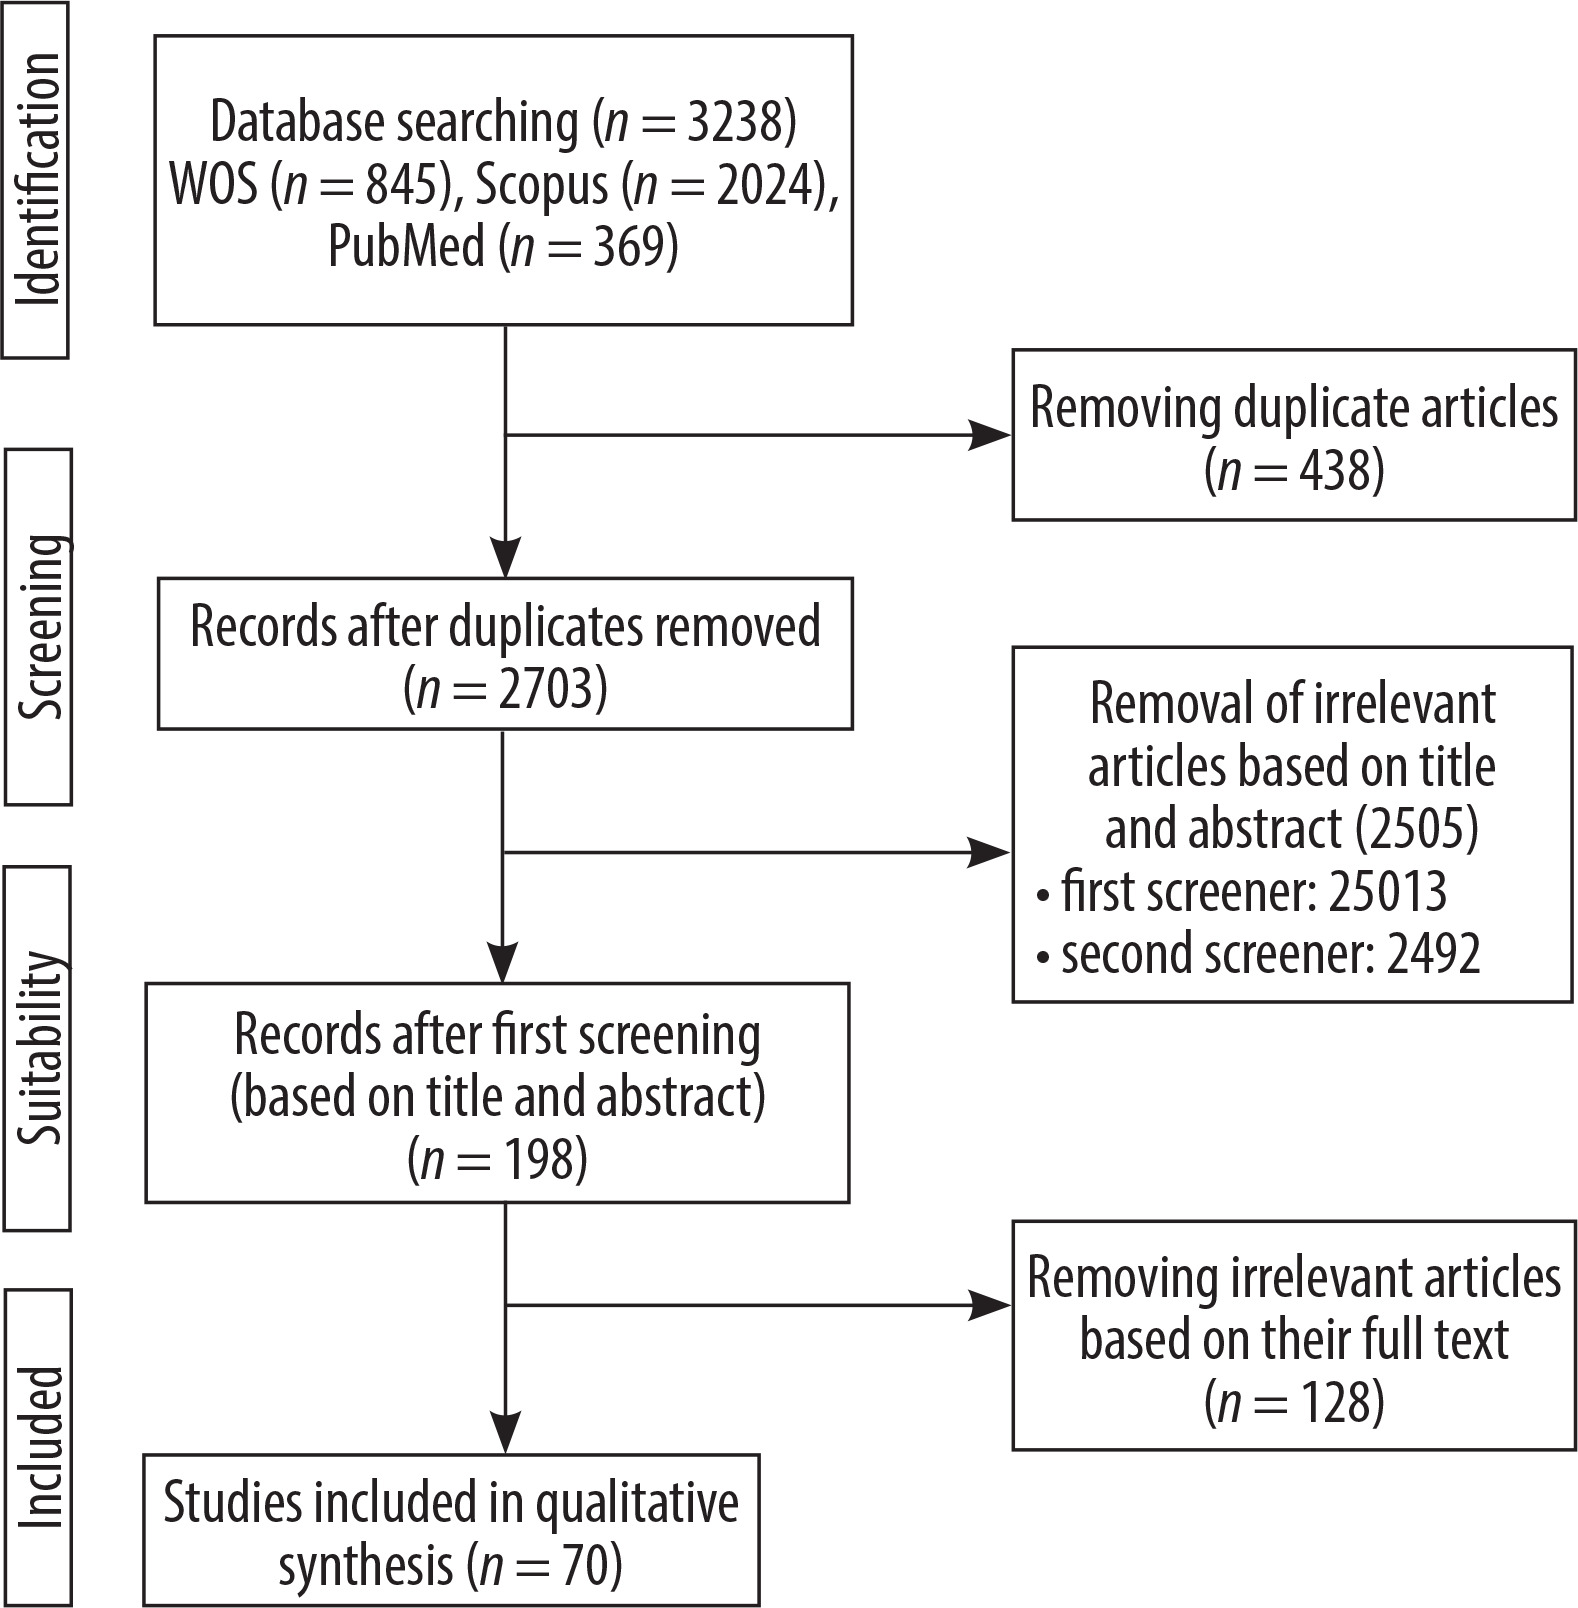
An initial literature search retrieved 3238 records from 3 databases: PubMed (369), Scopus (2,024), and Web of Science (845). After removing 438 duplicates using End-Note software, 2703 unique records remained for screening. During the title and abstract screening phase, 2505 records were excluded for not meeting the inclusion criteria. Subsequently, 198 full-text articles were evaluated for eligibility, of which 128 were excluded. Ultimately, 70 studies met all inclusion criteria and were included in the final analysis (Figure 1). These studies, published between 2016 and 2024, are summarised in Supplement 2. The entire selection process followed the PRISMA guidelines to ensure methodological rigor and transparency.
Figure 1
PRISMA flow diagram of study selection process for image-based glioma overall survival prediction review
Countries implementing medical imaging analysis for glioma OS prediction: China, the United States, India, South Korea, and Singapore accounted for the highest number of studies, with 24, 17, 9, 4, and 4 studies published, respectively.
Impact of sample size on the predictive performance of glioma OS models: The included studies used varying sample sizes for OS prediction. The mean sample size was 450 ± 205 (mean ± standard deviation). Among these studies, 30 reported accuracy, while 18 provided C-index values for predicting OS in glioma patients. Figure 2 displays the reported accuracy and C-index values along with their respective sample sizes across the studies.
Figure 2
Relationship between sample size and predictive performance (accuracy and C-index) of image-based glioma survival models

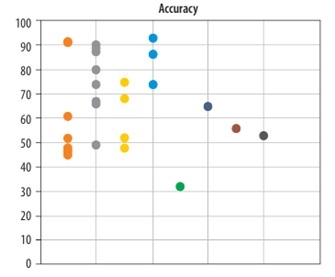
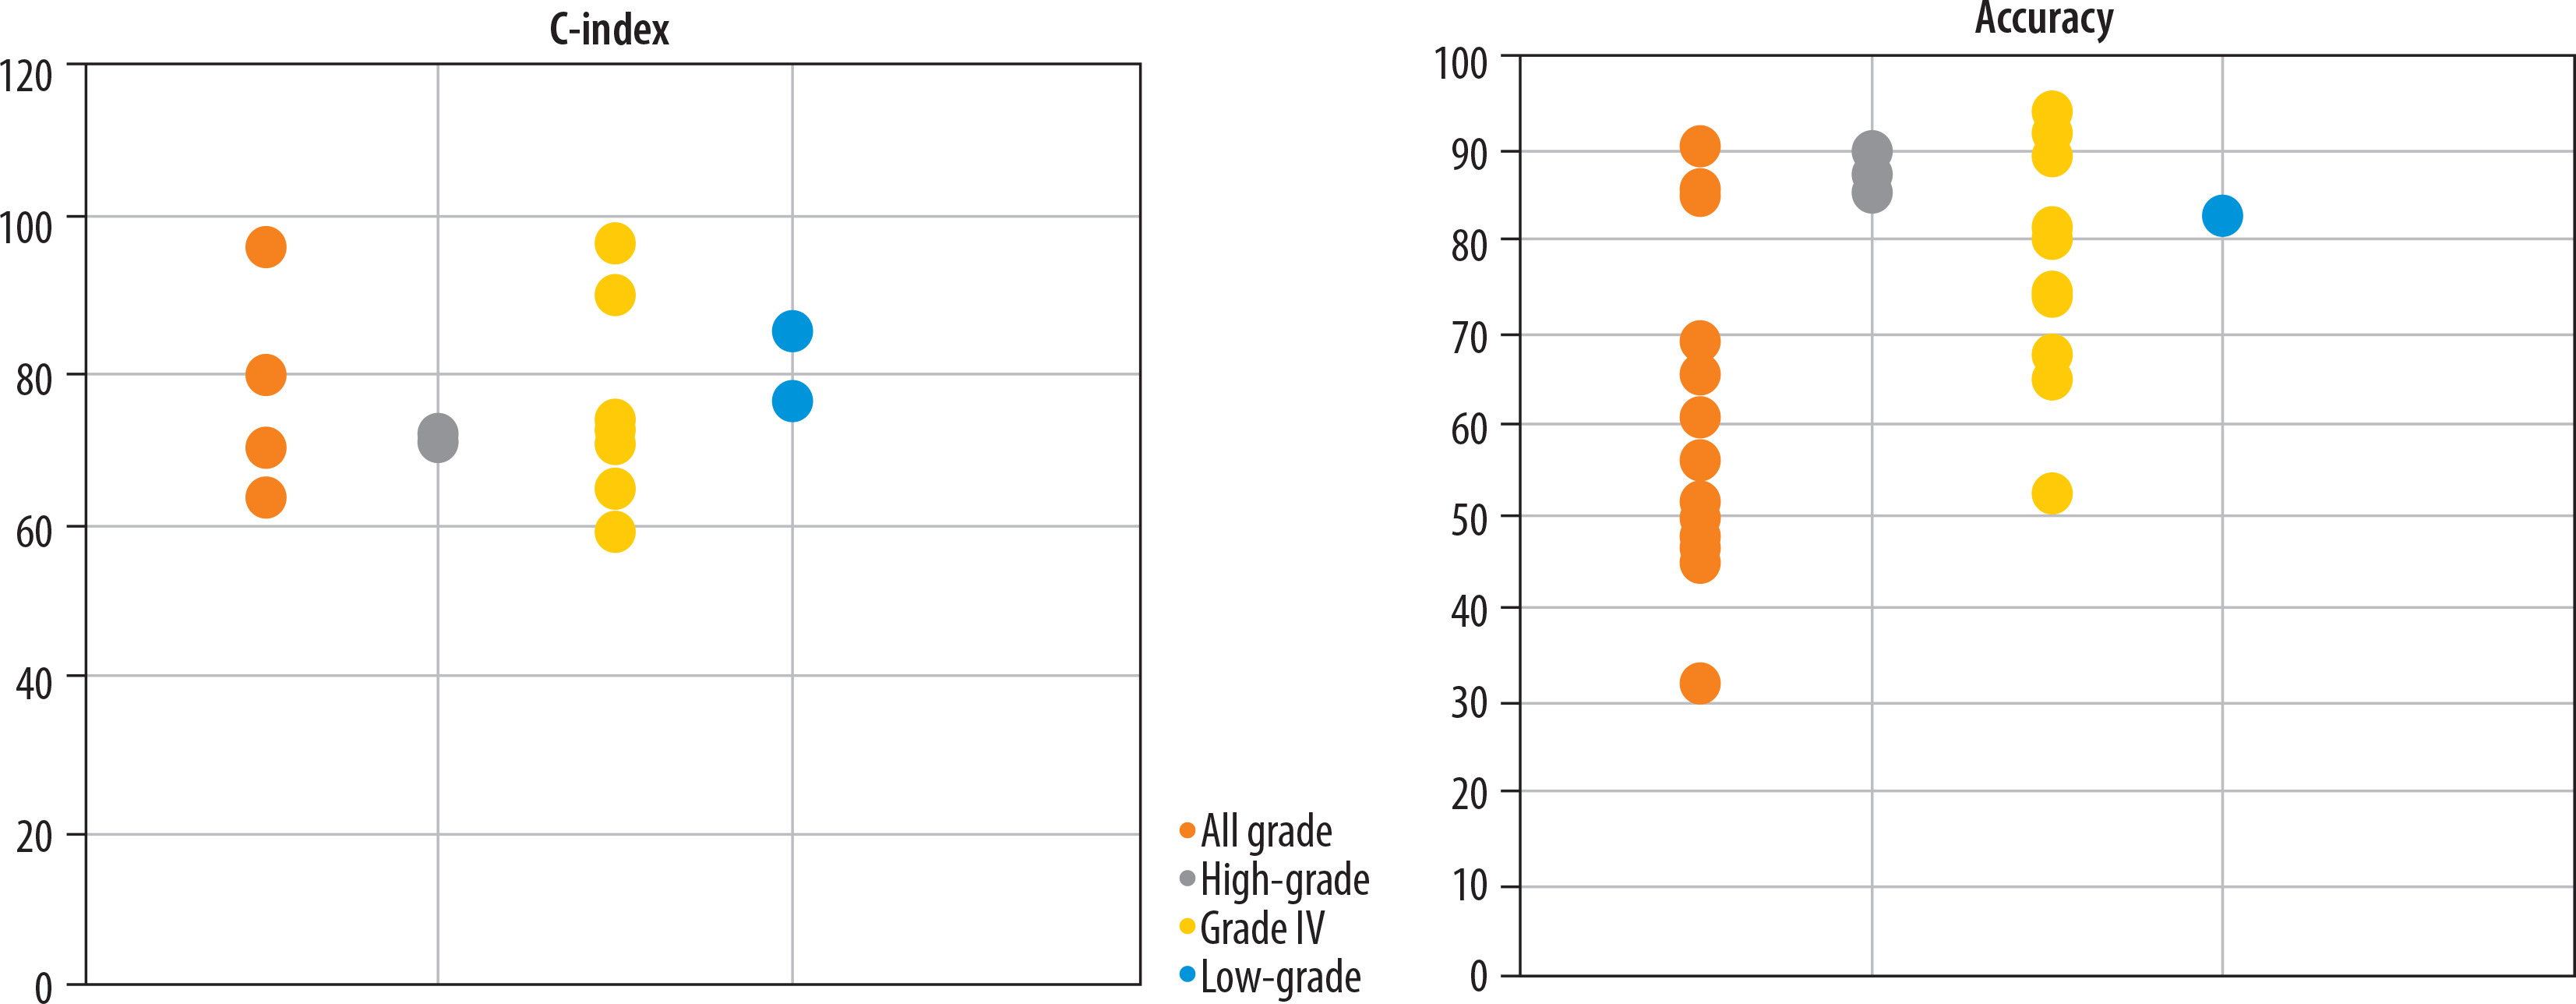
Variation in predictive performance of glioma OS models across WHO tumour grades: A total of 8, 4, 30, and 28 studies focused on predicting OS in high-grade gliomas, low-grade gliomas, grade IV glioblastomas (GBM), and across all glioma grades, respectively (Figure 3).
Figure 3
Predictive performance (accuracy and C-index) of glioma survival models across different WHO tumour grades
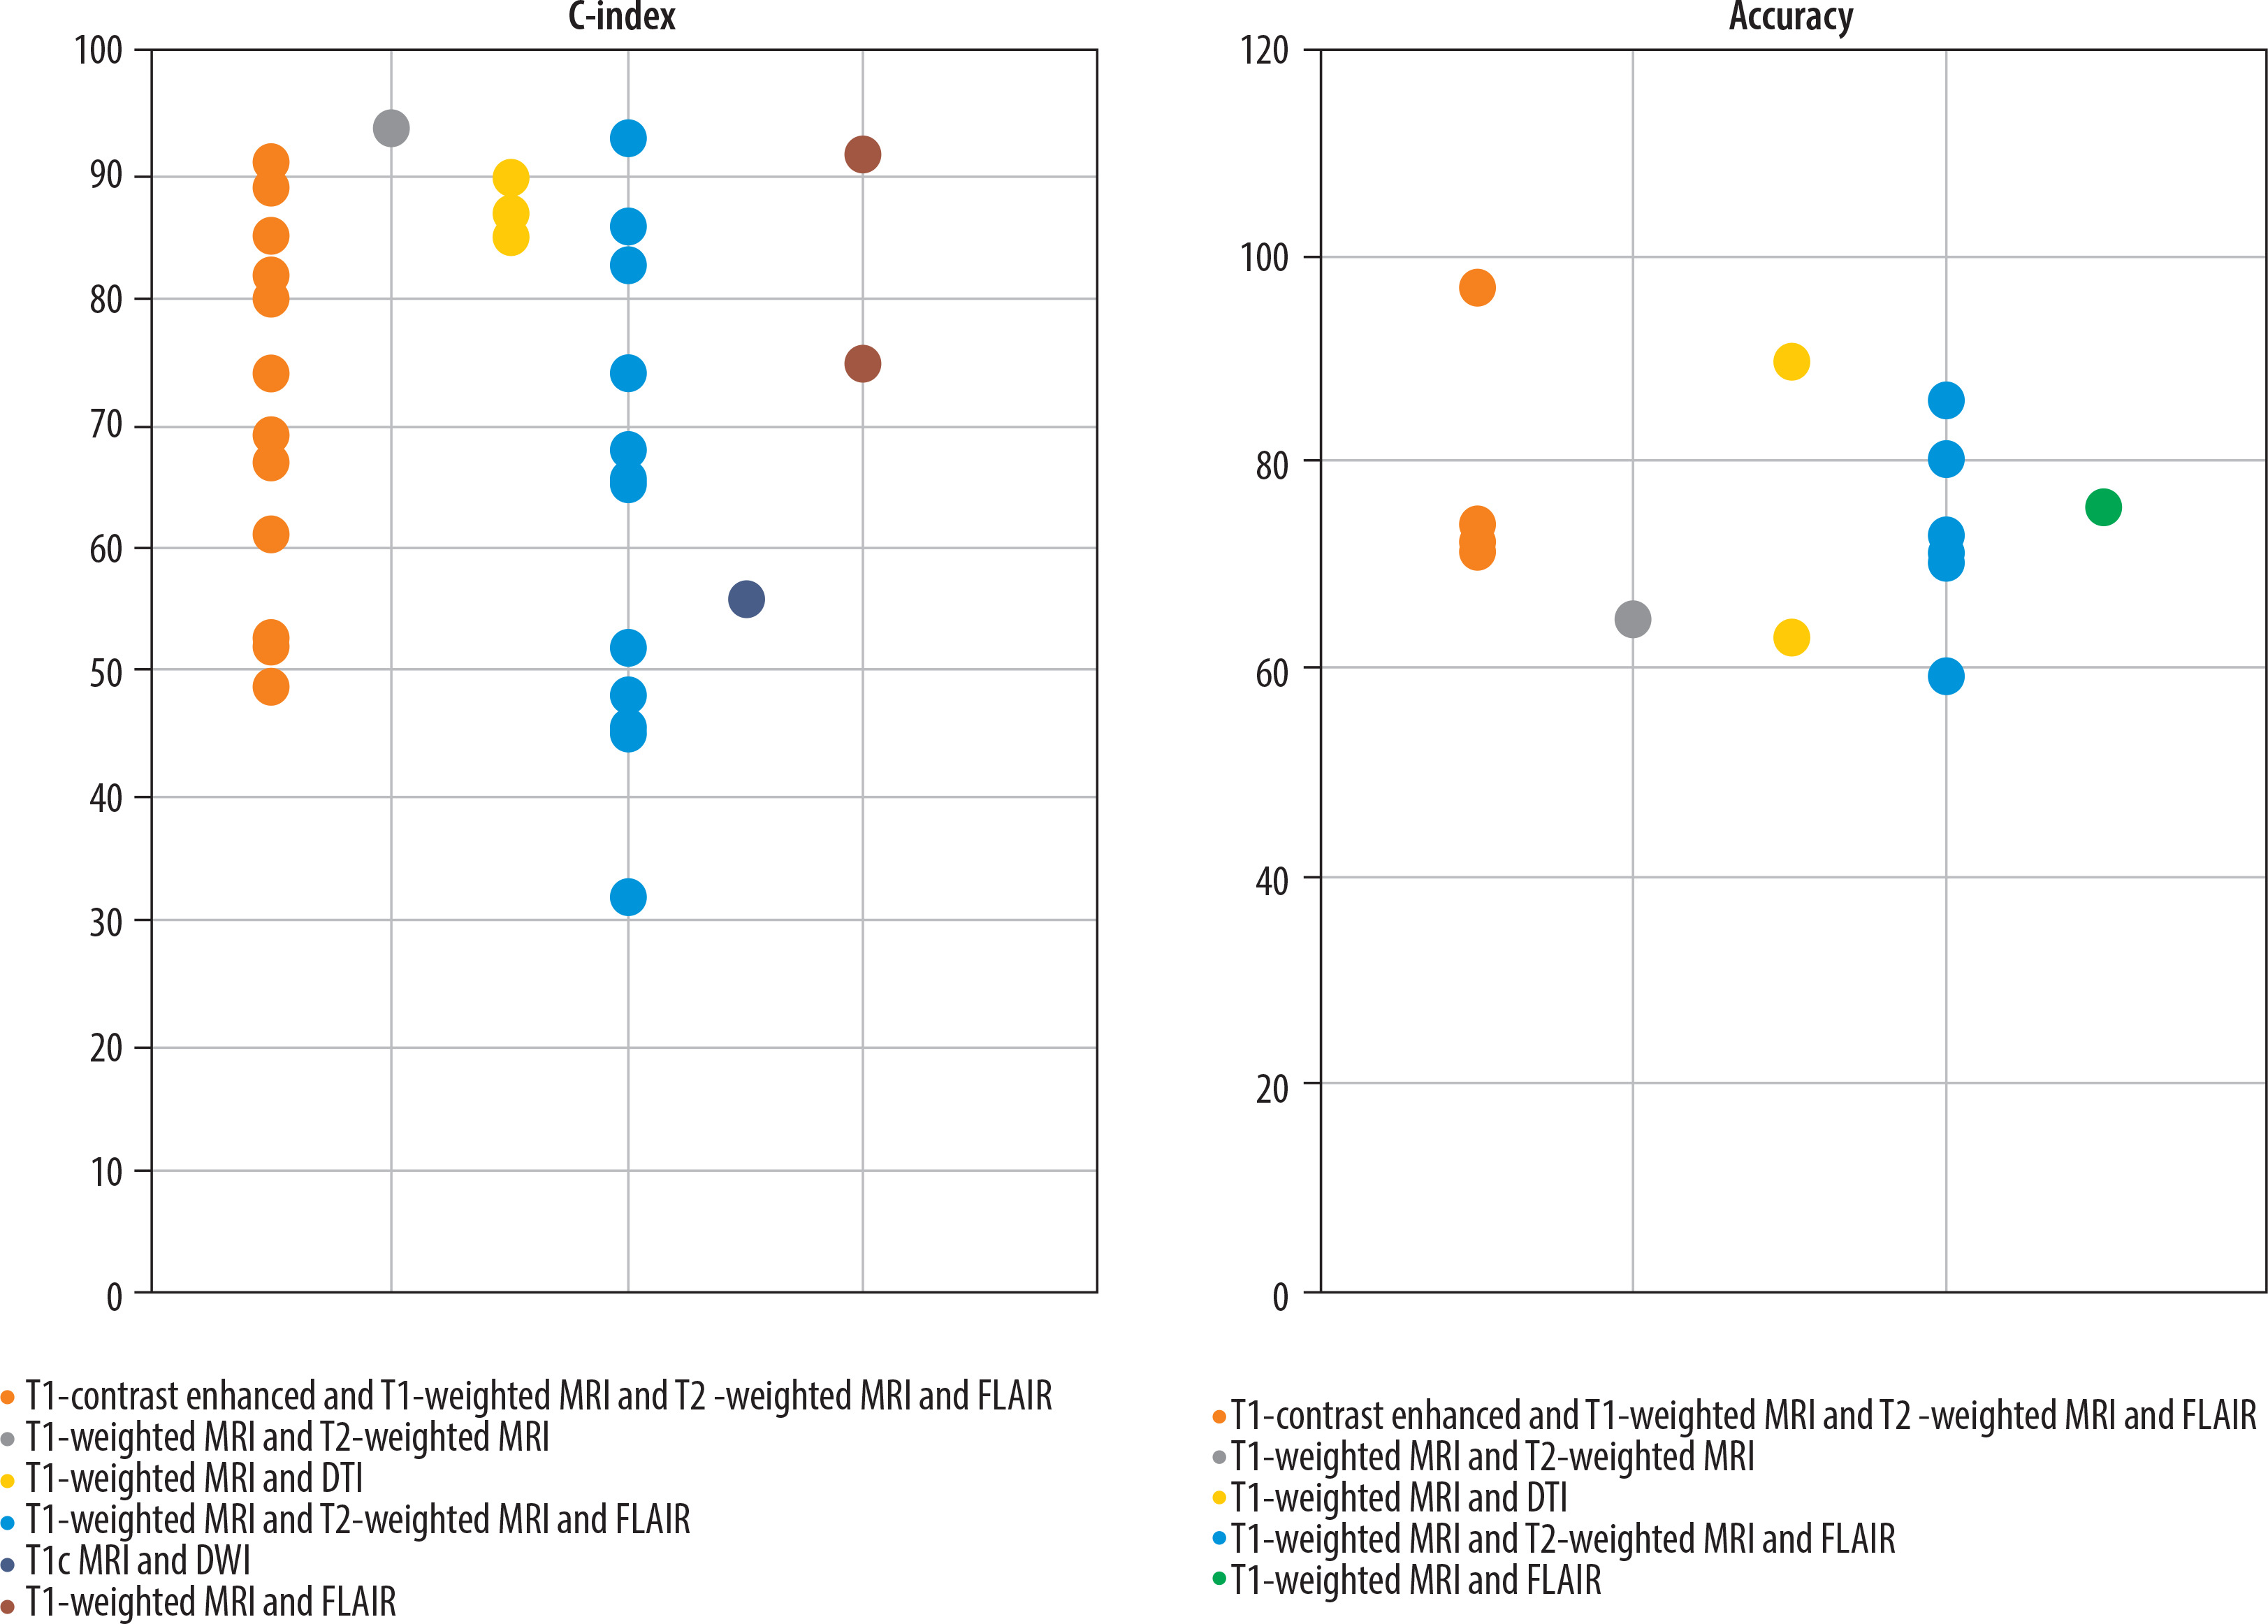
Variation in predictive performance of glioma OS models across different imaging modalities: The included studies employed various combinations of MRI sequences for survival prediction, such as T1-contrast enhanced (T1-CE), T1-weighted (T1w), T2-weighted (T2w), FLAIR, T1c, diffusion-weighted imaging (DWI), and diffusion tensor imaging (DTI) (Figure 4).
Figure 4
Predictive performance (accuracy and C-index) across various MRI modalities used in glioma survival prediction (T1-CE, T1w, T2w, FLAIR, T1c, DWI, DTI)
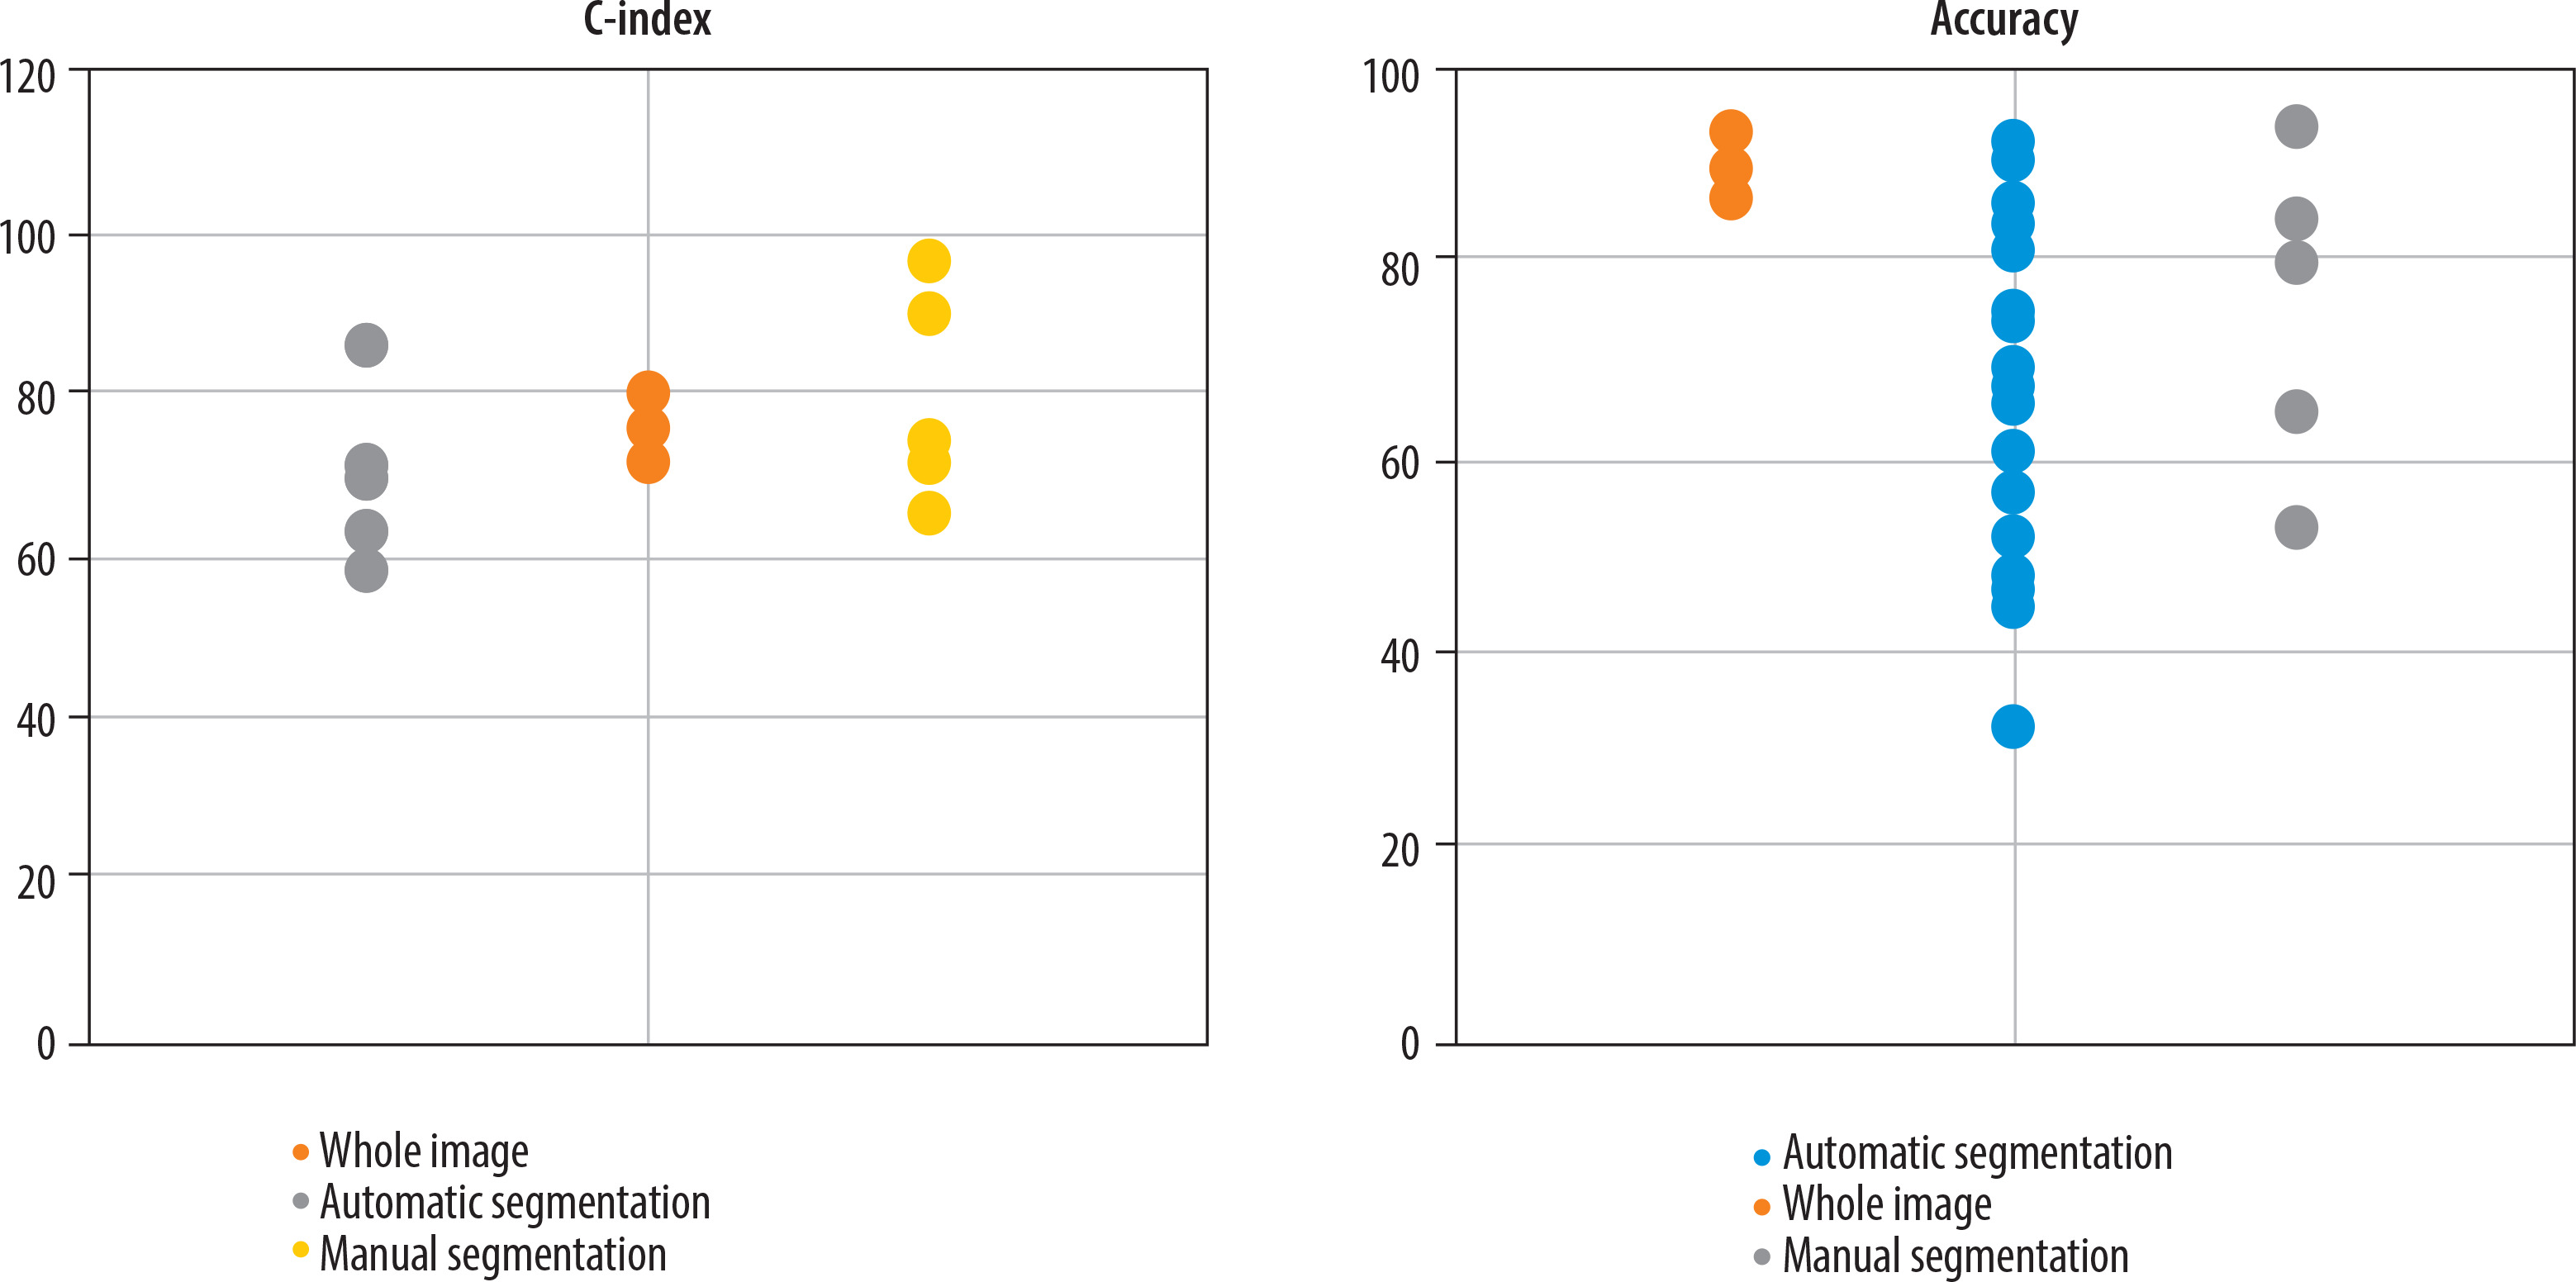
Variation in predictive performance of glioma OS models across different segmentation methods: The reviewed studies employed 3 main segmentation approaches: whole-image analysis (10 studies), manual segmentation (20 studies), and automated segmentation (40 studies). Figure 5 presents the reported accuracy and C-index values stratified by segmentation approach, based on studies that provided these performance metrics.
Figure 5
Predictive performance (accuracy and C-index) stratified by tumour segmentation approaches (whole-image, manual, automated)
Variation in predictive performance of glioma OS models across different feature extraction methods: Three distinct feature extraction approaches were utilised across the studies: radiomics analysis (48 studies), deep learning (12 studies), and hybrid methods that combine both radiomics and deep learning (10 studies). Figure 6 displays the reported accuracy and C-index values stratified by feature extraction method, based on studies that reported these performance metrics.
Figure 6
Predictive performance (accuracy and C-index) based on different feature extraction methods (radiomics, deep learning, hybrid radiomics – deep learning)

Variation in Predictive Performance of Glioma OS Models Across Different Machine Learning Architectures: Three primary modelling methodologies were applied across the studies to predict survival outcomes in glioma patients: statistical models (18 studies), ML approaches (43 studies), and deep learning techniques (9 studies). Figure 7 illustrates the comparative performance metrics, accuracy, and C-index, stratified by modelling methodology, based on studies that reported both evaluation measures.

Discussion
The first application of medical image analysis for predicting OS in glioma patients was reported in 2016. In that study [16], machine learning techniques were applied to MRI data to predict OS in patients with glioblastoma multiforme (GBM; WHO grade IV glioma). Since this pioneering work, the field has experienced substantial growth, with significant increases in both the number of studies and the diversity of employed methodologies.
Countries implementing medical imaging analysis for glioma OS prediction
China’s recent healthcare policies, which emphasise reducing clinical costs, alongside the demonstrated efficiency of medical image analysis in conserving both time and resources, provide strong justification for implementing image-based models in predicting glioma OS. At present, such prognostic evaluations primarily rely on genetic testing, a method that is both costly and time-consuming [17]. According to projections by Grand View Research, China, the United States, and India are expected to become the leading markets for medical imaging and image analysis by 2031 [18]. This anticipated growth is likely to accelerate the clinical integration of these technologies in applications such as glioma survival prediction. Moreover, the large population sizes of these countries [19] may act as a key driver for increased demand for cost-effective and scalable imaging-based solutions. Nevertheless, comprehensive epidemiological studies are still needed to assess glioma prevalence and examine patterns of imaging technology utilisation to better understand this association.
The impact of sample size on the predictive performance of glioma OS models
Sample size is a critical factor in evaluating the accuracy of predictive algorithms, especially for complex models such as radiomics and deep learning applied to survival prediction in glioma patients. Insufficient sample sizes can lead to overfitting in deep learning models, causing them to memorise specific features from the training data without generalising well to new datasets. This overfitting significantly impairs the model’s predictive accuracy and real-world applicability. Conversely, the availability of larger sample sizes facilitates the detection of hidden patterns by algorithms, which in turn enhances their predictive accuracy. With increased data availability, deep learning models can uncover more intricate relationships among diverse features, leading to more accurate predictions [20]. However, as illustrated in Figure 2, although sample size influences the performance of machine learning algorithms, studies with larger sample sizes have not consistently reported higher accuracy or C-index values. This indicates that simply increasing the number of samples does not necessarily lead to improved model performance. Such inconsistencies may be attributed to other influential factors, including input image quality, feature extraction methods, data noise levels, and tumour grade [21]. Therefore, in addition to expanding dataset size, greater emphasis should be placed on improving image quality, selecting optimal features, and applying advanced data analysing techniques. Future research should investigate these aspects more thoroughly to further enhance predictive model performance.
Variation in predictive performance of glioma OS models across WHO tumour grades
The WHO classifies gliomas into 4 grades based on histopathological characteristics: Grades I and II are considered low-grade, while Grades III and IV are classified as high-grade tumours [5]. Several studies have examined survival prediction models based on imaging data for glioma patients of different WHO grades. As illustrated in Figure 3, studies that trained a single model on combined data from all glioma grades (i.e. grades I-IV) generally reported lower predictive accuracy. This decline in performance is probably due to the substantial variation in survival outcomes between low-grade and high-grade gliomas, which introduces greater heterogeneity and makes it more difficult for models to identify consistent predictive patterns [22]. Low-grade gliomas typically demonstrate slower growth and progression, whereas high-grade gliomas exhibit aggressive behaviour and are associated with significantly worse prognoses. As a result, combining these 2 biologically and clinically distinct groups within a single predictive model may impair the model’s ability to identify consistent and relevant patterns in the data. In such scenarios, the model may become overly influenced by the dominant characteristics of one group, often the high-grade tumours, while underrepresenting critical features of the low-grade group. This imbalance can ultimately reduce the model’s generalisability and predictive accuracy across diverse patient populations [23].
Furthermore, the imaging characteristics and tissue architecture of gliomas vary significantly across different tumour grades. For instance, MRI scans of low-grade gliomas often appear less aggressive, displaying minimal variation in signal intensity and exhibiting limited evidence of necrosis or oedema. In contrast, high-grade gliomas typically present with substantial structural abnormalities and pronounced heterogeneity. These distinct phenotypic manifestations pose a challenge for deep learning models, making it difficult to identify consistent, grade-invariant imaging biomarkers. As a result, the accuracy of such models may be compromised when applied across heterogeneous glioma grades. [23,24]. To enhance the accuracy of glioma survival prediction models, researchers may choose to analyse glioma grades separately due to their distinct histopathological and imaging features, or apply advanced techniques like data weighting and transfer learning. These strategies address variability between grades and class imbalance, improving model performance and generalisability. Future research should prioritise multicentre validation of these methods to develop standardised and clinically reliable glioma prediction models.
Variation in predictive performance of glioma OS models across different imaging modalities
Notably, all reviewed studies utilised MRI for image analysis, probably due to its superior capability in visualising fine soft tissue details, particularly within the brain parenchyma. By contrast, CT and PET scans are more commonly used for imaging bony structures and detecting trauma-related injuries [25]. Specifically, MRI provides higher-resolution delineation of cerebral soft-tissue architecture, which is crucial for survival analysis. This modality excels at detecting microscopic cellular and histopathological changes, making it an invaluable tool for monitoring disease progression. Because microscopic and histopathological alterations are pivotal in survival prediction studies, MRI’s high spatial resolution allows for precise identification and tracking of these changes, thus providing robust data for more accurate prognostic modelling. Conversely, CT and PET have limited capability in resolving such fine details [25,26].
Magnetic resonance imaging is often considered a safer alternative to CT and PET scans because the latter involve exposure to ionising radiation and radioactive tracers, which may pose long-term health risks. In contrast, MRI does not carry these risks and is therefore regarded as a more suitable and lower-risk option for repeated evaluations [27]. Moreover, MRI is more widely available in hospitals and medical centres, making it accessible for both clinical and research purposes. Compared to PET scans, which require specialised equipment and incur higher costs, MRI offers a more practical and cost-effective solution. Given that many studies demand rapid acquisition of high-quality data, MRI is frequently prioritised due to its greater accessibility [27,28].
As illustrated in Figure 4, various MRI modalities, including T1-weighted imaging, T2-weighted imaging, DTI, FLAIR, and T1-contrast enhanced (T1c), are commonly employed for the diagnosis and evaluation of brain tumours and related lesions [29]. T1-weighted Imaging is typically used to assess anatomy and tumours because fats and dense tissues appear bright in these scans. This modality is effective for delineating precise brain structures but may lack sensitivity for detecting small lesions. Conversely, T2-weighted imaging produces a stronger signal from cerebrospinal fluid, making it well-suited for identifying lesions associated with fluid accumulation, such as inflammation or tumours. However, T2-weighted imaging may not be sufficiently sensitive to detect minor brain injuries [30].
Diffusion tensor imaging, which maps the diffusion of water molecules, is particularly valuable for assessing neural pathways and brain injuries. This advanced technique reconstructs white matter tracts, enabling clinicians to detect disruptions in cerebral connectivity. The FLAIR sequence is another sophisticated imaging approach that suppresses cerebrospinal fluid (CSF) signals, thereby enhancing the visibility of periventricular and cortical lesions adjacent to CSF spaces. This modality is especially effective in detecting small brain lesions that might otherwise be obscured [29,31] tissues such as tumours and inflammatory lesions. This technique provides high-contrast visualisation of highly vascularised tissues, although it requires contrast administration. T1c imaging is particularly effective for tumour detection and characterisation of inflammatory lesions [30]. Studies incorporating T1c MRI alongside T1-weighted, T2-weighted, and FLAIR modalities for survival prediction have reported higher accuracy and C-index values. Since angiogenesis – the growth of new blood vessels – in tumour tissue is a key factor influencing OS in glioma patients, T1c MRI offers valuable insights in this context [32]. This high-contrast modality effectively visualises tissues with substantial blood flow, suggesting its potential to enhance the predictive power of models estimating OS in glioma patients [30].
Variation in predictive performance of glioma OS models across different segmentation methods
For glioma survival prediction, some studies analyse the whole image to capture all features, while others use image segmentation to focus specifically on tumour regions and minimise irrelevant information. This targeted approach improves model accuracy by better identifying tumour characteristics and reducing interference from non-tumour data [33]. Image segmentation in cancer involves dividing medical images into distinct regions to identify and assess tumours or cancerous lesions [34]. This process can be performed manually or automatically. In manual segmentation, clinicians or specialists visually delineate tumour areas. Although this method can be highly accurate, it is time-consuming, requires substantial expertise, and is prone to human error. Automatic segmentation, on the other hand, employs computer algorithms, such as neural networks and deep learning techniques, to automatically detect and segment suspected cancerous regions. This approach is faster and more scalable for large datasets but depends heavily on well-configured algorithms and high-quality training data. Automated segmentation accelerates disease identification and monitoring, facilitates more precise treatment planning, and is especially valuable for early cancer detection while minimising human error [35].
Among the 18 studies reporting C-index values, those using manual image segmentation demonstrated higher C-index scores. However, contrary to expectations that manual segmentation would also lead to higher accuracy, Figure 5 shows no significant differences in accuracy among studies employing whole-image analysis, manual segmentation, or automated segmentation. The comparable accuracy between manual and automated methods may result from confounding variables affecting accuracy measurements or potential human errors inherent in manual segmentation.
An important prognostic factor in glioma survival prediction is the tumour’s anatomical location, with diencephalic tumours associated with significantly poorer OS compared to tumours in other brain regions [36]. Since anatomical location information may be partially lost when analysing segmented images instead of whole images, using full images could potentially compensate for this limitation, leading to predictive accuracy comparable to studies that employ image segmentation techniques.
Variation in predictive performance of glioma OS models across different feature extraction methods
Various methods, including radiomics and deep learning, are employed to predict OS in glioma patients. Radiomics involves extracting predefined features, such as geometric, textural, and structural characteristics, from medical images of brain tissue [37,38]. These features may capture information related to tumour volume, tissue heterogeneity, and the architecture of affected regions, all of which can correlate with glioma prognosis. Typically, such features are analysed using statistical models or machine learning algorithms to predict survival outcomes [37,39].
In contrast, deep learning methods employ convolutional neural networks (CNNs) to automatically extract complex image features that may be imperceptible to human observers. This approach allows for more precise modelling of disease progression and enables more personalised survival predictions. Deep learning is particularly effective at capturing complex relationships between diverse imaging features and survival outcomes in glioma because these models can analyse data across multiple sophisticated levels [37].
The radiomics feature extraction method requires image segmentation and manual feature selection, producing features that are interpretable by clinicians. In contrast, deep learning methods bypass the need for segmentation and manual selection, but the extracted features often remain unintelligible to physicians, functioning essentially as a “black box” [40]. Combining these 2 approaches may enhance model performance in survival prediction [41]. As shown in Figure 5, most studies predominantly use radiomics methods. The study by Afshar et al. highlighted that, unlike other therapeutic areas, radiomics has been more widely adopted for survival prediction, possibly due to domain-specific knowledge not easily accessible in deep learning approaches [40]. Figure 6 analysis reveals that studies employing deep learning methods are more sensitive to sample size concerning predictive accuracy. Although hybrid methods were expected to outperform single approaches, studies using combined methodologies did not consistently report superior accuracy or C-index values [37,42-45]. Further examination suggested that, while hybrid models often showed better results alongside individual methods, their relatively lower reported performance might be influenced by other confounding factors.
Variation in predictive performance of glioma OS models across different machine learning architectures
Three main categories of models are used for survival prediction: statistical models, machine learning, and deep learning [8]. Traditional statistical approaches, such as Cox proportional hazards models and Kaplan-Meier estimators, remain especially valuable for small or homogeneous datasets due to their simplicity and interpretability. These models offer straightforward interpretations of survival probabilities and hazard ratios without the need for complex computations. However, they have limitations in handling nonlinear relationships and high-dimensional data, and integrating diverse data types like medical images or molecular features [46].
Machine learning models, including algorithms such as Support Vector Machines (SVMs), Random Forests, and Gradient Boosting, have gained attention for their flexibility in analysing heterogeneous data. These approaches can effectively integrate multimodal data (e.g. clinical, radiomics, and molecular features) and capture complex nonlinear patterns. However, their complexity can increase susceptibility to overfitting, reduce interpretability compared to traditional statistical models, and pose challenges in handling incomplete datasets or performing multimodal data fusion [8,46].
Deep learning models, including CNNs and Transformers, have demonstrated remarkable effectiveness in analysing complex, high-dimensional data such as medical images. These models automatically learn intricate patterns without the need for manual feature engineering, and they support seamless integration of multimodal data for accurate prediction. Nevertheless, deep learning models typically require large training datasets, significant computational resources, and are prone to overfitting when trained on small datasets. Moreover, their “black box” nature limits interpretability of the results [8,47].
As illustrated in Figure 7, machine learning methods reported a wide range of accuracy and C-Index values across studies. When examining performance by algorithm, studies utilising SVM and CNN approaches achieved higher accuracy. This finding is supported by the comparative study by Wang et al., which identified SVM and CNN as the top-performing methods, attributing their superiority to greater resistance to overfitting [48]. Among the few studies reporting C-Index values for machine learning models, no substantial differences were observed across different algorithms.
This study had several limitations, primarily stemming from its reliance on the quality and availability of the published literature. Although comprehensive searches were conducted across reputable databases, it is possible that some relevant but lower-quality, non-English language, or unpublished studies were inadvertently excluded. Furthermore, methodological heterogeneity among the included studies, such as variations in imaging protocols, feature extraction techniques, and evaluation metrics, limited our ability to directly compare and synthesise results in a standardised manner.
Conclusions
The findings of this review highlight that while increasing the sample size can improve the performance of machine learning models for glioma survival prediction, it is not sufficient on its own to ensure high accuracy. Other key factors, such as data quality, signal-to-noise ratio, and optimal feature selection, play critical roles in determining model performance. From a statistical learning perspective, accuracy reflects a model’s ability to generalise; models with lower accuracy are less likely to perform well on independent datasets.
Notably, combining different glioma grades (e.g. low-grade and high-grade) into a single predictive model may reduce performance due to substantial biological and imaging heterogeneity between the groups. This increased intra-dataset variance complicates the learning process and undermines generalisability. Moreover, studies demonstrate that the use of diverse MRI modalities, particularly T1-contrast enhanced imaging, can enhance prediction accuracy by capturing tumour vascular characteristics relevant to survival.
Regarding imaging analysis techniques, both full-image and segmented-image approaches have demonstrated comparable effectiveness in certain contexts, suggesting that the inclusion of anatomical context in full-image analysis may offset the benefits of tumour-focused segmentation.
In terms of feature extraction, radiomics remains the most widely used method, offering interpretable results and compatibility with traditional machine learning models. While deep learning shows strong potential in capturing complex, non-linear patterns, its performance is highly sensitive to sample size and training data quality. Although hybrid approaches that combine radiomics and deep learning hold theoretical advantages, current evidence suggests they require further refinement to consistently outperform individual methods.
Ultimately, improving the accuracy and clinical utility of glioma survival prediction models will require an integrative approach. This includes optimising model architectures, enhancing input data quality, and incorporating multimodal data such as clinical, genetic, and imaging features. Future research should also prioritise multicentre validation and standardisation to support broader clinical adoption and improve patient outcomes.