

Introduction
Antiresorptive agents are commonly used to treat multiple myeloma, bone metastases from solid tumors, and osteoporosis. These drugs inhibit osteoclast activity and reduce bone resorption throughout the skeleton, including that in the jawbone [1-3].
The condition was initially termed bisphosphonate-related osteonecrosis of the jaw when it was first reported as a serious adverse event in 2003 [1,4]. However, subsequent cases were linked to the use of antiangiogenic agents and tyrosine kinase inhibitors, leading to adoption of the broader term medication-related osteonecrosis of the jaw (MRONJ), which was defined by the American Association of Oral and Maxillofacial Surgeons in its 2022 position paper [1]. MRONJ is characterized by the presence of exposed bone or bone that can be probed through a fistula in the maxillofacial region, which persists for more than 8 weeks in patients who have been treated with a bone-modifying or antiangiogenic agent, and who have no history of radiation therapy or metastatic disease involving the jaw.
Computed tomography (CT), panoramic radiography, and magnetic resonance imaging (MRI) are effective imaging modalities for diagnosing MRONJ [5]. Among these, CT is particularly valuable for the three-dimensional assessment of changes in bone, such as osteosclerosis, cortical bone destruction, and sequestrum formation, as well as the associated complications [6]. Although abnormalities with well-defined structural features can be readily identified by visual inspection, evaluation of the more complex patterns commonly encountered in medical imaging remains challenging and requires advanced diagnostic expertise. In this context, texture analysis is an emerging quantitative imaging analysis technique that can facilitate the detection of subtle structural alterations by extracting numerous statistically derived features from medical images [7].
MRONJ can significantly affect areas beyond the primary lesion, including the development of pathological fractures and spread of inflammation to the surrounding tissues [8-10]. Therefore, a comprehensive and detailed evaluation is clinically important. The mandibular condyles of patients with MRONJ have been examined using cone-beam CT or MRI in several previous studies [11,12]. However, to the best of our knowledge, no study has evaluated the mandibular condyles in patients with MRONJ using texture analysis of CT images.
In order to gain further insight into the involvement of the mandibular condyle in cases of MRONJ, we here evaluated the mandibular condyles of patients with MRONJ quantitatively using texture analysis of CT images. The null hypothesis was that MRONJ would not affect the mandibular condyle.
Material and methods
Study design and patients
This retrospective study was approved by our institutional review board, and the requirement for informed consent was waived (No. EC25-23-002-1). This study included patients who underwent CT for suspected MRONJ between April 2020 and March 2023 at the outpatient clinic of our university hospital. Among these, patients with MRONJ affecting only one side of the mandible (7 men and 24 women; age range: 65-95 years; mean age: 80 years; 62 temporomandibular joints) were selected for analysis. For these patients, the control side was confirmed to show no sclerotic changes on CT and no abnormal signal intensity on MRI.
We excluded patients in whom the effects of MRONJ extended across the midline to the control side; patients with a history of radiotherapy; patients with conditions that could affect the mandibular condyle or bone marrow, such as cystic lesions, tumors, malignancies, hematologic disorders, anemia, diabetes mellitus, rheumatoid arthritis, or malnutrition; and patients suspected of having temporomandibular joint osteoarthrosis.
Image acquisition
CT was performed using a 64-slice multidetector CT system (Aquilion 64; Toshiba Medical Systems, Tokyo, Japan) according to the standard clinical protocol for craniofacial imaging at our institution. The imaging parameters used were as follows: tube voltage of 120 kV, tube current of 100 mA, field-of-view of 240 mm × 240 mm, and helical pitch of 41. Imaging was performed using axial images of 0.50-mm thickness. The CT images were viewed on a medical-grade liquid crystal display monitor (RadiForce G31, Eizo Nanao, Ishikawa, Japan).
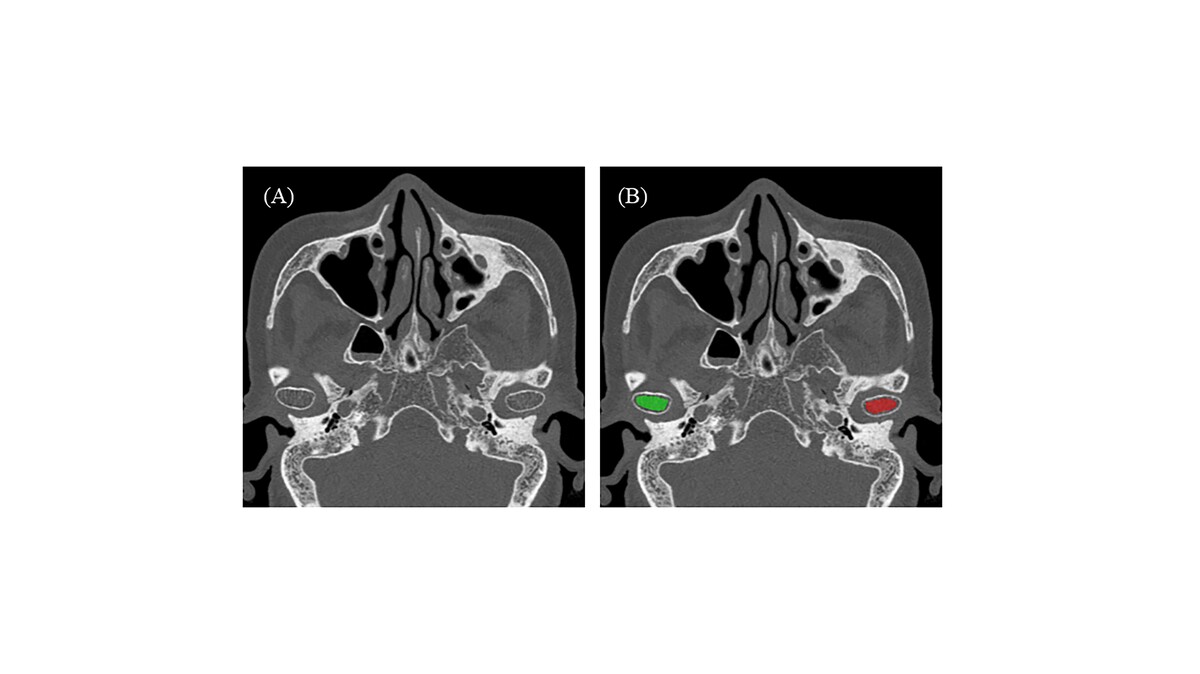
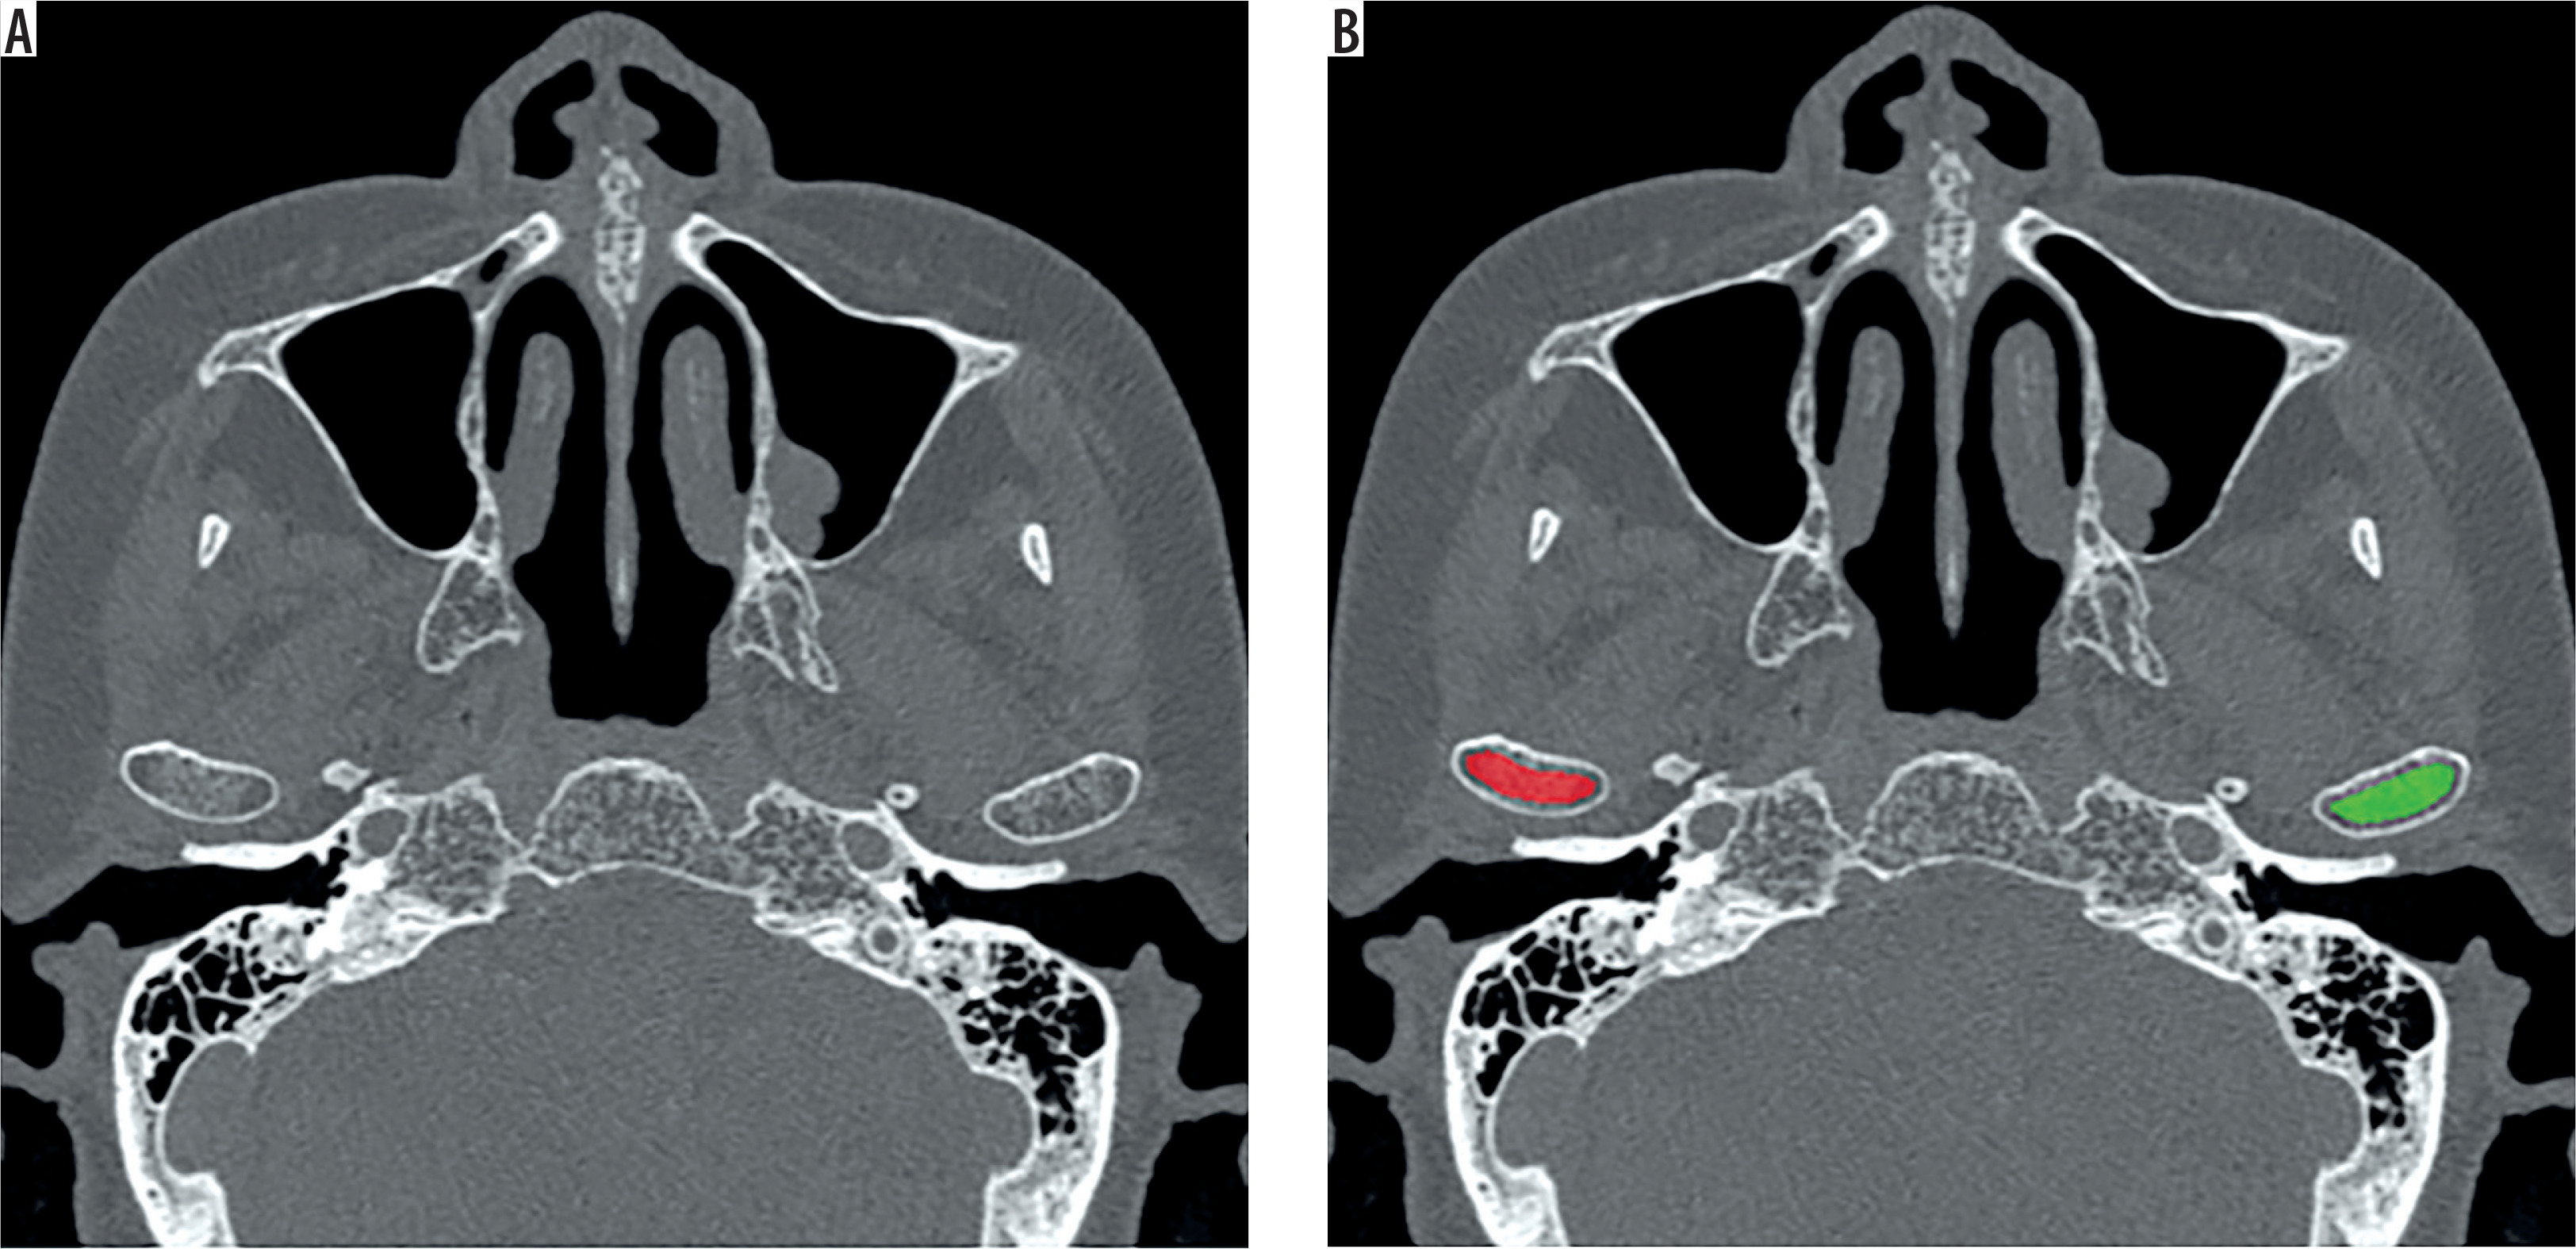
Using axial slices showing the maximal cross-sectional areas of both mandibular condyles, an oral radiology specialist with 12 years of experience manually traced regions of interest (ROIs) in the condyles on both sides to delineate the bone marrow. Structures that could potentially affect the image, such as the cortical bone, were excluded from the ROIs (Figure 1).
Figure 1
In patients with medication-related osteonecrosis of the jaw (MRONJ), a region of interest (ROI) was manually drawn on computed tomography (CT) images to encompass the maximum measurable area on both sides. Axial CT image of the patient with MRONJ before (A) and after (B) ROI delineation. The ROI on the affected side is shown in red, while the ROI on the control side is shown in green
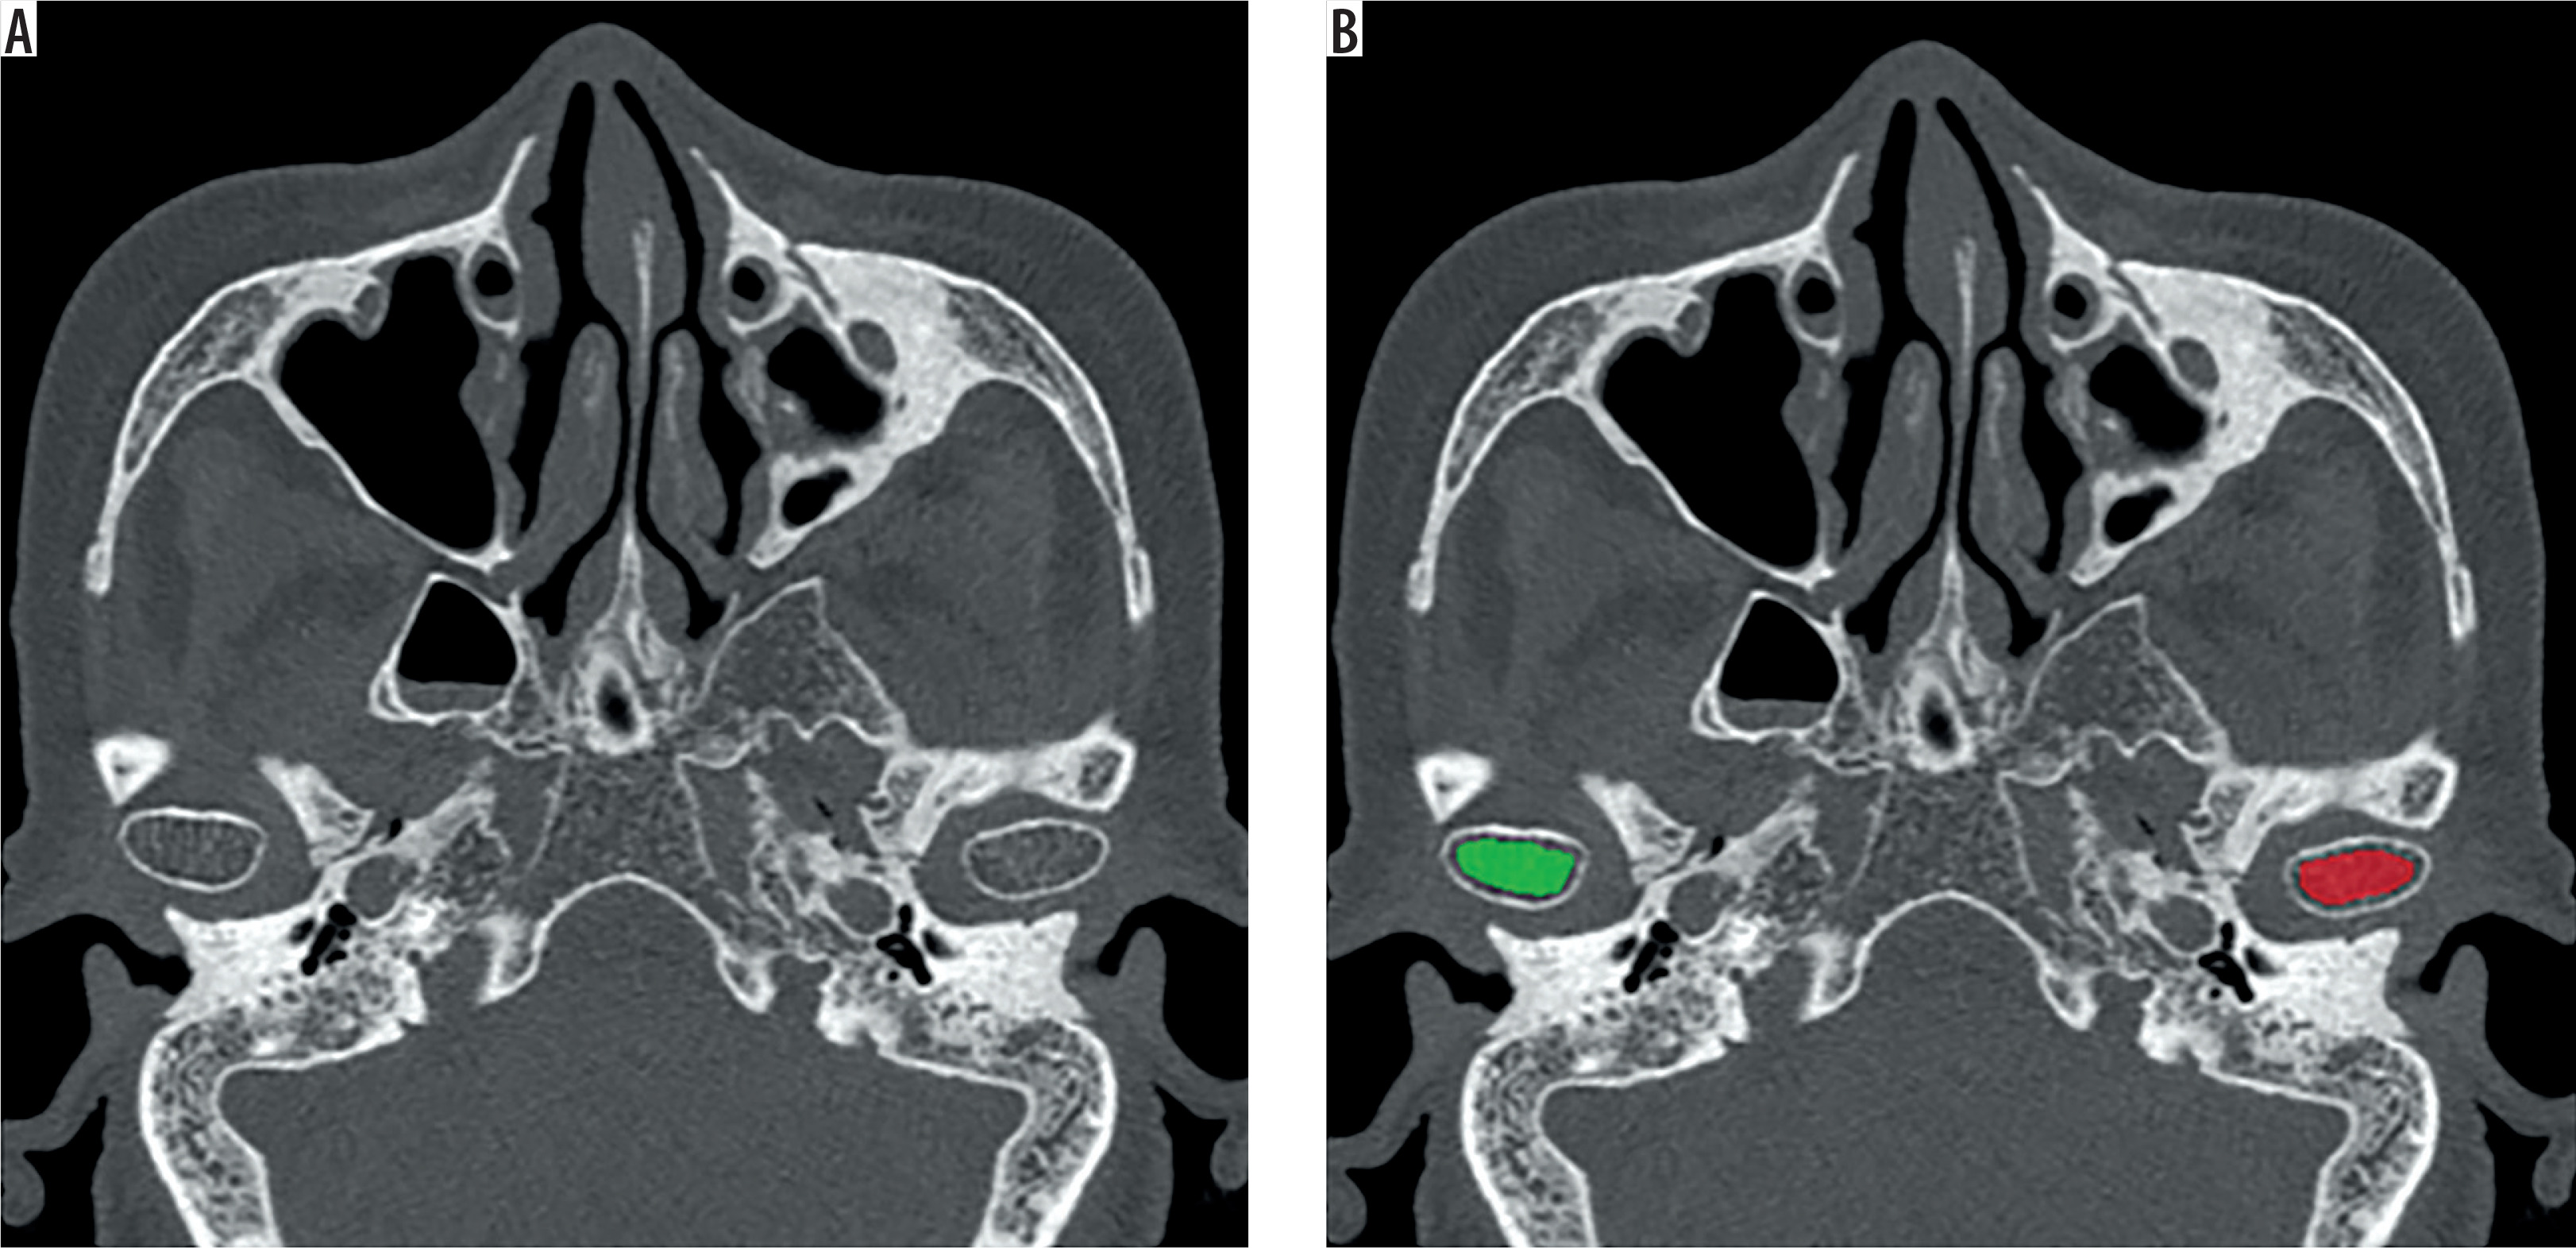
Texture features of the mandibular condyles on the affected and control sides of patients with MRONJ were analyzed using the open-access software MaZda version 4.6.2.0 (Institute of Electronics, Technical University of Lodz, Poland) [13-15]. To use this software, DICOM images were first converted into bitmap (BMP) format. Using CT settings for bone tissue (window level: 500 Hounsfield units [HU]; window width: 2800 HU), 279 texture features were extracted from each ROI in single-slice CT images. The images were normalized using the MaZda default (the intensity range of the image under analysis, from 1 to Ng = 2 k, where k is the number of bits per pixel used to encode the image under analysis). The parameters for extracting the features were as follows: gray-level run length matrix (GLRLM), 6 bits/pixel, 4 directions (0º, 45º, 90º, 135º); gray-level co-occurrence matrix (GLCM), 6 bits/pixel, 4 directions (0º, 45º, 90º, 135º), 5 distances (n = 1, 2, 3, 4, 5), absolute gradient; 4 bits/pixel, wavelets 8 bits/pixel. The texture features for each group (control and MRONJ) were selected based on their Fisher coefficients (Figure 2, Table 1), which represent the ratio of the between-class variance to the within-class variance and tends to increase when the correlation between features decreases. Further details on parameter selection are available on the software package website (http://www.eletel.p.lodz.pl/programy/mazda).
Table 1
Texture features extracted in the analysis
Variables
In this study, the primary predictor variable was the presence or absence of mandibular condyle involvement. The outcome variables were the texture features extracted from the ROIs on CT images, including histogram, GLCM, GLRLM, autoregressive model, and wavelet transform features.
Statistical analysis
The paired t-test and the Wilcoxon signed-rank test were used to compare texture features between the two groups. The normality of distribution of each texture feature was assessed using the Shapiro-Wilk test. SPSS software for Windows (IBM Corp., Armonk, NY, USA) was used for all analyses. A p-value of less than 0.05 was considered statistically significant. Post-hoc statistical power analysis was performed using G*Power 3.1.9.2 (Heinrich Heine University, Düsseldorf, Germany).
Results
Table 2 presents diagnostic and demographic data (age and sex) of the patients, and a summary of CT texture features. The mean age of patients with MRONJ was 80 ± 5.4 years (n = 31).
Table 2
Texture features of mandibular condyle bone marrow differentiating between the presence and absence of medication-related osteonecrosis of the jaw (MRONJ)
| Variable | Control side (n = 31) | MRONJ side (n = 31) | Fisher coefficient | p-value |
|---|---|---|---|---|
| Age (years) ±SD | 80 ± 5.4 | 80 ± 5.4 | ||
| Sex | ||||
| Male (n = 14) | 7 | 7 | ||
| Female (n = 48) | 24 | 24 | ||
| Histogram | ||||
| Percentile 90 ±SD | 105.55 ± 8.15 | 115.06 ± 9.72 | 1.1630 | < 0.001* |
| Percentile 99 ±SD | 118.84 ± 10.89 | 132.03 ± 12.99 | 1.2521 | < 0.001* |
| GLCM | ||||
| S(0,1)Correlat [IQR] | 0.91 [0.89-0.92] | 0.92 [0.92-0.93] | 1.1802 | < 0.001** |
| S(0,2)Correlat ±SD | 0.71 ± 0.06 | 0.76 ± 0.05 | 1.1332 | < 0.001* |
| S(1,1)Correlat ±SD | 0.82 ± 0.03 | 0.85 ± 0.03 | 1.4633 | < 0.001* |
| S(2,2)Correlat ±SD | 0.48 ± 0.09 | 0.58 ± 0.09 | 1.2297 | < 0.001* |
| S(3,3)SumEntrp ± SD | 1.21 ± 0.11 | 1.31 ± 0.09 | 1.0891 | < 0.001* |
| S(4,0)SumEntrp ±SD | 1.22 ± 0.1 | 1.32 ± 0.09 | 1.1129 | < 0.001* |
| Autoregressive model | ||||
| Sigma ±SD | 0.17 ± 0.02 | 0.15 ± 0.02 | 1.0756 | < 0.001* |
| Wavelet transform | ||||
| WavEnLL_s-2 ±SD | 8383.32 ± 1039.46 | 9630.07 ± 1372.68 | 1.0835 | < 0.001* |
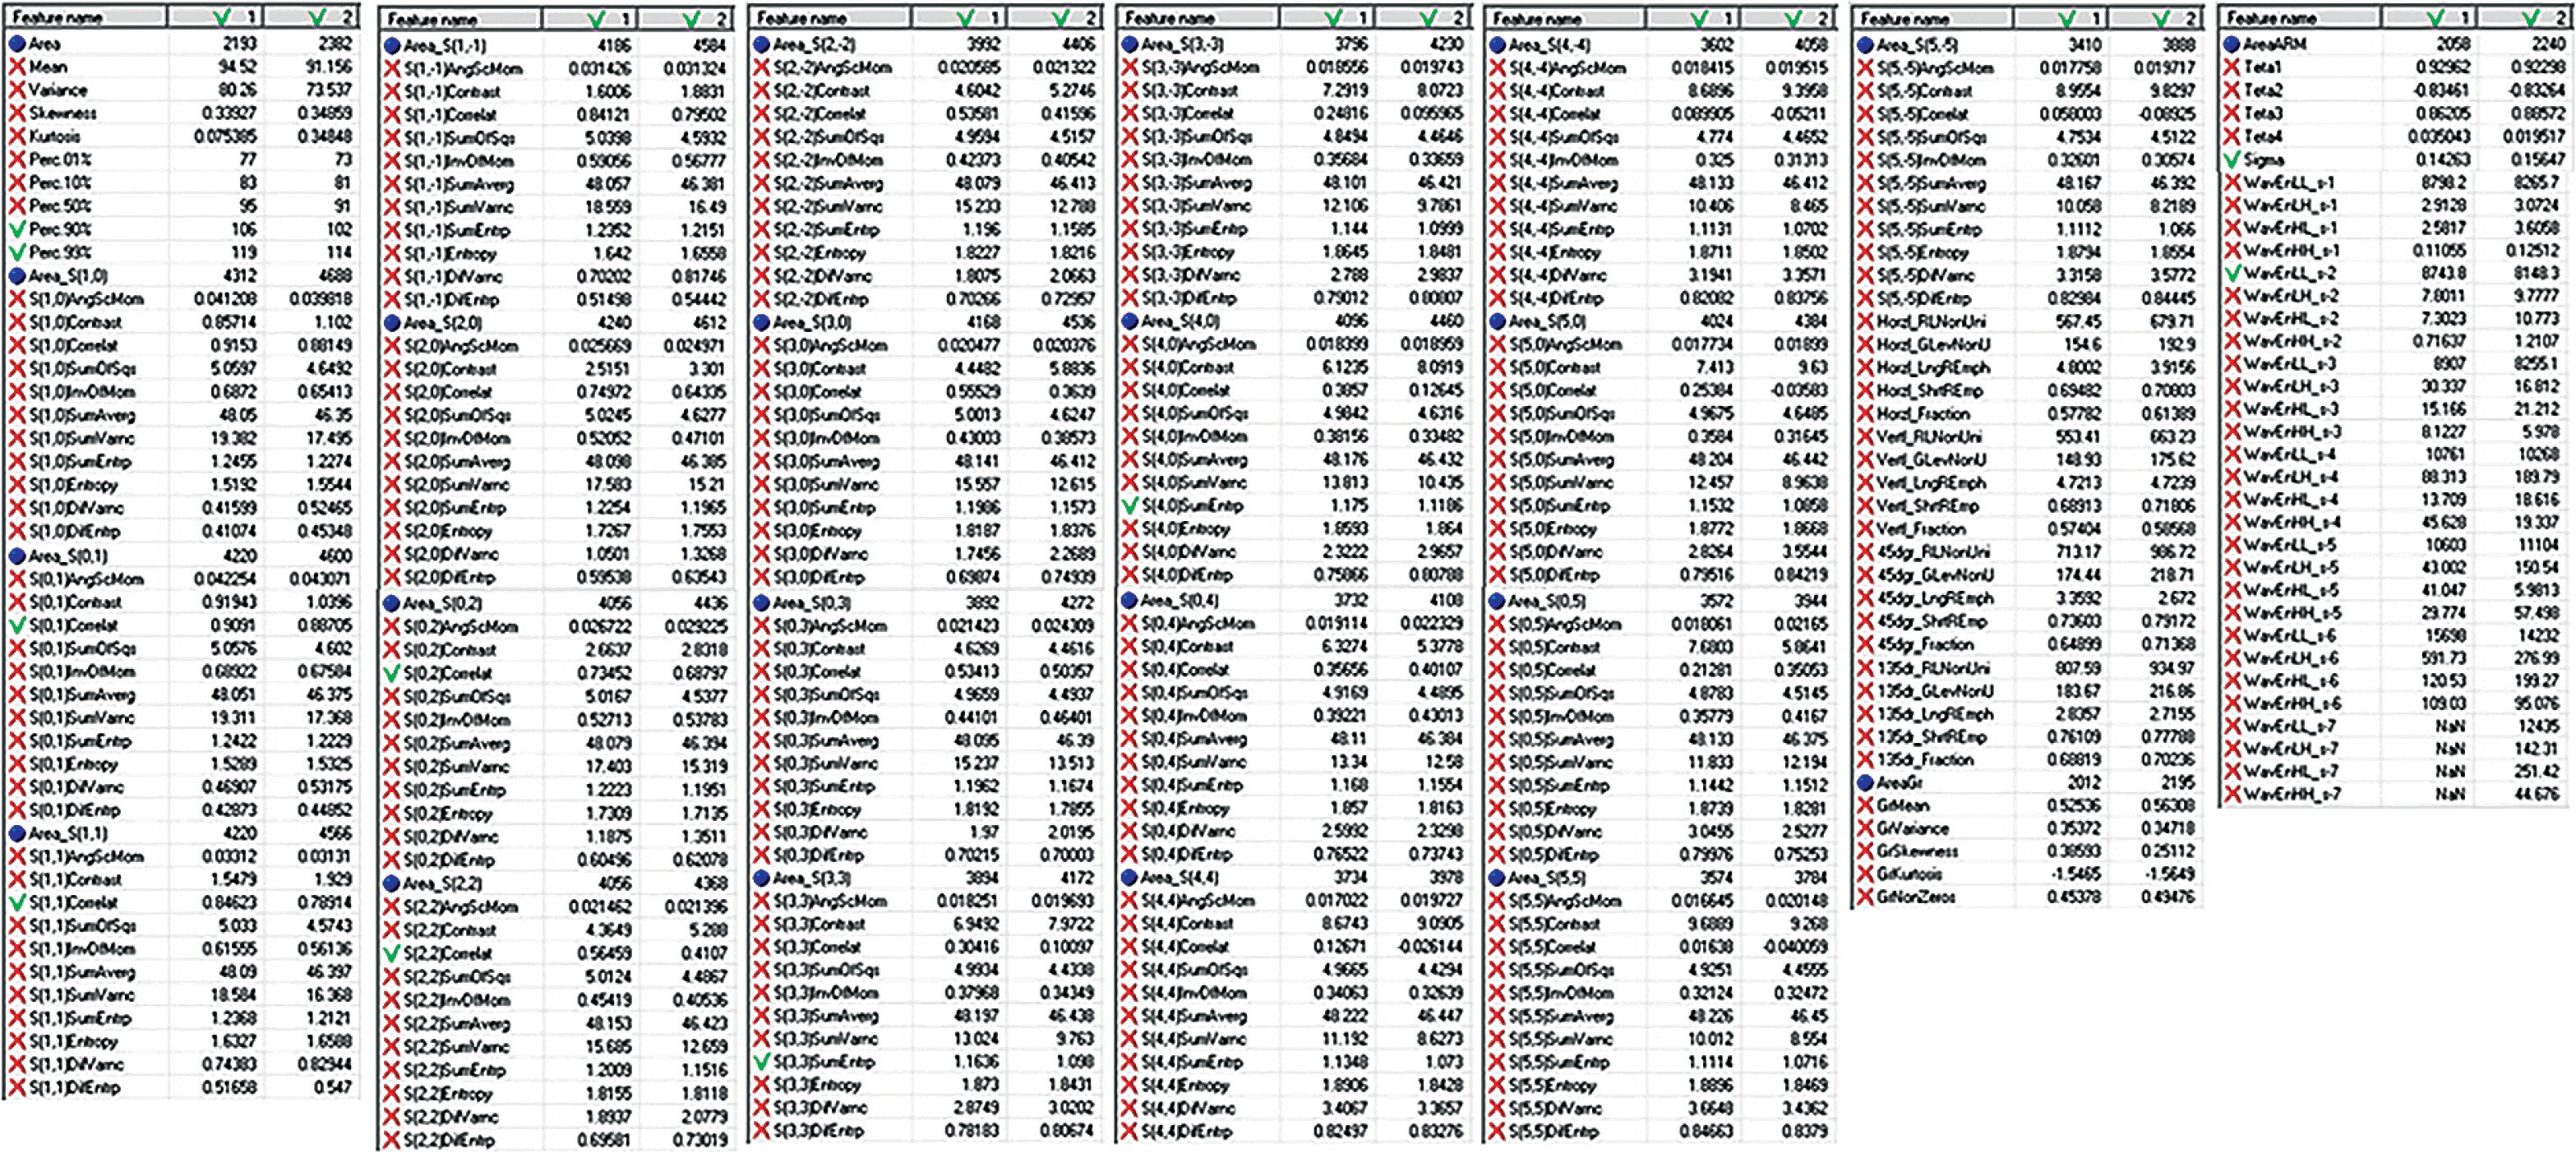
The top-10 texture features selected from the overall 279 features extracted by CT texture analysis were as follows: two histogram features (90th percentile, 99th percentile), six GLCM features (S(0,1)Correlation, S(0,2)Correlation, S(1,1)Correlation, S(2,2)Correlation, S(3,3)Sum Entropy, S(4,0)Sum Entropy), one autoregressive model feature (Sigma), and one wavelet-transform feature (Wavelet Energy in the Low–Low subband_s-2). These texture features were significantly more common on the affected side than on the control side in patients with MRONJ (p < 0.001) (Figures 3 and 4).
Figure 3
The patient was a 95-year-old female with medication-related osteonecrosis of the jaw (MRONJ) of the right mandible. Axial computed tomography images of the patient with MRONJ before (A) and after (B) region-of-interest delineation
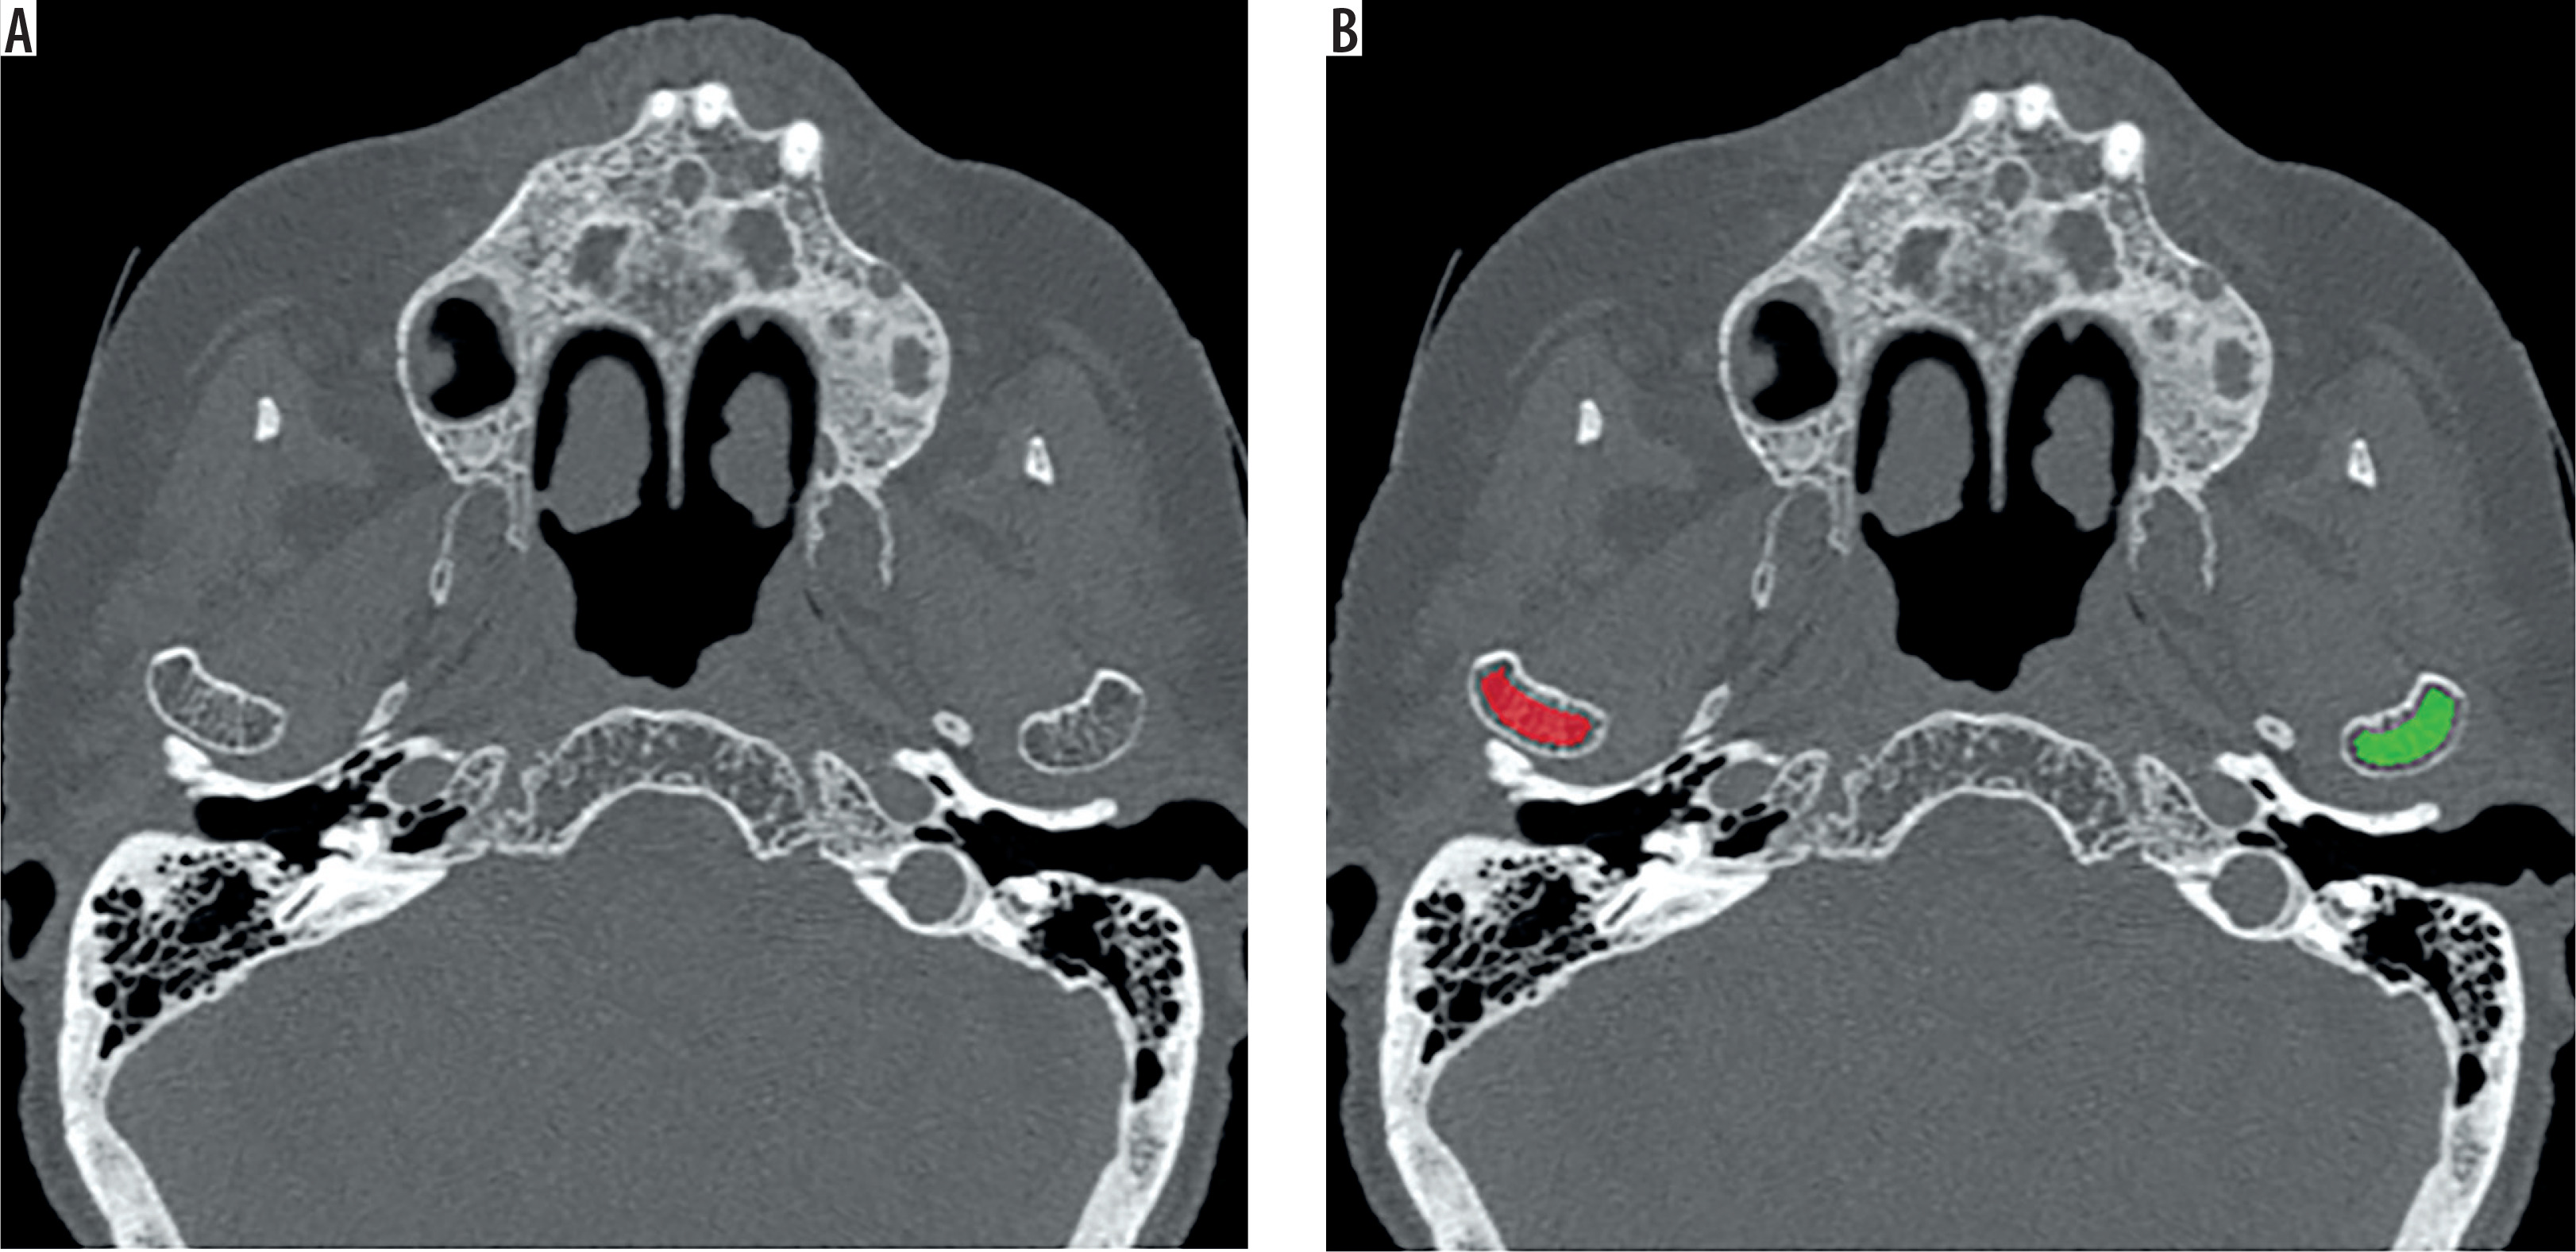
Figure 4
The patient was an 82-year-old female with medication-related osteonecrosis of the jaw (MRONJ) of the right mandible. Axial computed tomography images of the patient with MRONJ before (A) and after (B) region-of-interest delineation
The post-hoc power analysis demonstrated that the achieved statistical power ranged from 0.9995 to 0.9999.
Discussion
In this study, texture features of the mandibular condylar bone marrow on CT images exhibited significant differences between the affected and control sides of patients with MRONJ.
In texture analysis, a histogram is a statistical representation of the distribution of gray levels within a ROI and serves as a fundamental parameter for the quantitative evaluation of image brightness and contrast. The 90th percentile represents the maximum gray level after excluding the top 10% of the high-intensity pixels from the distribution of pixel gray levels. This serves as a representative measure of the high-intensity range, and minimizes the influence of outliers and extreme values. Similarly, the 99th percentile represents the maximum gray level after excluding the top 1% of the high-intensity pixels from the distribution of the pixel gray levels. In this study, both the 90th and 99th percentiles were higher on the affected side than on the control side in the mandibular condyles of patients with MRONJ, indicating elevated gray levels within the bone marrow on the affected side.
The GLCM quantifies the texture regularity and complexity by recording the frequency of gray-level combinations between neighboring pixels. Correlation measures the similarity between neighboring gray levels, with higher values indicating stronger directional patterns, whereas Sum Entropy reflects the complexity of gray-level sums, with higher values indicating greater variability. In this study, both the Correlation and Sum Entropy were significantly higher on the affected side than on the control side in patients with MRONJ. This suggests localized directional patterns and increased structural heterogeneity in the trabecular architecture of the mandibular condyle.
The autoregressive model predicts pixel values based on surrounding pixels, with Sigma representing unexplained noise. The lower Sigma values on the affected side in this study indicated the presence of more predictable large-scale intensity patterns on this side than on the control side.
Wavelet transform decomposes an image into frequency components, while Wavelet Energy in the Low–Low subband reflects the contribution of the low-frequency patterns. Higher values on the affected side in this study suggested the presence of more prominent large-scale structures in the mandibular condyles of this side in patients with MRONJ.
These findings suggested that subtle changes that are difficult to detect with the naked eye may occur in the trabecular structure of the affected mandibular condyle in patients with MRONJ. Previously, Knoepflin et al. [16] reported that texture parameters, such as Sum Entropy and Correlation, reflect alterations in bone microarchitecture. Several studies have used texture analysis to evaluate subtle changes in bone structure [17-22]. Furthermore, Hirahara et al. [12] demonstrated that MRONJ cases showed significantly higher signal intensity in the bone marrow of the mandibular condyle on the symptomatic side on MRI. Additionally, previous reports have shown that osteomyelitis has widespread effects, including on the soft tissue [23-28]. Therefore, structural changes may occur in the bone microstructure of the affected temporomandibular joint region in patients with MRONJ, even in the absence of clinical symptoms in the temporomandibular joint. Consequently, imaging analysis may be particularly useful for early detection of lesion extension in patients with MRONJ. Not only does the affected area require attention, but evaluation and continuous management of the temporomandibular joint are also important.
This study had some limitations, including its retrospective design and the potential for selection bias, which could not be entirely avoided despite the strict criteria employed.
Conclusions
The CT texture characteristics of the mandibular condylar bone marrow demonstrated significant differences between the affected and control sides in patients with MRONJ, suggesting that bone microstructural changes may occur in the affected temporomandibular joint region even in the absence of clinical symptoms. Therefore, the effects of the condition on the temporomandibular joint in these patients should be considered.