

Introduction
Hepatic steatosis is probably the most common pathological liver condition in the adult population [1,2]. Its epidemiology varies across the globe, with the lowest occurrence rates in sub-Saharan Africa and the highest (> 25% in adult population) in the Middle East and South America [3]. Wong et al. [4] noted an even a higher rate of 38% among adults who are suspected to be stricken with this condition. The potential of liver steatosis to transform into more serious diseases, such as hepatic cirrhosis, liver failure, or hepatocellular carcinoma, requires vigilance of both medical practitioners and patients for early and correct diagnosis it before it can lead to fatal conditions [5]. Moreover, liver steatosis is blamed for its wider psychosomatic negative effects because it is associated, on the one hand, with such diseases as hypertension, diabetes, and metabolic syndrome and, on the other hand, stress, anxiety, and higher risk of depression [6]. Despite the pressing need to detect it, medical staff encounter problem in accuracy (sensitivity, specificity) of various imaging methods in the early stages of steatosis, as well as when there are symptoms of fibrosis in liver parenchyma. Geethakumari et al. [7], in their systematic review, reported that ultrasonography (USG) offers good accuracy in medium to higher grades of steatosis; however, they suggest that, in lower levels of fat, technologies that use the attenuation rate are a more plausible option to decrease the rate of false positive or negative results. To improve the accuracy of liver assessment directed onto various stages of progressing steatosis or fibrosis, shear wave elastography [8,9] and attenuation imaging (ATI) [10-12] are suggested as promising options.
This research is worthy of attention because it presents visible differences in liver assessment directed towards liver fibrosis and steatosis, between USG and more state-of-the-art imaging methods, i.e. shear wave elastography (SWE) and ATI. Therefore, it may provide more clues for the improvement of liver diagnostics in the future. The general purpose of this research is to investigate how the application of various ultrasonography methods, both proven (USG) and novel ones (SWE and ATI), along with blood tests in a group of patients may affect the diagnostic outcome and how they could be treated as a possible non-invasive alternative to biopsy. What is more, these shall be confronted with what has been obtained in blood tests conducted on the patient group. The blood tests were carried out to check glucose levels and the basic indicators for liver assessment (cholesterol fractions, alanine transaminase [ALT], aspartate aminotransferase [ASP], and other indicators), and liver assessment ratios and indexes (De Ritis ratio, Fibrosis-4 index [FIB-4], etc.) have been calculated based on these results.
Material and methods
The study presented in this publication was approved by the Bioethics Committee of Wrocław Medical University, no. 355/2021 (number of consent).
Written consent forms regarding participation in the study were collected and retained from all the participants.
The patients underwent USG imaging diagnostics of their livers (B-mode – where liver parenchyma is juxtaposed to renal parenchyma, for comparison), and they underwent standard tests for active hepatitis B virus (HBV) or hepatitis C virus (HCV) infection – all of which were confirmed negative. The patients underwent basic anthropometric measurement (weight and height) and blood tests (platelets, liver tests, lipid profile) prescribed for patients with various hepatic conditions. Following this, each participant was checked with ATI and 2D-SWE imaging to reconfirm the initial USG result, whilst also checking liver steatosis and fibrosis. Patients fasted before the examination for at least 6 hours. Both measurements were conducted with use of Canon Aplio A (Canon Medical Systems Corporation, Japan) with a 1-8-MHz curvilinear probe in a supine position and through intercostal spaces. The measurement regions of interest (ROI) of 2D-SWE were placed inside the sample box, which was set at least 1 cm below the liver capsule. ROI used in the SWE examinations was set at a diameter of 10 mm, and in ATI it was adjusted to the minimum size. First, ATI evaluation was performed. Five consecutive acquisitions per patient with a reliable measurement coefficient (R2 value) of 0.90 or higher was considered as reliable. Second, 5 consecutive 2D-SWE liver stiffness acquisitions per patient were obtained with the IQR/median less than 30%. The median values of both ATI and 2D-SWE were used for the statistical analysis. Additionally, based on the blood test results and anthropometric measurement, various indicators were calculated:
body mass index (BMI), based on weight and height,
blood test results: fasting blood glucose levels, blood platelets (PLT), ALT, upper limit of normal ALT, AST, upper limit of normal AST, ALP, g-glutamyl transpeptidase (GGTP), bilirubin, total cholesterol (TC) level, high-density lipoprotein (HDL), low-density lipoprotein (LDL) fraction levels, and triglycerides (TG),
hepatic dysfunction testing (liver condition) indicators: v/ALT, FIB-4, APRI, de Ritis ratio, and GGTP.
Furthermore, based on ATI and SWE acquisitions and results obtained (SWE median value in kPa, ATI median value in dB/cm/MHz), index values for fibrotic and steatotic transformation were designated (F index value according to METAVIR scoring system for SWE median results for each participant, and S index value for liver cirrhosis based on ATI median result for each participant).
In Table 1, METAVIR scoring is presented with a description of how each score relates to each fibrosis stage and how each score is assigned according to intervals of SWE measurements.
Table 1
Classification of fibrosis stages according to the METAVIR scoring system based on shear wave elastography (SWE) measurement values [15-17]
In Table 2, the steatosis scoring system is presented, with each score assigned a specific steatosis stage and the interval results of ATI measurements.
Table 2
| Steatosis score | Steatosis stage | ATI measurement results (value in dB/cm/MHz) |
|---|---|---|
| S0 | No steatosis | ≤ 0.62 |
| S1 | Mild steatosis | 0.63-0.69 |
| S2 | Moderate steatosis | 0.70-0.74 |
| S3 | Severe steatosis | ≥ 0.75 |
Data preprocessing and visualisation were performed with Python 3.10.7 (packages: pandas 1.4.4, numpy 1.21.4, matplotlib 3.5.3, seaborn 0.11.2). Statistics were computed with use of Statistica 13.3 on license by Wroclaw Medical University. The normality distribution was checked with use of the Q-Q plots and analysis of skewness. Homoscedasticity was checked with the Levene test. Basic group-wise comparison of values of the selected parameters was based on the results from t test (with Cochran-Cox correction if necessary), Mann-Whitney U, and χ2 tests. In the case of a low (< 5) estimated count in any contingency table cell, Yates correction for continuity was applied.
Logistic regression was applied to investigate the association between the studied parameters and the odds of observing higher values of the F index among the population. Some variables (referred to as ‘effects’) did not show linearity vs. log (odds) as checked with the Box-Tidwell test. Such effects were transformed with the log1.15 function. The multivariate model candidate was derived based on the stepwise elimination algorithm (Appendix A). Possible interactions were checked for with the likelihood ratio (LR) type 1 test. Subsequently, selected interactions were explored with logistic regression models of full factorial design with each interaction analysed in a separate model. Due to the low sample size (N = 13) for the subgroup of participants with F2-F3 index value (more severe stages of fibrosis), additional goodness of fit of the model was tested.
Table 3 shows an almost even distribution of participants within the group according to sex. What may be of importance, only 22.2% of the whole group is represented by participants of age < 40 years. Furthermore, < 30% of participants had had no chronic diseases and had reported no intake of medications. Therefore, in general, the whole group demonstrates a dominating pattern for comorbidity (chronic diseases) and drug intake, with highly visible participation of persons who have had at least two chronic diseases and at least two medications administered.
Table 3
Basic statistical description of the group of participants (sex, age, chronic diseases, medication intake)
Table 4 shows that the most common chronic conditions among participants were blood hypertension (40.4%), diabetes (12.8%), and hypothyroidism (9.6%). On average, each participant with at least one reported chronic disease was stricken with 1.84 chronic morbidities.
Table 4
Chronic disease characteristics among participants
Inclusion and exclusion criteria
The selection of patients recruited for the study was based on a simple criterion of having a positive USG result for liver steatosis. Yet, what is substantial for this study, this diagnosis is considered a priori as insufficient, or likely as a falsely positive result [13,14], which required further procedures to verify it.
The whole group of participants, consisting of 117 patients (100% of the group), had had hepatic steatosis confirmed beforehand with USG, which was used as an inclusion criterion. Patients whose USG imaging results appeared to have been negative and falsely negative were automatically excluded from the study.
Results
Table 5 presents basic descriptive statistics presenting the obtained results within each variable. Values for normality distribution have been presented for the following variables: age, glucose, ALT, AST, FIB-4, APRI, De Ritis Index, ALP, GGPT, bilirubin, TG, LDL, median value from SWE, and median value from ATI. The average value with standard deviation was calculated for BMI, PLT, and TC. These values, along with the obtained skewness, were calculated for two subgroups of patients: those with F index value F0-F1, and those with F index value F2-F3. A p-value for statistical significance for each variable was calculated for the whole group.
Table 5
Normality distribution in two subgroups of patients (first group: F0-F1 index value, second group: F2-F3 index value)
| Variable | F index: F0-F1 (N = 104) | F index: F2-F3 (N = 13) | p | ||
|---|---|---|---|---|---|
| Values | Skewness | Values | Skewness | ||
| Age | {42, 53, 62}* | –0.15 | {60, 62, 66}* | –1.98 | 0.027 |
| BMI | [29.00 ± 4.48]** | 0.51 | [29.71 ± 4.83]** | 0.37 | 0.597 |
| Glucose | {86, 93, 101}* | 2.18 | {87, 110, 148}* | 0.85 | 0.018 |
| PLT | [242.86 ± 60.94]** | 0.62 | [209.62 ± 71.57]** | –0.45 | 0.072 |
| ALT | {24, 35, 50}* | 2.14 | {24, 41, 55}* | 1.12 | 0.532 |
| AST | {24, 27, 35}* | 4.34 | {28, 41, 61}* | 0.61 | 0.002 |
| FIB-4 | {0.78, 1.01, 1.46}* | 2.61 | {1.28, 1.79, 2.60}* | 1.88 | < 0.001 |
| APRI | {0.26, 0.34, 0.46}* | 7.17 | {0.40, 0.61, 1.07}* | 1.28 | 0.003 |
| De Ritis Index | {0.64, 0.79, 1.00}* | 1.04 | {0.76, 1.08, 1.20}* | 1.89 | 0.025 |
| ALP | {67.0, 79.5, 96.0}* | 4.33 | {63.0, 80.0, 111.0}* | 0.30 | 0.757 |
| GGTP | {20, 31, 64}* | 3.10 | {38, 48, 74}* | 2.68 | 0.038 |
| Bilirubin | {0.49, 0.68, 0.85}* | 2.07 | {0.59, 0.65, 0.74}* | 1.70 | 0.955 |
| TChol | [193.15 ± 39.71]** | 0.28 | [188.92 ± 51.04]** | 1.19 | 0.618 |
| HDL | [51.86 ± 12.26]** | 0.74 | [48.92 ± 14.31]** | 0.35 | 0.309 |
| TG | {89, 112, 146}* | 1.72 | {79, 120, 188}* | 3.00 | 0.622 |
| LDL | {96.0, 117.5, 136.0}* | 0.36 | {95.0, 112.0, 134.0}* | –0.58 | 0.338 |
| Median value from SWE (kPa) | {4.4, 4.7, 5.4}* | 0.43 | {7.2, 7.2, 7.7}* | 1.50 | < 0.001 |
| Median value from ATI (dB/cm/MHz) | {0.56, 0.60, 0.66}* | 0.59 | {0.60, 0.68, 0.74}* | –0.64 | 0.035 |
| Sex: Female | 48 (47.06%) | – | 8 (61.54%) | – | 0.491 |
| Sex: Male | 54 (52.94%) | – | 5 (38.46%) | – | – |
| F index: F0 - F1 | 104 (100%) | – | – | – | – |
| F index: F2 | – | – | 12 (92.31%) | – | – |
| F index: F3 | – | – | 1 (7.69%) | – | – |
| S index: S0 | 60 (57.69%) | – | 4 (30.76%) | – | – |
| S index: S1 | 27 (25.96%) | – | 3 (23.08%) | – | – |
| S index: S2 | 8 (7.69%) | – | 1 (7.69%) | – | – |
| S index: S3 | 9 (8.65%) | – | 4 (30.76%) | – | – |
Table 6 shows the population sample split into two groups based on their F index. The first subgroup consists of patients diagnosed with no hepatic fibrosis (F0) or minimum fibrotic changes in liver parenchyma (F1), while the second subgroup consists of participants with more significant states of progression of hepatis fibrosis (F2-F3). Significant differences in values were spotted in context of: age (p = 0.027), glucose concentration (p = 0.018), AST activity (p = 0.002), FIB-4 (p < 0.001), APRI (p = 0.003), de Ritis index (p = 0.025), GGTP activity (p = 0.038), and measurements from the used devices (SWE and ATI, respectively: p < 0.001, p = 0.035). The values of these parameters were higher in the group of higher F index (F2-F3). Importantly, FIB-4 shows the highest level of statistical significance among all the variables (p < 0.001), which may be a good basis to additionally check the effects of interactions of FIB-4 with other variables on the odds of seeing F2-F3 indexes (conducted further in Tables 9 and 10).
Table 6
Goodness of fit of the tested model
The values of the corrected Akaike Information Criterion (AICc) constitute only a slightly larger value than the AIC value, which may be a good predictor of the quality of the employed logistic regression model.
To indicate the fit of the model, several measures for the goodness of fit were calculated. The goodness of fit of the model with regard to F2-F3 values among the whole group of participants was checked against the pseudo-R-squared value tests. The obtained values (Cox-Snell R2 = 0.228761 and Nagelkerke R2 = 0.450166) may be a good measure of whether the designed model has a high goodness of fit.
As the next step, an elimination stepwise process was conducted (Appendix A) to determine multivariate model candidates with the most significant impact on the odds of observing higher F values among the participants. While AST, ALT, and glucose have been determined as the most promising candidates in the process, in Table 7 their impact on observing these values was checked on the example of the reference patient.
Table 7
Odds of observing higher F index values among participants (reference patients) depending on assumed increase of aspartate aminotransferase (AST), alanine transaminase (ALT), or glucose
Table 7 presents the odds of observing higher F index in a reference patient. The algorithmically-derived model (Table 7, Figure 1) featured three effects: AST (p = 0.001), ALT (p = 0.003), and glucose (p = 0.003). Therefore, these three parameters, simultaneously, modulated the odds of observing higher values of the F index (F2-F3). The baseline odds for a patient with typical AST, ALT, and glucose values (26.69 IU/l, 35 IU/l, 93 mg/dl, respectively), were 0.031 (p < 0.001), meaning that only 3.1% of such patients would show F index values higher than 1. Out of the three aforementioned effects, the one associated with AST was the strongest one, increasing the baseline odds 2.133-fold with every one-unit increase in AST. Conversely, the effect of a one-unit increase in ALT decreased the baseline odds by approximately 6%. Elevation of glucose concentration by one unit increased the baseline odds by 4.3%. The tendency of changing odds for all three effects is also presented in Figure 1.
Figure 1
Odds of observing higher F index depending on increase of AST and ALT activity and glucose levels – visual presentation
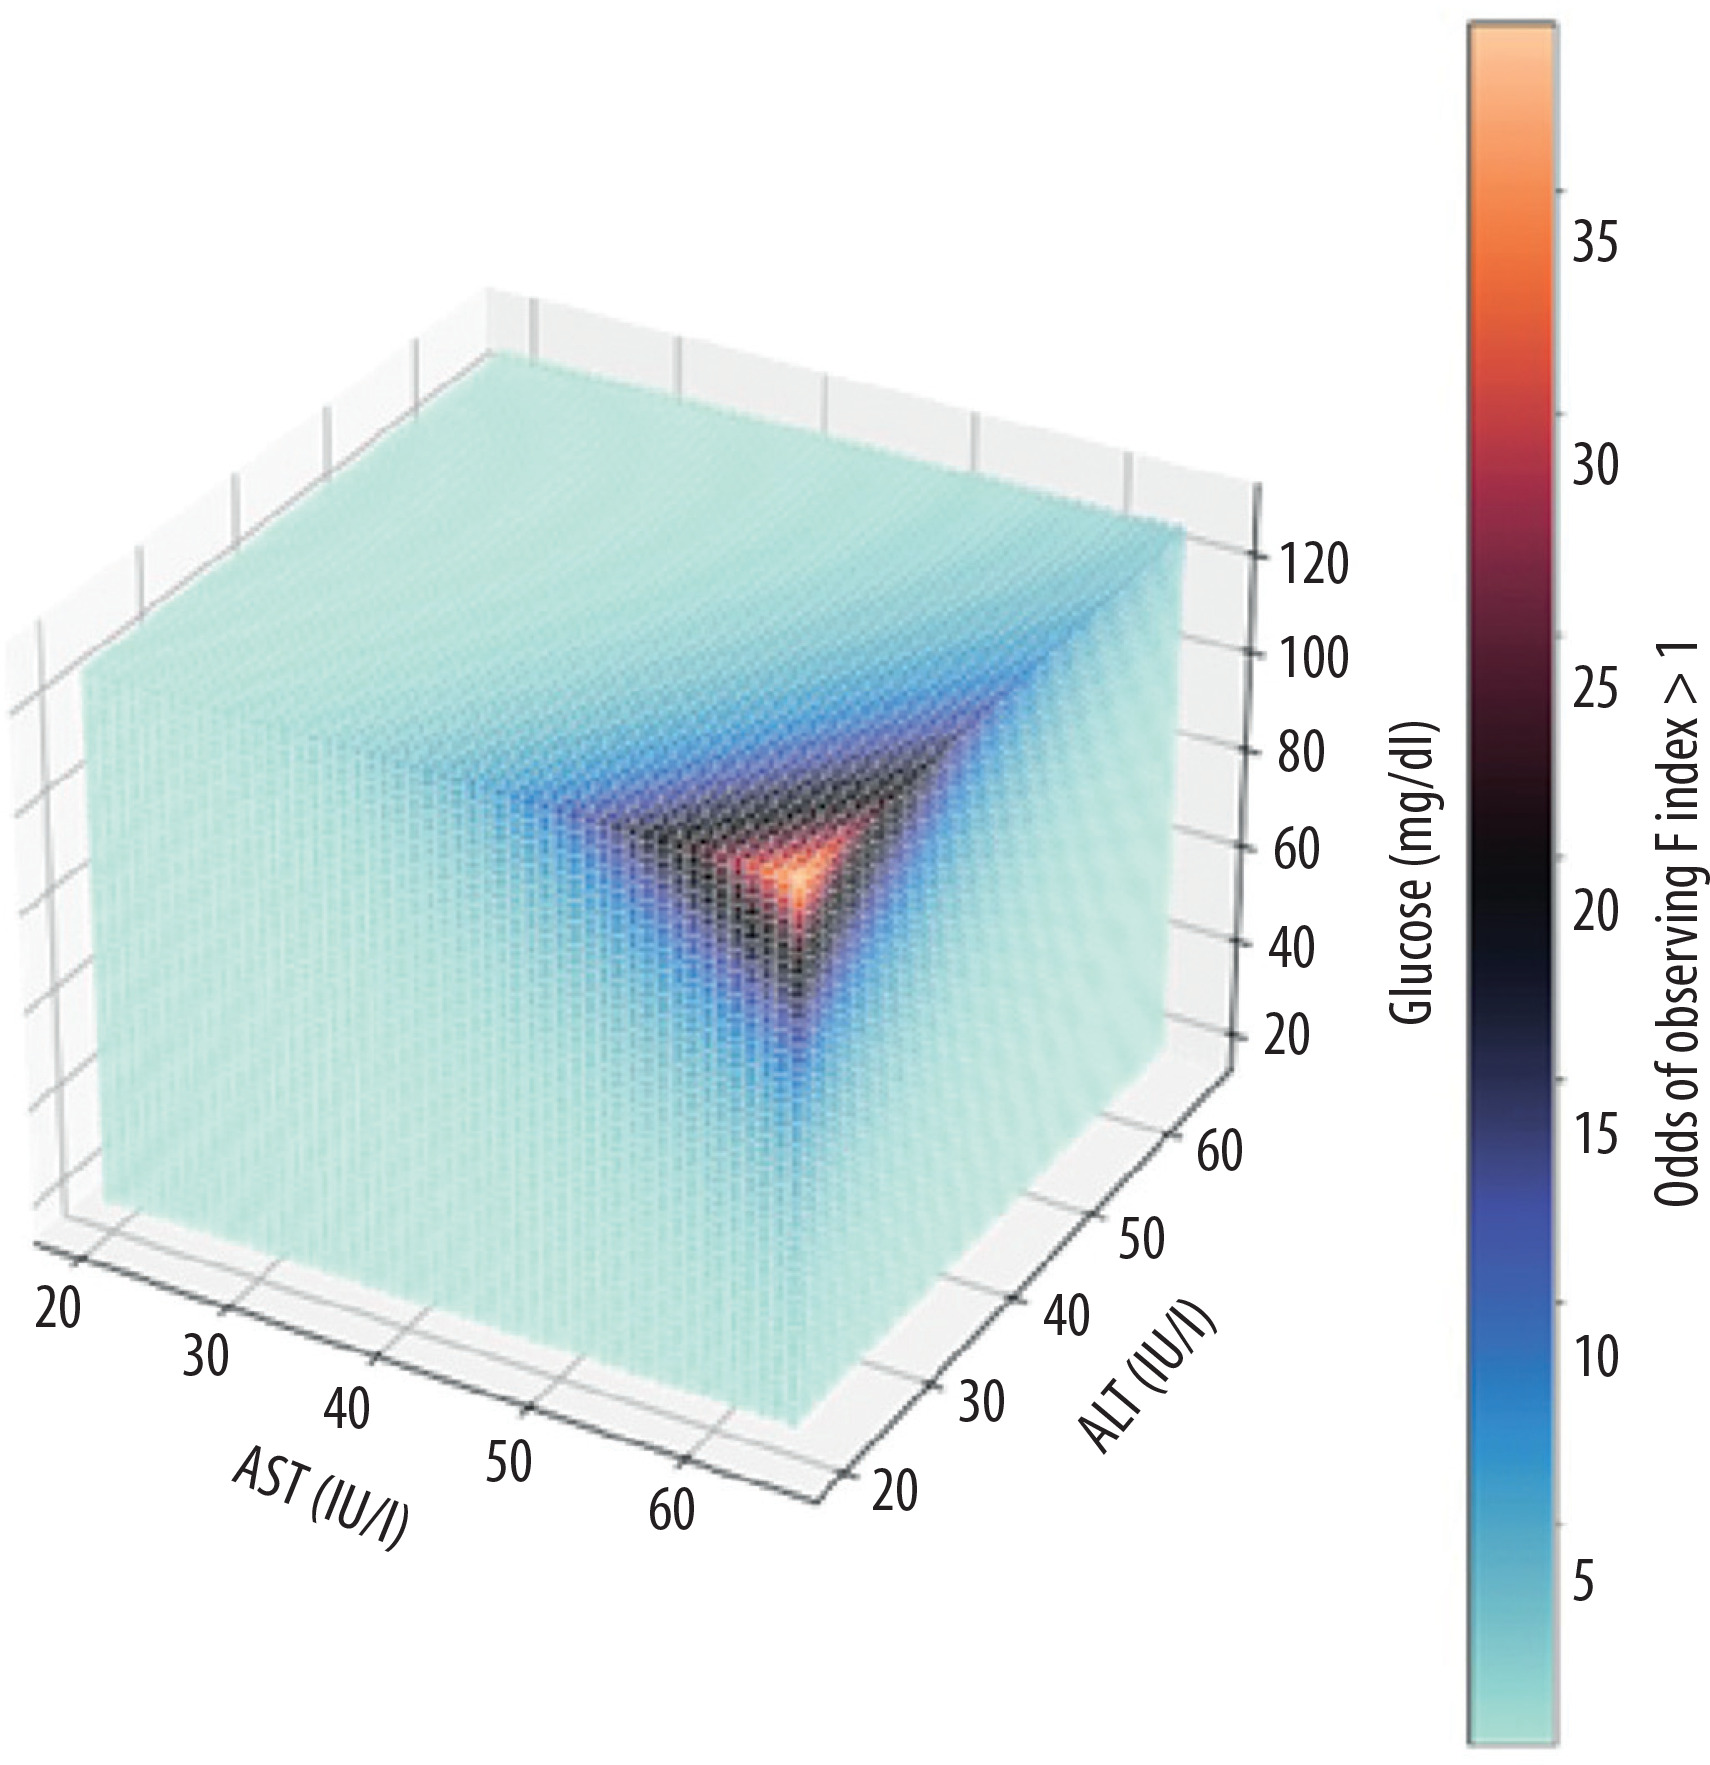
Figure 1 shows a three-dimensional presentation of how the odds ratio is shaped depending on the level of AST, ALT, and glucose, with some obvious and expected results on AST and glucose, as predictors of higher F index. The higher F index with a negative tendency in ALT levels may be surprising, but this outcome will be discussed later if there is any evidence in the literature confirming a similar observation.
Univariate analysis of how each variable may impact the odds of observing a higher F index is presented in Table 8.
Table 8
Univariate analysis of effects
The above calculations are accompanied with visual presentation on whisker plots in Figure 2.
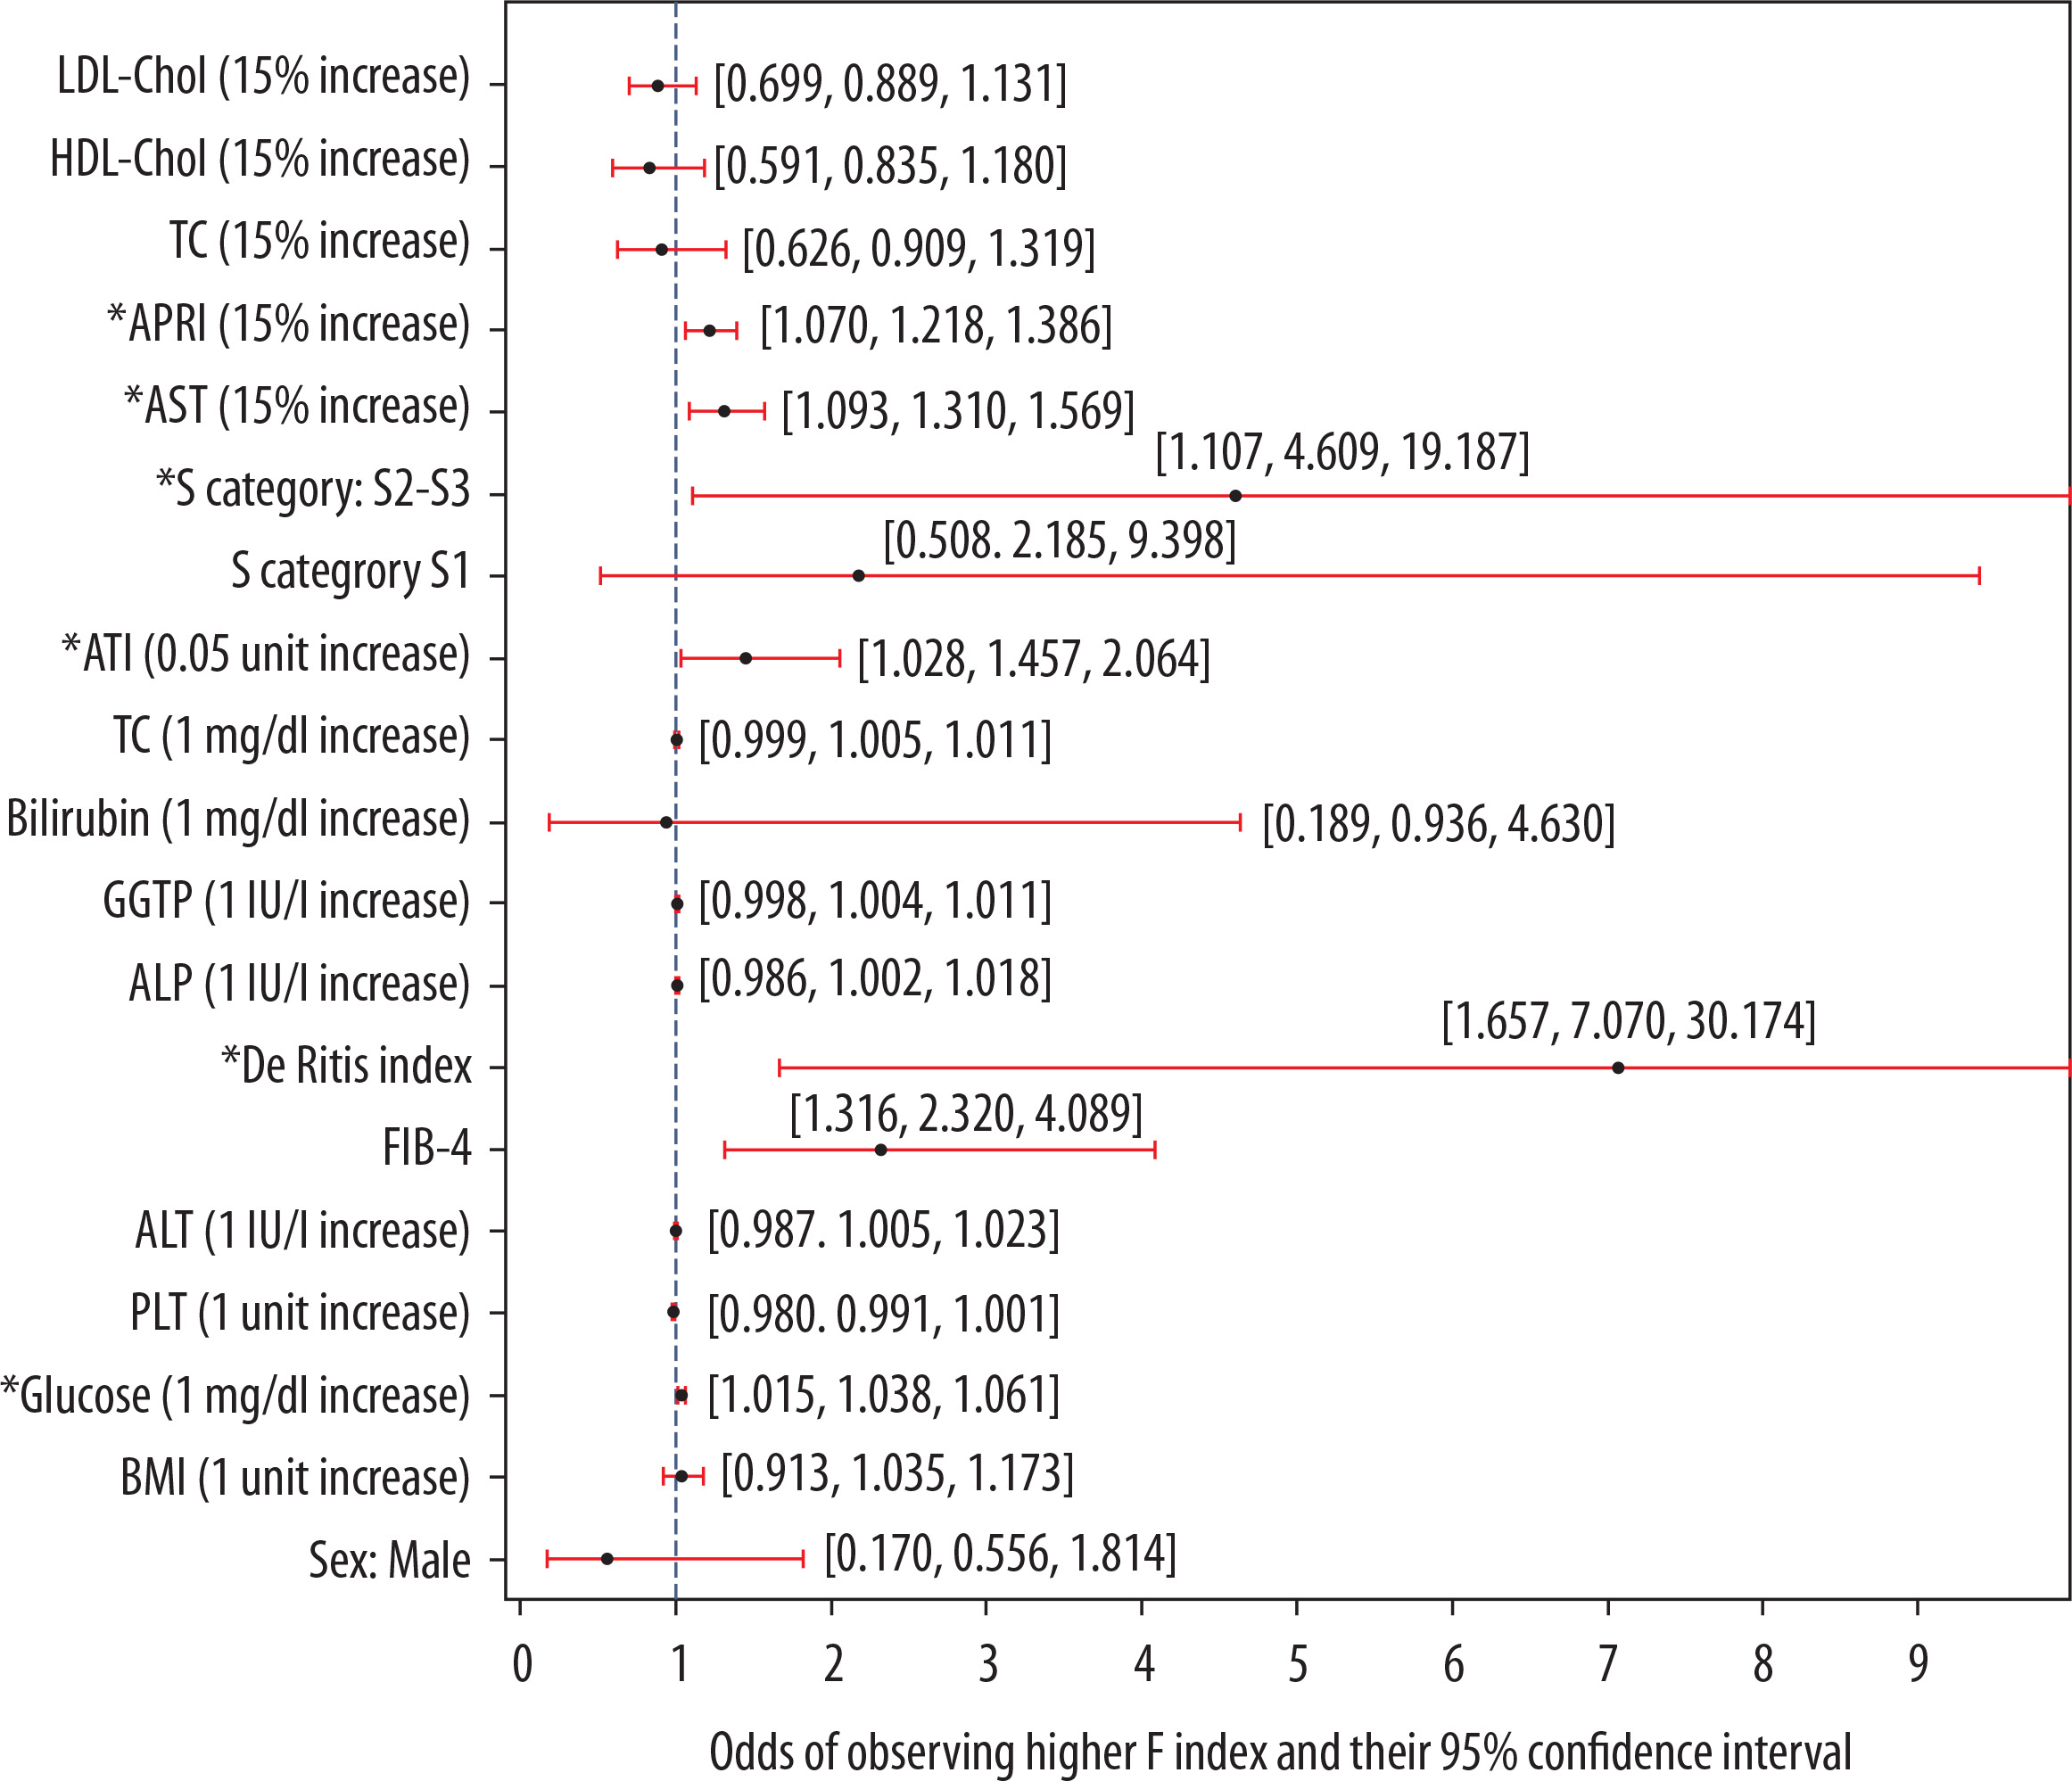
In Figure 2, in univariate analysis, the odds of observing a higher F index among the patients increased with the following: glucose concentration (3.8% increase per 1 mg/dl increase, p = 0.001), FIB-4 (2.32-fold increase per one-unit increase, p = 0.004), de Ritis index (7.07-fold increase per one-unit increase, p = 0.008), ATI value (45.7% increase per increase by 0.05, p = 0.034), AST (31% increase per 15% increase in AST, p = 0.003), and APRI (21.8% increase per 15% increase in APRI, p = 0.003). Moreover, compared to the S0 index, values higher than S1 (S2-S3) were associated with 4.609-fold higher odds of spotting higher F2-F3 index values (p = 0.036), which may be an obvious observation since fibrosis is a change in liver parenchyma that occurs after steatotic changes and may progress concurrently.
Due to FIB-4 being a good candidate to see odds of higher F index (p > 0.001 – see: Table 5).
The results of the performed likelihood test ratio in Table 9, show that the best candidate pairs to check how the odds of a higher F index change upon interactions between them are as follows: FIB-4 and PLT (p [LR] = 0.0168), FIB-4 and AST log 1.15 (p [LR] = 0.0193), FIB-4 and GGTP (p [LR] = 0.027), and FIB-4 and APRI (p [LR] = 0.0406).
Table 9
Results of likelihood ratio type 1 test
These interactions were tested in the next step, which was analysis of interaction on four reference patients (Tables 10A-D for respective interactions among reference patients).
The initial analysis of interactions revealed that GGTP∗FIB-4, PLT∗FIB-4, AST∗FIB-4, and APRI∗FIB-4 are candidates for further analysis (p = 0.027, p = 0.017, p = 0.019, p = 0.0406, respectively). However, upon exploring the full factorial models containing these interactions along with the effects taking part in them (Table 10), only GGTP (p = 0.036, Table 10A) and PLT (p = 0.018, Table 10B) appeared to significantly modulate the effect of FIB-4 on the odds of observing higher F index among the study participants, while the modulation by AST and APRI was on the brink of statistical significance (p = 0.064 and p = 0.053, respectively; Table 10C-D). According to the model (Table 10A), each one-unit increase in GGTP activity decreased the effect of FIB-4 on the odds of observing higher F index by approximately 1.11%. Conversely, this FIB-4-associated change in the odds would increase by 1.1% with every one-unit elevation in PLT.
Table 10
Changes in impact of FIB-4 on the odds of observing higher values of the F index – results from analysis of interactions
Table 10A
Interaction 1. Reference patient: FIB-4 = 1, GGTP = 32
Table 10B
Interaction 2. Reference patient: FIB-4 = 1, PLT = 236
Table 10C
Interaction 3 - Reference patient: FIB-4 = 1, AST = 26.69
Table 10D
Interaction 4 – Reference patient: FIB-4 = 1, APRI = 0.37
Discussion
The above analysis indicates that the use of USG among patients may not be sufficient for effective diagnosis of liver steatosis and fibrosis among adult patients. Classical USG, in particular, is not very effective at detecting and assessing liver fibrosis, which is a condition indicating more developed or complicated progression of liver disease.
The study shows that after the recruitment of patients whose post-USG diagnosis detected liver steatosis, additional imaging with the use of SWE and ATI showed that USG alone delivered false positive results in some participants. The additional imaging procedures that employed ATI for liver steatosis and SWE for liver fibrosis have shown that 64 patients (60 from the subgroup with F0-F1 index and 4 from the subgroup with F2-F3 index) were confirmed to have no liver steatosis (S0), while 30 further participants had only had a mild steatosis (S1 – 27 participants with F0-F1 index and 3 participants with F2-F3 index).
This general observation is confirmed by various studies, which suggest that ATI and SWE extend imaging diagnostics, because USG may be, in some cases, inaccurate (falsely positive results towards liver steatosis) [20-22]. However, these studies are based on imaging techniques only, while Ijima [23] in industry-financed analysis (for Canon, producer of ATI imaging devices), and later Tada et al. [19], have concluded in a similar manner for ATI, i.e. that its diagnostic value in checking liver steatosis is comparable to that offered by biopsy.
Ma et al. [24] indicate that both ATI and SWE are effective at diagnosing both liver fibrosis and steatosis as the main and most common associated conditions. However, these authors concluded that ATI may be even more effective, but this observation may be subject to type of liver disease (they worked with metabolic dysfunction-associated steatotic liver disease). In addition, Yazdani et al. [25] suggest that SWE is effective at diagnosing liver steatosis, stating that it is a plausible alternative to invasive methods such as biopsy.
On the other hand, among the participants of this study who were diagnosed with liver steatosis based on USG imaging, this was only re-confirmed with ATI imaging among 8 participants (diagnosed with S1-S3 steatosis stage) among the whole subgroup with F2-F3 values (N = 13). This may suggest that SWE and ATI imaging combined were effective at the more credible evaluation of liver condition, while they both may be effective at cross-examining the liver to check whether there is not only steatosis but also fibrosis, and – also very important – which patients may be affected by both liver conditions at the same time. Many authors confirm such effectiveness of cross-examination of liver condition, with the use of ATI and SWE at the same time (also variants of SWE technology: pointed SWE or two-dimensional SWE) [16,26,27].
As an extension for this discussion, more in-depth observations could also be presented. Yuri et al. [28] assessed whether ATI may be affected by liver fibrosis, but they rejected this assumption, thus demonstrating that ATI is highly steatosis-sensitive, and its imaging capability is not affected by fibrosis as an additional factor blurring (falsely enhancing or diluting) the ATI measurement results. The same should apply to SWE; however, the effectiveness of both ATI and SWE may be negatively affected by additional factors not included in this study (inflammatory activity) [29].
Based on the normality distribution, this study confirms that ATI and SWE results are statistically significant (p < 0.001 and 0.035, respectively). But what comes out of the results is that there are some promising predictors for higher F index value (F2-F3) and S index value (S2-S3), and these are as follows: age, glucose levels, AST, GGPT activity, as well as liver function indicators: FIB-4, De Ritis Index, and APRI.
Additional statistical procedures show that the most promising candidates for prediction of F2-F3 index value (more developed fibrosis) are: AST, ALT and glucose levels. What this shows the odds of observing higher F value is based on the assumption that AST and glucose levels are higher, while ALT levels. AST, however is the most strong predictor elevating odds of observing F2-F3 value more than ALT or glucose. These results, namely, high AST/low ALT linkage, may indirectly show that de Ritis index, too, may be associated with higher F value (De Ritis Index is merely a proportion between AST and ALT levels: the higher AST, or lower ALT, the higher the value of the Ritis index is).
Regarding the age, correlation with higher S or F index is confirmed by plethora of sources, so that the term coined for the condition is age-related hepatic steatosis [30-32], hence, the above study does not deliver any new results on this long-standing and well-proved correlation between age and liver steatosis.
What the study shows is an interesting linkage between high AST and glucose, low ALT which at the time are responsible for high odds of observing F2-F3 index among the participants, according to this study. What is seen in literature, high AST is broadly confirmed as a predictor for the progression of fatty liver disease, and fibrosis and steatosis as its main symptoms [33-35]. The same applies to high AST along with high ALT [36-39]. Yet, correlation between ALT, AST and glucose, altogether, in patients liver steatosis is rarely studied, but if so, it is rather conducted with a different research goal in mind (what roles they have in leading to prediabetes and diabetes) [33,40,41].
Yet, the literature may give some initial response to this observation, as there are opinions that ALT may be a weaker predictor in hepatic conditions (steatosis or fibrosis), than have so far been thought since: its levels decrease with age progression among patients, also its levels increase at the beginning of steatosis and then they may decrease [42,43]. Weak value of ALT in predicting liver steatosis or fibrosis comes from a wider 2017-2018 NHANES study [44].
The result of, somewhat contradictory to the results seen in literature, specifically with regard to ALT levels, may be: 1) correct, if this is related to high values of De Ritis ratio, which are a good predictor for more developed stage of steatosis and fibrosis in liver, 2) correct if they describe a general tendency within the group pf participants where older patients prevail (see Table 3), 3) incorrect, basing on the low sample size, specifically, number of participants who have had F2-F3 index and low ALT levels (> 30) at the same time (N = 8). Hence, such a linkage needs to be verified in further studies.
FIB-4 index may also be a good predictor for seeing F2-F3 among participants, as it is confirmed through the high statistical significance of results in univariate analysis, which also presents that its increase leads to higher odds of observing higher F index among participants. Its impact was examined in pairs (interactions) with GGPT, platelet count, AST and APRI value, where two former interactions have come out to be statistically significant, while two latter ones where on the brink of statistical significance.
Higher FIB-4 value along with increased GGPT ratios are confirmed in literature [45], however value of GGPT in diagnosing liver steatosis and fibrosis may be inferior to De Ritis index, APRI, or AST levels [46]. Interaction of FIB-4 and platelet count leading to higher F index in the study shows only a minimum positive change (1.1% increase). However, results from the literature do not judge the impact of this pair, i.e. unidirectionally. Zijstra et al. [47] observed correlation between decreasing PLT levels along with increasing FIB-4 index when liver fibrosis was progressing in observed patients. Malladi et al. [48] confirmed the observation of Zijstra et al. [47] on the lower levels of PLT, but they indicated that a decrease of PLT in patients with progressing steatosis and – particularly – fibrosis is accompanied with increased PLT activation, which means that the explanatory value of PLT for various liver diseases (also where there is both steatotic and fibrotic transformation of liver tissue) is not with serum PLT level but with PLT concentration in the liver tissue and its proinflammatory and pro-fibrous activity.
The main limitation of this study is that within the whole group of participants, individuals diagnosed with an F2-F3 index value may have been underrepresented (N = 13) in comparison to individuals who had an F0-F1 index value (N = 104). This drawback encountered during the recruitment of participants for the study has – at least in part – been mitigated with the series of statistical tests conducted. Another limitation of this study may be related to the assumed reference patient approach (Table 7 and Table 10), which is related to a ‘hypothetical participant’, which may not give comparable results to studies where the same interactions have been studied on larger sample sizes.
Suggestions for future study:
Because there was a significant share of participants with blood hypertension, it may be reasonable to research various publications studying relationship between blood hypertension and liver steatosis and cirrhosis [49]; the same approach could be given to the comparison of patients with chronic disease vs. healthy patients, or patients with intake of at least one drug vs. patients not taking any drugs.
Re-examination of significance of ALT levels in determining higher F index, but on a larger group of participants with F > 1 index value.
The effects of measuring liver fibrosis and steatosis with SWE and ATI, respectively, should be compared to the results of liver biopsy in further studies (alongside the same set of blood tests among two compared groups of patients) to determine the extent to which SWE-ATI, following USG initial examination, is accurate when confronted with liver biopsy (non-invasive vs. invasive approach).
Conclusions
ATI and SWE are plausible, ultrasound-based imaging techniques that may be considered as an alternative or supplementary to USG. Utility of both imaging techniques in checking liver condition among adult patients is especially important because in USG false positive results may be obtained regarding liver steatosis, and it is relatively ineffective in detecting liver fibrosis. In the study, a relationship between higher F index and higher S index was also presented, which means that the study participants who had their liver steatosis (S2-S3) confirmed in ATI would also have confirmed liver fibrosis in more progressed stages (F2-F3) at the same time. This reaffirms the fact that fibrosis follows steatosis when liver condition deteriorates, but there are also other various reasons for liver tissue to become fibrous (drug intake, other chronic disease), which may be clearly read from the statistics (Tables 3-5).
The results of the study show that the blood tests conducted among the patients examined with ATI-SWE, which included determining the glucose levels, the basic indicators for liver assessment (cholesterol fractions, ALT, ASP, etc.), and liver assessment ratios and indexes (De Ritis ratio, FIB-4, etc.), suggest that the most promising predictors for higher F index are as follows: high AST level, high glucose level (although not widely confirmed in literature), high FIB-4 value, and moderately higher APRI and higher GGTP ratio. A separate mention should be made here for lower ALT levels as a good predictor to seeing higher F index alongside elevated AST and glucose levels, which may be related to the fact that its diagnostic value may be overestimated, especially in situations when the ALT level does not explain deteriorating liver condition (in elderly patients and patients with more progressed liver fibrosis).