Introduction
Hepatic fibrosis is a progressive process that may be caused by various aetiological factors and may result in liver failure. Determination of disease severity and early diagnosis of chronic liver disease (CLD) is crucial to slow its progression through early treatment and lifestyle changes.
A liver biopsy is the reference standard for the assessment of liver fibrosis. However, it is invasive, has a risk of complications, and is expensive. Therefore, using non-invasive tests that are cheaper, easily accessible, and highly reproducible facilitates clinical practice. Non-invasive tests for the diagnosis and staging of liver fibrosis include grading systems based on laboratory tests and clinical parameters, as well as imaging methods showing the physical condition of the liver parenchyma (stiffness, attenuation, etc.) or functions [1].
Fibrosis-4 (FIB-4) scoring is an index for liver fibrosis and is calculated using the variables of age, aspartate transaminase (AST), alanine transaminase (ALT), and platelet count (PLT). The fibrosis-5 (FIB-5) index is a recently proposed fibrosis marker [2]. Studies report that it is superior to the FIB-4 score, especially for patients with HBV and HCV infections [3,4].
Ultrasound (US), computed tomography (CT), and magnetic resonance imaging (MRI) are the imaging modalities used in the diagnosis of CLD. Recently gadoxetic acid-enhanced MRI has been used to assess liver fibrosis [5]. Gadoxetic acid (gadolinium ethoxybenzyl diethylenetriamine pentaacetic acid) is a gadolinium-based paramagnetic contrast agent excreted via the hepatobiliary and renal routes. It is taken up by hepatobiliary cells and excreted into the biliary tract.
Bastati et al. [6,7] developed a method based on the hepatobiliary phase of MRI, called the functional liver imaging score (FLIS). They found that FLIS scores of 4-6 denoted better prognosis compared to scores of 0-3 in patients with CLD and liver transplant. In this study, we aimed to assess the diagnostic performance of FIB-4 and FIB-5 in discriminating preserved (FLIS ≥ 4) and impaired (FLIS < 4) hepatic function in patients with CLD.
Material and methods
Patients who underwent dynamic upper abdominal MRI with Primovist (Bayer; Berlin; Germany) for the diagnosis of CLD in our centre between June 2019 and February 2024 were reviewed. The exclusion criteria were inadequate image quality and no hepatobiliary phase image at 20 minutes. Because the data were obtained from the hospital database in a single centre retrospectively, informed consent was waived. The study was approved by the institutional Ethics Committee (TABED 2-24-578; 16.10.2024), and the study protocol conformed to the ethical guidelines of the 1975 Declaration of Helsinki, as revised in 2000.
Laboratory and clinical data were obtained from our institutional database. FIB-4 and FIB-5 scores were calculated using AST, ALT, alkaline phosphatase (ALP), albumin, and PLT values of each patient’s laboratory parameters, which were obtained one week before or after the MRI. The FIB-4 and FIB-5 index was calculated according to the following formula [2,8]:
FIB-4 = Age (years) × AST (U/l)/[PLT count (109/l) × ALT (U/l)]1/2
FIB-5 = ((albumin (g/l) × 0.3 + PLT count 109/l) × 0.05) – (ALP (U/l) × 0.014 + AST to ALT ratio × 6 + 14)
Magnetic resonance imaging scans were performed with a GE Signa Pioneer 3T device. The acquisition parameters were as follows: Axial T2 WI (FOV: 38 × 38 cm, TR/TE: 4280/90 ms, slice thickness: 5 mm, frequency: 352 × 224), Coronal T2 WI (FOV : 40 × 40 cm, TR/TE: 3750/90 ms, slice thickness: 5 mm, frequency: 320 × 230), Axial T1 WI (FOV: 40 × 40 cm, TR/TE: 4.9/2.6 ms, slice thickness: 4 mm, frequency: 260 × 162), and Coronal T1WI (FOV: 44 × 44 cm, TR/TE: 4.2/2.3 ms, slice thickness: 4 mm, frequency: 300 × 200). Primovist was administered at 0.1 ml/kg with an injection rate of 1 ml/s. Hepatobiliary phase images were obtained 20 minutes after the Primovist injection.
FLIS scoring was performed from hepatobiliary phase images on MRI according to the method described by Bastati et al. [7]. Briefly, 3 parameters (liver parenchymal enhancement quality score, biliary contrast excretion quality score, and portal vein sign quality score) are rated between 0 and 3, and then the FLIS score is calculated by summing these scores (Table 1, Figure 1). Two radiologists with 7 and 20 years of experience evaluated the images, and all 3 parameters of the FLIS score and the total score were determined independently. The readers were blinded to patients’ history and clinical data. One observer repeated the FLIS scoring 4 weeks after the first session to assess intra-observer variability in 40 randomly selected patients. Liver contrast, portal venous sign, and biliary contrast were evaluated visually.
Table 1
Method for functional liver imaging score (FLIS)
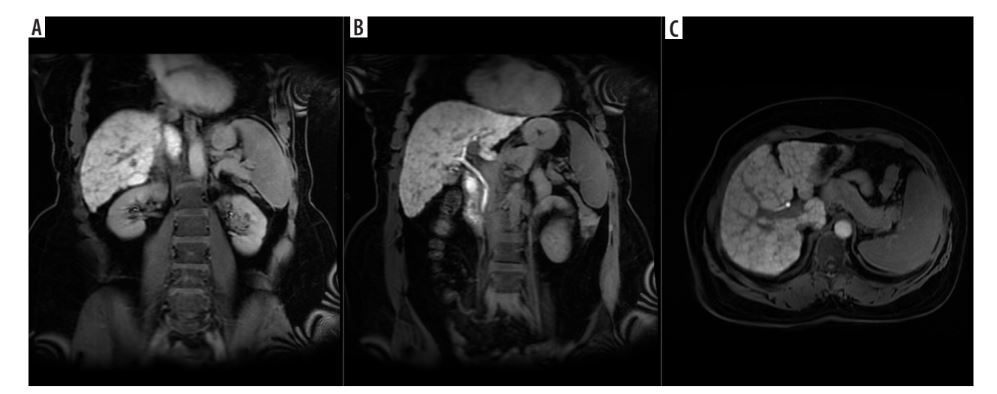
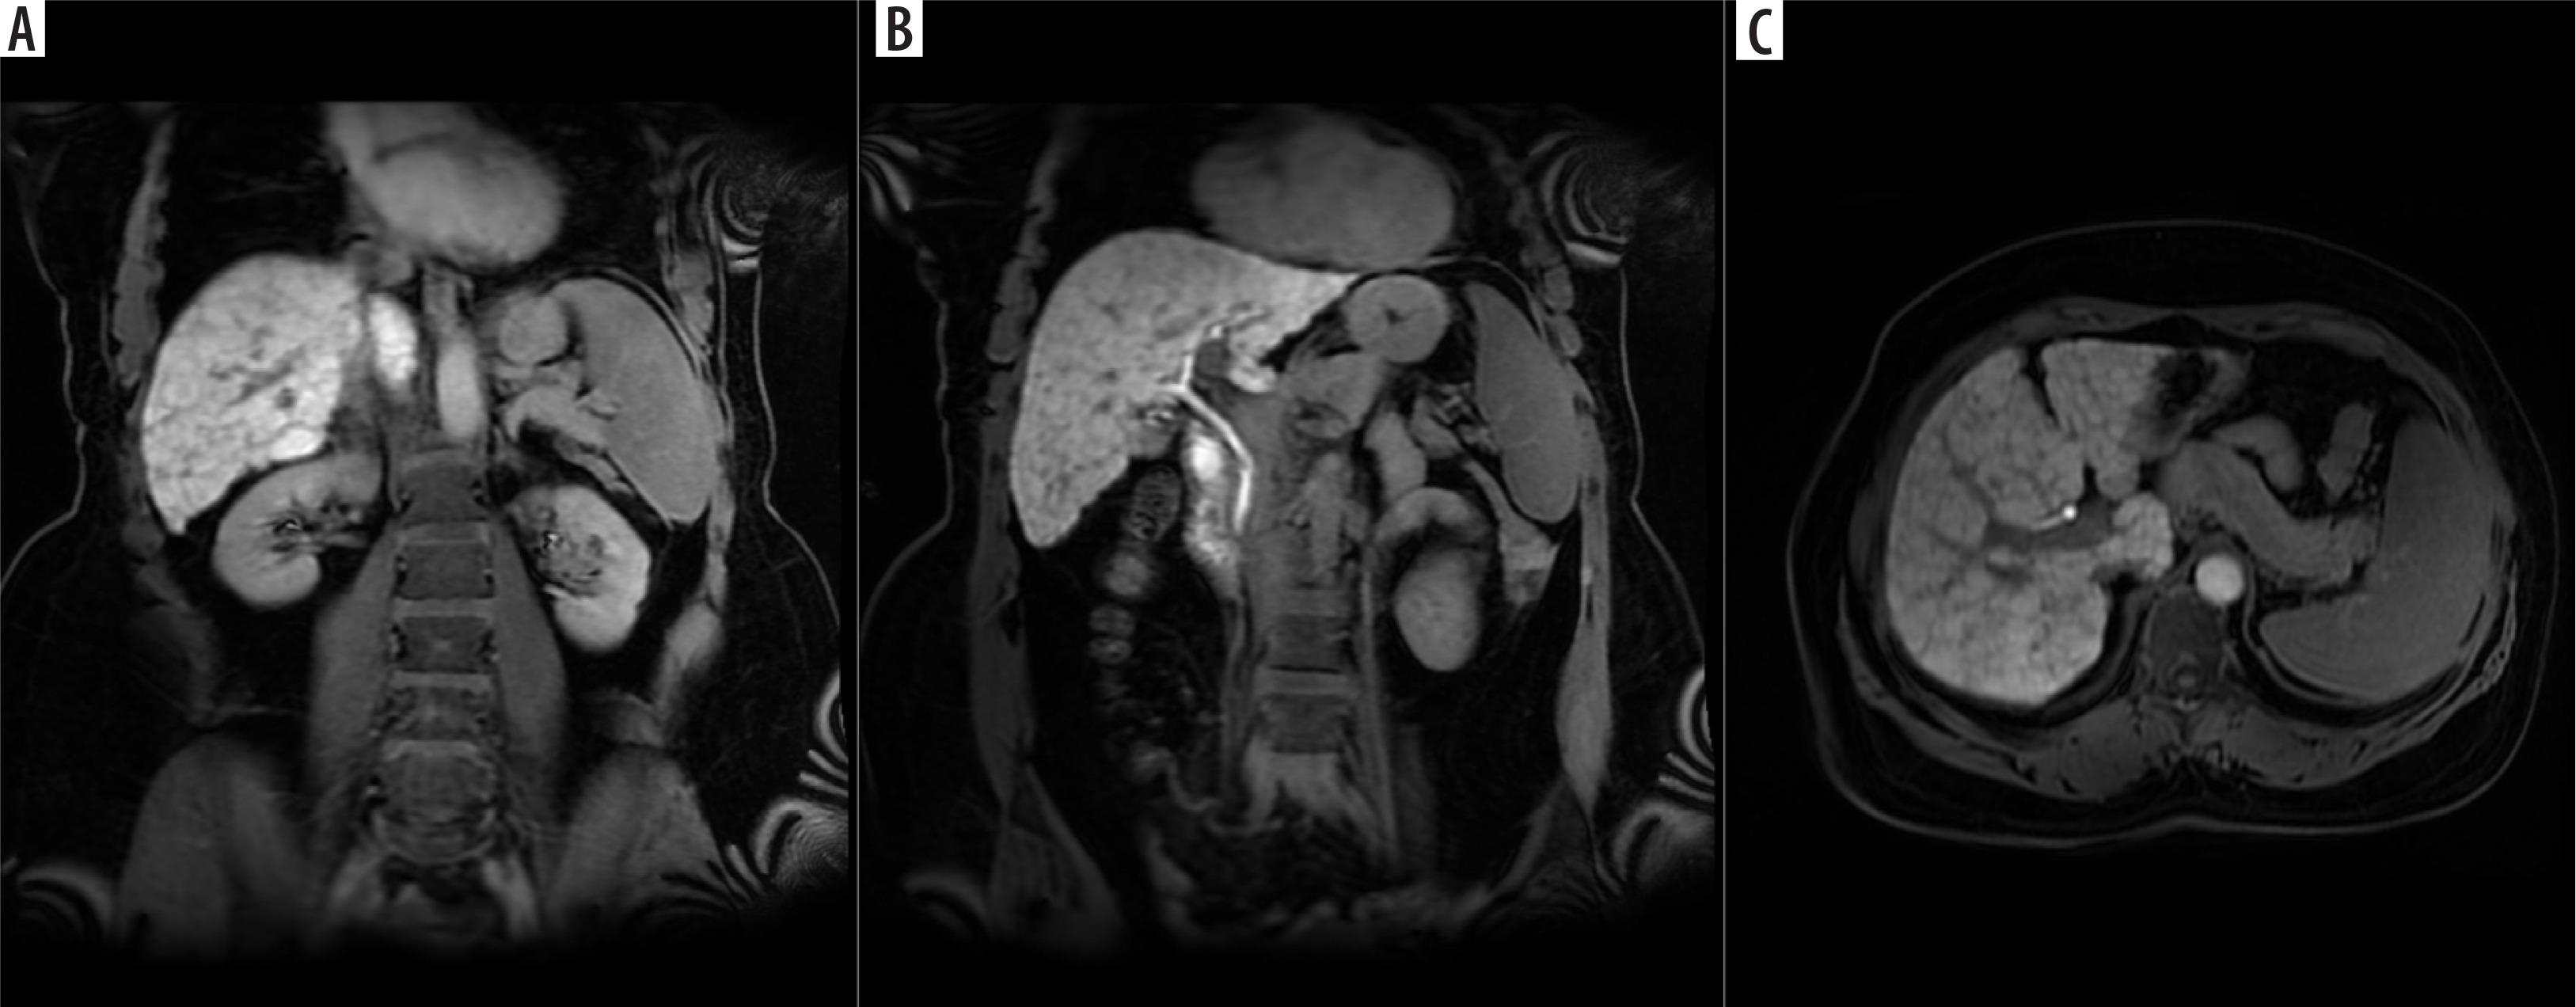
Figure 1
A) Coronal hepatobiliary phase (at 20th min) contrast-enhanced T1AG according to liver parenchyma signal intensity (2 points). B) Coronal hepatobiliary phase (at 20th min) contrast-enhanced T1AG according to biliary excretion (2 points). C) Axial hepatobiliary phase (at 20th min) contrast-enhanced T1AG according to portal vein signal intensity (2 points). The FLIS score is the sum of these points (FLIS score = 6)
Using the FLIS scores, the hepatic function was interpreted as preserved (FLIS ≥ 4) or impaired (FLIS < 4) as described before [6], and the diagnostic performances of the FIB-4 and FIB-5 scores in discriminating preserved and impaired hepatic function were assessed.
Statistical analysis
Categorical variables were given as frequency and percentage, and compared using the χ2 test. Continuous variables were given as mean ± standard deviation or median and interquartile range depending on whether they conform to the normal distribution. Intra- and inter-observer agreement was evaluated with κ statistics. Because the κ statistics are affected by prevalence, prevalence and bias-adjusted κ (PABAK) statistics were also given. κ values were assessed as follows: 0.21-0.40 fair, 0.41-0.60 moderate, 0.61-0.80 substantial, and ≥ 0.81 almost perfect agreement.
Diagnostic performances of FIB-4 and FIB-5 scores in discriminating preserved (FLIS ≥ 4) and impaired (FLIS < 4) hepatic function were assessed by plotting the receiver operating characteristics (ROC) curves. FIB-4 and FIB-5 values maximising Youden’s index were selected as optimum cut-off values, and then sensitivity, specificity, and positive and negative predictive values (PPV and NPV) were calculated. Analyses were made using Stata 17.0 (StataCorp, College Station, TX).
Results
Between June 2019 and February 2024, 163 consecutive patients underwent dynamic upper abdominal MRI with Primovist (Bayer; Berlin; Germany) for the diagnosis of CLD. Patients with inadequate image quality (n = 13) and no hepatobiliary phase image at 20 minutes (n = 49) were excluded. Therefore, the study population included 101 patients (35 [34.7%] women and 66 [65.3%] men; mean age 61.0 ± 11.3 years). The most common cause of chronic liver disease was hepatitis-B virus infection (n = 56, 55.5%), and this was followed by cryptogenic chronic liver disease (n = 19, 18.8%, Table 2).
Table 2
Aetiologies of chronic liver disease
There was no significant difference between those with FLIS ≥ 4 and FLIS < 4 patients with regard to sex (percentages of women were 33.7% vs. 44.4%, respectively, p = 0.518) and age distribution (61.6 ± 8.9 vs. 60.9 ± 11.6 years, respectively, p = 0.870). However, albumin and platelet levels were significantly higher and AST levels were lower with a borderline significance (p = 0.059) in patients with preserved (FLIS ≥ 4) hepatic function compared with those with impaired hepatic function (FLIS < 4) (Table 3).
Table 3
Baseline characteristics
Inter-observer agreement for rating as preserved or impaired hepatic function based on FLIS scores was almost perfect (κ value 0.843; and PABAK value 0.974), and intra-observer agreement was perfect (κ and PABAK values 1).
While FIB-4 was significantly lower (median and interquartile ranges 3.4 [2.3; 5.5] vs. 6.1 [4.3; 10.3], p = 0.004), FIB-5 was significantly higher (37.1 [34.5; 40.4] vs. 33.6 [32.7; 36.0], p = 0.015) in patients with preserved versus impaired hepatic function. There was a moderate negative correlation between FIB-4 and FIB-5 (r = –0.636; p < 0.001).
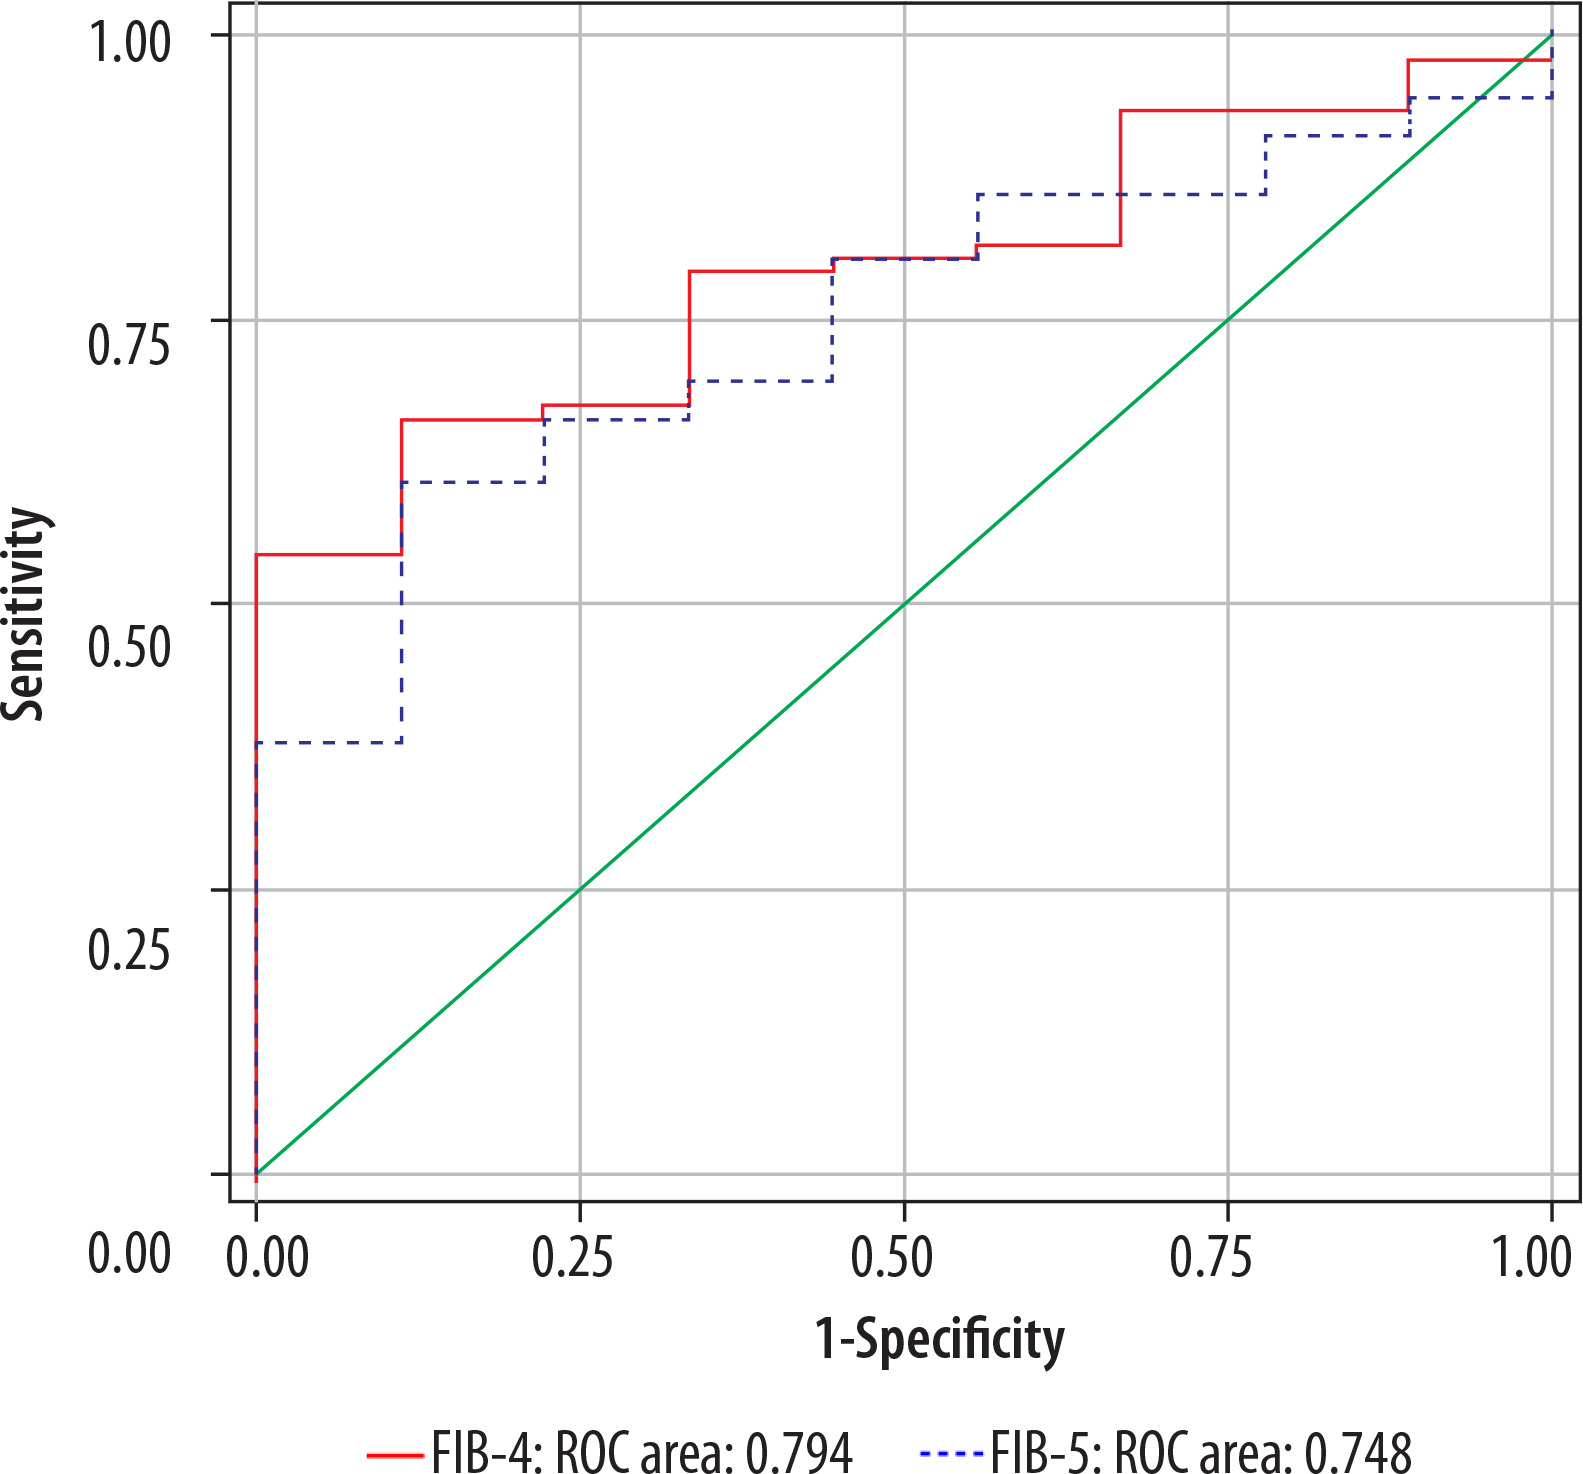
FIB-4 and FIB-5 had a moderate diagnostic performance in discriminating preserved and impaired hepatic function (area under the ROC curves 0.794 [95% confidence interval 0.681-0.906] for FIB-4, and 0.748 [95% confidence interval 0.614-0.881] for FIB-5, p < 0.001) (Figure 2). Comparison of the area under the 2 ROC curves revealed that FIB-4 and FIB-5 had similar discriminative values (p = 0.405). For FIB-4, a cut-off value of 4.2 had a sensitivity of 88.9%, specificity of 66.3%, positive predictive value (PPV) of 20.5%, and negative predictive value (NPV) of 98.4%, meaning that FIB-4 values of less than 4.2 are valuable in ruling out poor hepatic function (low FLIS score). For FIB-5, a cut-off value of 36.2 had a sensitivity of 88.9%, specificity of 60.9%, PPV of 18.2%, and NPV of 98.2%, meaning that FIB-5 values higher than 36.2 are valuable in ruling out poor hepatic function.
Discussion
Chronic liver disease is among the major health problems worldwide. Differentiation of patients with preserved and impaired hepatic function is crucial in terms of implementing earlier individual management for those with preserved hepatic function, and further diagnostic testing for those with probable poor hepatic function. Therefore, the discrimination of these patients using easily applicable, low-cost methods is valuable. The FIB-4 index is an accepted method used to determine the degree of fibrosis in CLD with different aetiologies [9]. A positive correlation was found between the FIB-4 index and histologic liver fibrosis stage [10]. The recently developed and validated FIB-5 score was found to be superior to the FIB-4 score in the differentiation of severe and non-severe fibrosis in patients with HCV [2]. Bastati et al. developed an imaging score, the FLIS score, which provides valuable morphological and functional information [6]. In the present study, we assessed the diagnostic performances of easily obtainable biochemical markers, FIB-4 and FIB-5, in discriminating preserved (FLIS ≥ 4) and impaired (FLIS < 4) hepatic function, and we found that they had similar high performance in ruling out patients with poor hepatic function.
Assessment of patients with CLD includes morphologic (such as degree of fibrosis) and functional parameters. Although biopsy is the gold standard in the diagnosis of liver fibrosis, it has limitations such as being an expensive and invasive method and the possibility of obtaining false-negative results due to the non-homogeneous distribution of fibrosis. Both FIB-4 and FIB-5 have a good correlation with the degree of hepatic fibrosis [4,10]. Moreover, the American Gastroenterology Association emphasises the use of the FIB-4 score to assess the presence and severity of fibrosis in individuals with NAFLD [10].
FLIS scoring is based on the evaluation of liver parenchymal contrast enhancement, biliary contrast excretion, and portal vein signal in MR images obtained 20 minutes after gadoxetic acid injection [7]. Decreased number of functional hepatocytes and impaired cellular transport mechanisms lead to decreased liver contrast enhancement in HBP [11]. Gadoxetic acid uptake depends not only on hepatic function but also on blood flow to the liver [12]. Therefore, it is more effective to evaluate liver contrast enhancement together with biliary excretion and portal vein contrast signal. The consensus report from the 9th International Forum for Liver MRI considers that gadoxetic acid uptake in the hepatobiliary phase may serve as a biomarker to assess liver function and fibrosis [13].
Preserved FLIS scores (FLIS ≥ 4) have been found to be a significant marker for transplant-free survival [6]. Concordance between the raters for FLIS scoring is also high. Similarly, in our study, inter-observer agreement in the grading of high and low FLIS scores was almost perfect, and intra-observer agreement was excellent.
Discrimination of low-risk and high-risk patients by easily applicable, non-invasive methods is important in routine clinical practice. The FIB-4 and FIB-5 scores can be used for this aim. FLIS scoring gives additional information regarding the functional capacity of the liver and allows us to categorise patients based on the degree of liver function as preserved or impaired hepatic function. Therefore, discrimination of the FLIS-based preserved and impaired hepatic function by using the FIB-4 and FIB-5 indexes may have practical clinical significance. In the present study, we found that FIB-4 and FIB-5 had moderate (area under the ROC curve around 0.75-0.80) and similar discriminative values in distinguishing patients with preserved and impaired hepatic function. Specifically, we provided cut-off values for FIB-4 and FIB-5 that are similarly effective in ruling out patients with poor hepatic function (NPV of 98%). Therefore, our study provides information in selecting patients who may or may not require further testing using these low-cost and readily available indexes.
This study has some limitations. The data were obtained in a single centre, and the sample size is modest. Therefore, our results require validation in high-volume studies. On the other hand, considering the recent increase in the prevalence of NAFLD, our study provides cut-off values for FIB-4 and FIB-5 to discriminate preserved and impaired hepatic function with low cost.
Conclusions
This study shows that FIB-4 and FIB-5 scores provide useful information regarding FLIS scores. Specifically, FIB-4 values of < 4.2 and FIB-5 values of > 36.2 are valuable in excluding patients with poor hepatic function (FLIS < 4). This may assist clinicians in deciding on further diagnostic work-up using a simple blood test.